| Param | Original file | Final file |
|---|---|---|
| Filename | modeM0/AS1A07_011T01_9000003482_23523cztM0_level2.evt | modeM0/AS1A07_011T01_9000003482_23523cztM0_level2_quad_clean.evt |
| Size (bytes) | 112,665,600 | 31,115,520 |
| Size | 107.4 MB | 29.7 MB |
| Events in quadrant A | 771,681 | 212,111 |
| Events in quadrant B | 929,202 | 213,662 |
| Events in quadrant C | 757,595 | 204,591 |
| Events in quadrant D | 850,308 | 201,798 |
| Mode M9 | |||
|---|---|---|---|
| Quadrant | BADHDUFLAG | Total packets | Discarded packets |
| A | 0 | 12 | 0 |
| B | 0 | 12 | 0 |
| C | 0 | 12 | 0 |
| D | 0 | 12 | 0 |
| Mode SS | |||
|---|---|---|---|
| Quadrant | BADHDUFLAG | Total packets | Discarded packets |
| A | 0 | 30 | 0 |
| B | 0 | 30 | 0 |
| C | 0 | 30 | 0 |
| D | 0 | 30 | 0 |
| Mode M0 | |||
|---|---|---|---|
| Quadrant | BADHDUFLAG | Total packets | Discarded packets |
| A | 0 | 3189 | 1 |
| B | 0 | 3721 | 1 |
| C | 0 | 3184 | 1 |
| D | 0 | 3504 | 1 |
| Quadrant | Total seconds | Saturated seconds | Saturation percentage |
|---|---|---|---|
| A | 1483 | 105 | 7.080243% |
| B | 1483 | 120 | 8.091706% |
| C | 1483 | 75 | 5.057316% |
| D | 1483 | 99 | 6.675657% |
Noise dominated data is calculated using 1-second bins in cleaned event files. If a bin has >2000 counts, and if more than 50% of those come from <1% of pixels, then it is considered to be noise-dominated and hence unusable.
| Quadrant | # 1 sec bins | Bins with >0 counts | Bins with >2000 counts | High rate bins dominated by noise | Noise dominated (total time) | Noise dominated (detector-on time) | Marked lightcurve |
|---|---|---|---|---|---|---|---|
| A | 2618 | 1483 | 0 | 0 | 0.00% | 0.00% | 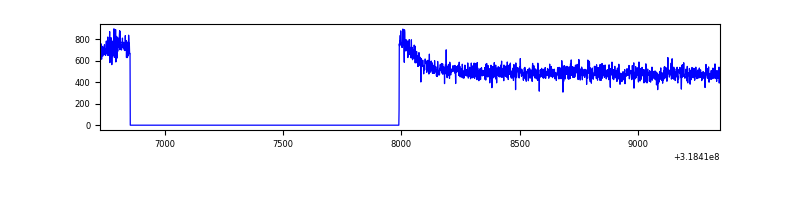 |
| B | 2618 | 1483 | 3 | 3 | 0.11% | 0.20% | 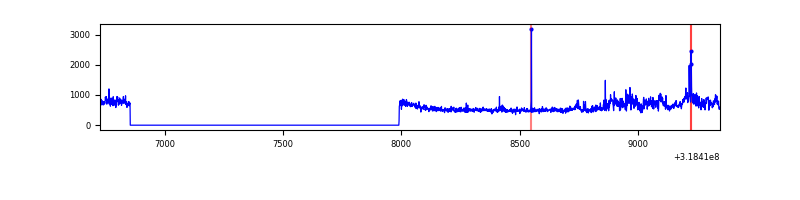 |
| C | 2618 | 1483 | 0 | 0 | 0.00% | 0.00% | 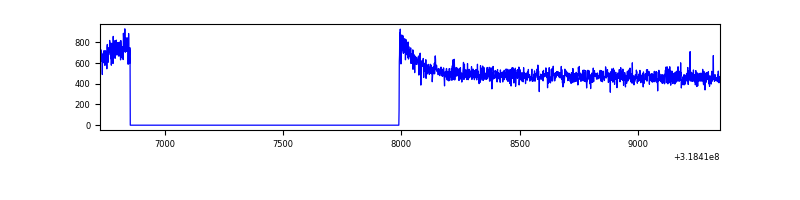 |
| D | 2618 | 1483 | 10 | 10 | 0.38% | 0.67% | 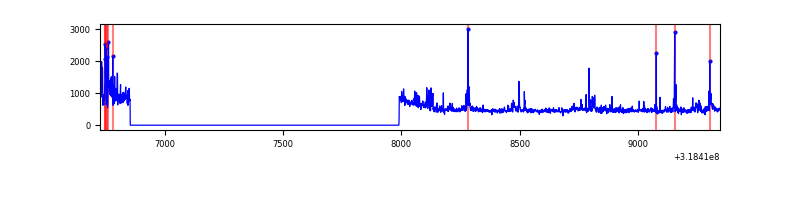 |
Top three noisy pixels from each quadrant. If the there are fewer than three noisy pixels in the level2.evt file, extra rows are filled as -1
| Pixel properties | Quadrant properties | ||||||
|---|---|---|---|---|---|---|---|
| Quadrant | DetID | PixID | Counts | Sigma | Mean | Median | Sigma |
| A | 13 | 254 | 2474 | 54.52 | 200 | 195 | 41.8 |
| A | 0 | 226 | 1788 | 38.11 | 200 | 195 | 41.8 |
| A | 3 | 137 | 1662 | 35.09 | 200 | 195 | 41.8 |
| B | 0 | 189 | 135467 | 3465.28 | 193 | 188 | 39.0 |
| B | 0 | 229 | 16812 | 425.84 | 193 | 188 | 39.0 |
| B | 0 | 230 | 8732 | 218.86 | 193 | 188 | 39.0 |
| C | 14 | 238 | 29824 | 670.7 | 185 | 186 | 44.2 |
| C | 7 | 247 | 3182 | 67.8 | 185 | 186 | 44.2 |
| C | 13 | 61 | 1354 | 26.43 | 185 | 186 | 44.2 |
| D | 1 | 52 | 129015 | 2731.02 | 189 | 183 | 47.2 |
| D | 2 | 234 | 5160 | 105.5 | 189 | 183 | 47.2 |
| D | 3 | 238 | 2979 | 59.27 | 189 | 183 | 47.2 |
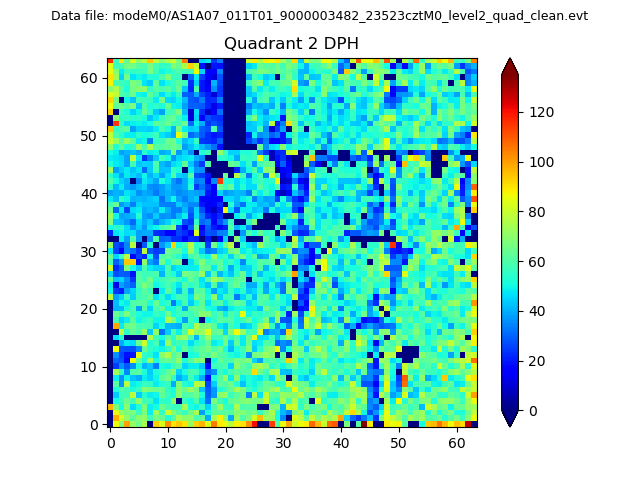
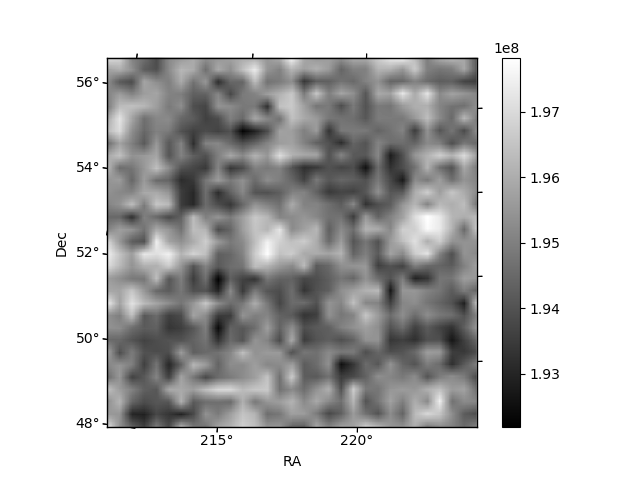
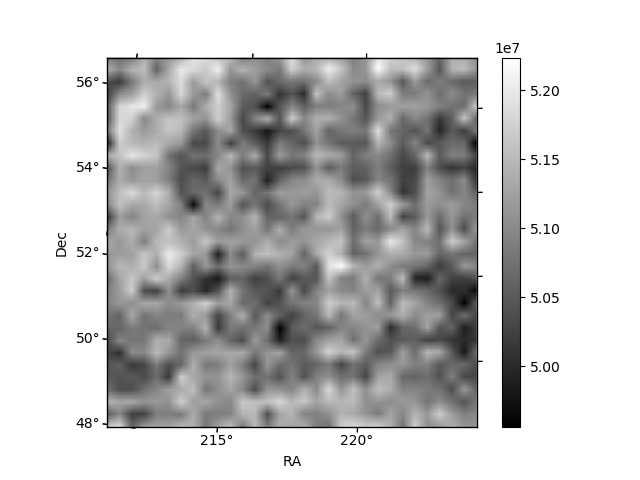
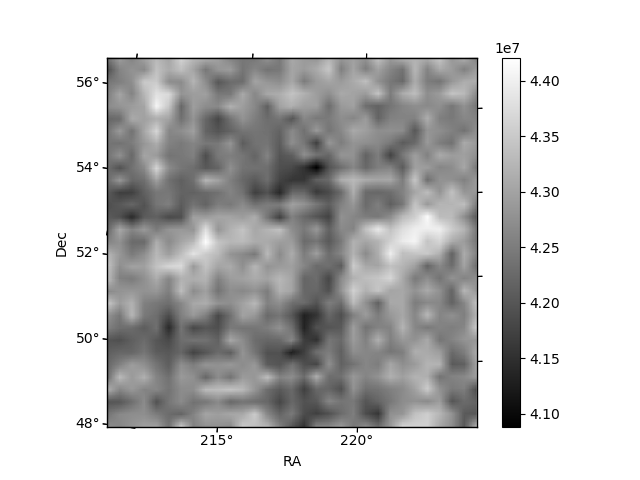
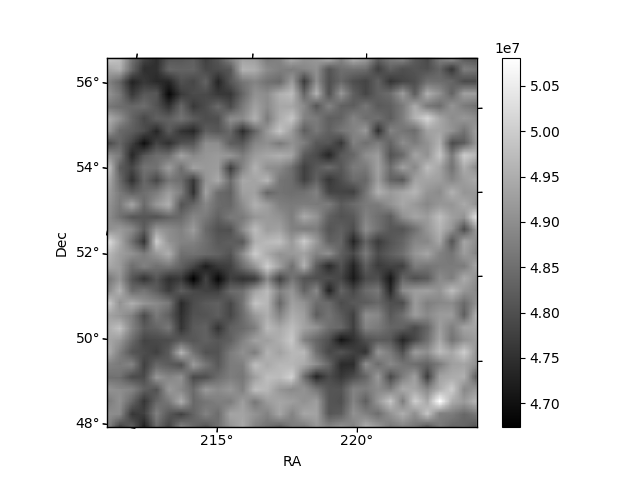
Histogram calculated using DETX and DETY for each event in the final _common_clean file
| Quadrant A | 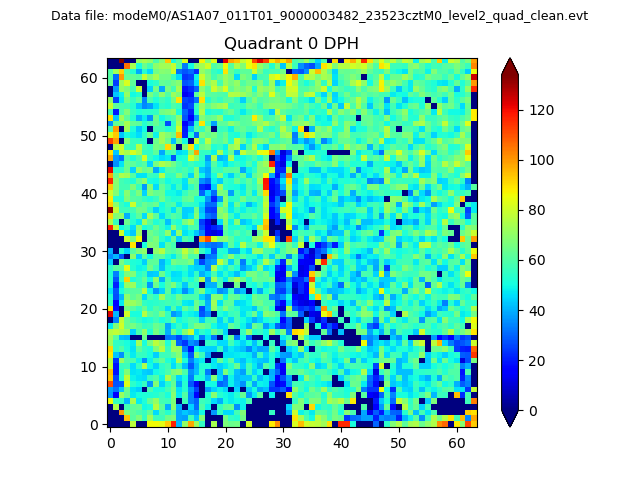 |
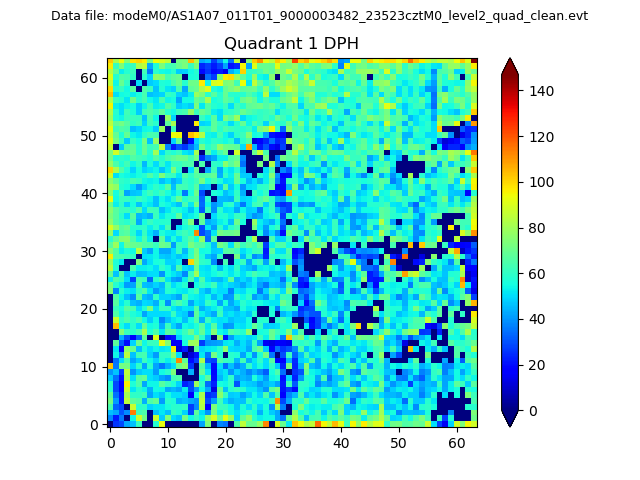 |
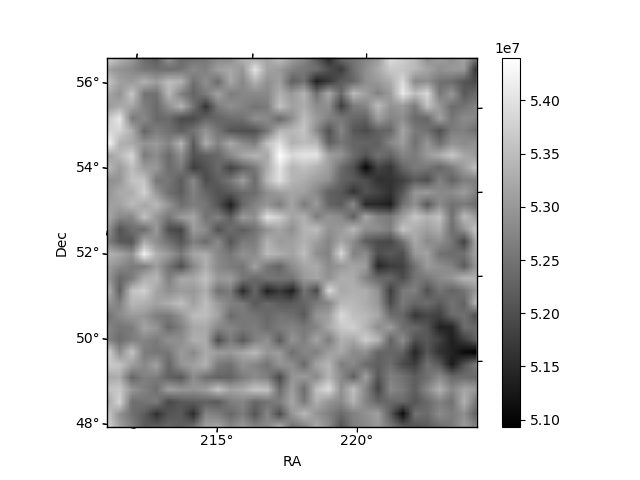
Quadrant B |
|---|---|---|---|
| Quadrant D | 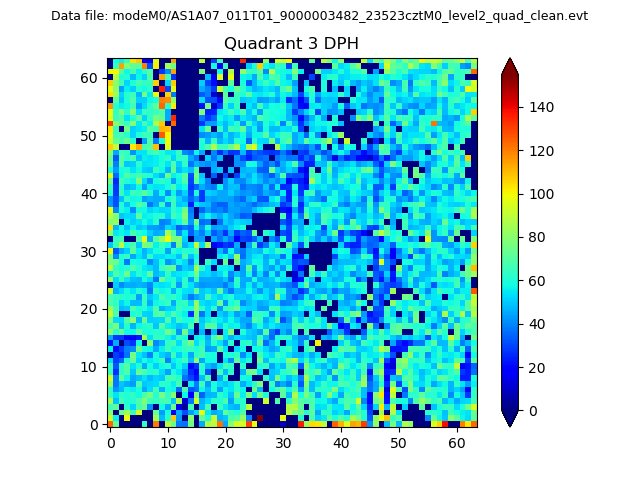 |
 |
Quadrant C |
| Plot type | Count rate plots | Images |
|---|---|---|
| Comparison with Poisson distribution Blue bars denote a histogram of data divided into 1 sec bins. Red curve is a Poisson curve with rate = median count rate of data. |
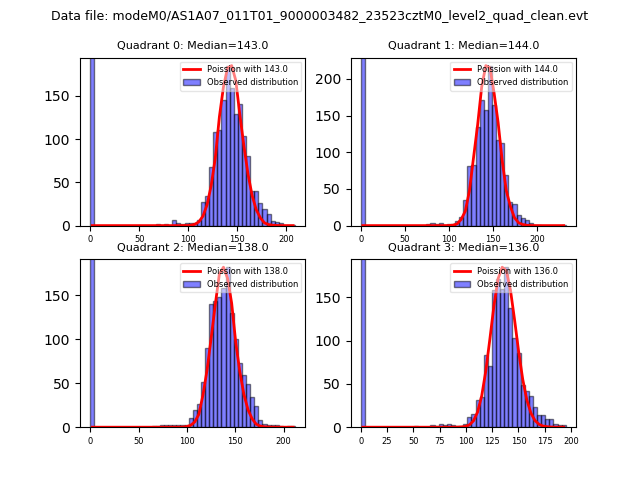 |
 |
| Quadrant-wise count rates Data is divided into 100 sec bins |
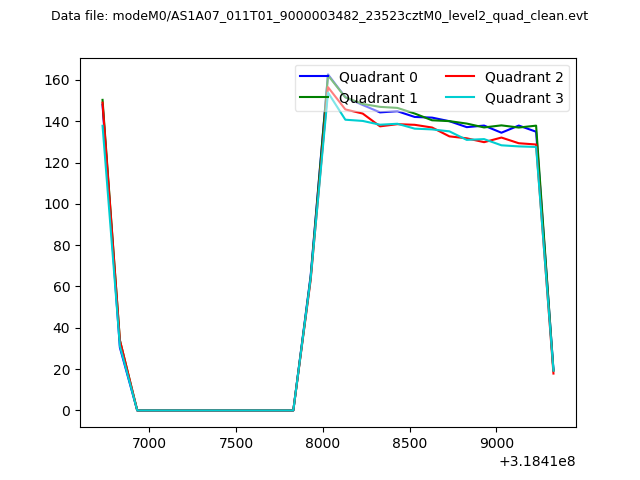 |
|
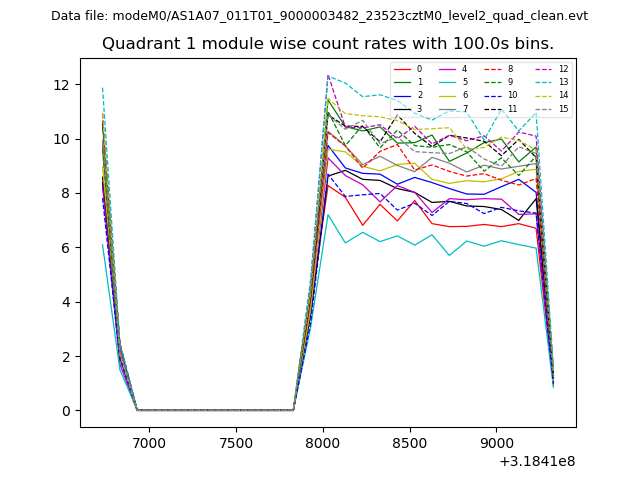
| Module-wise count rates for Quadrant A Data is divided into 100 sec bins |
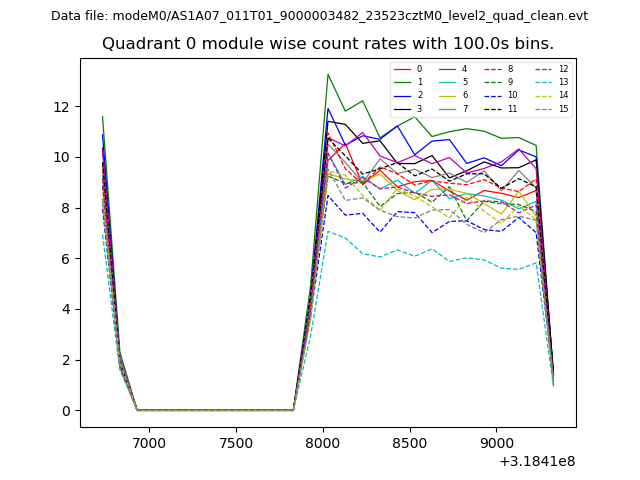 |
 |
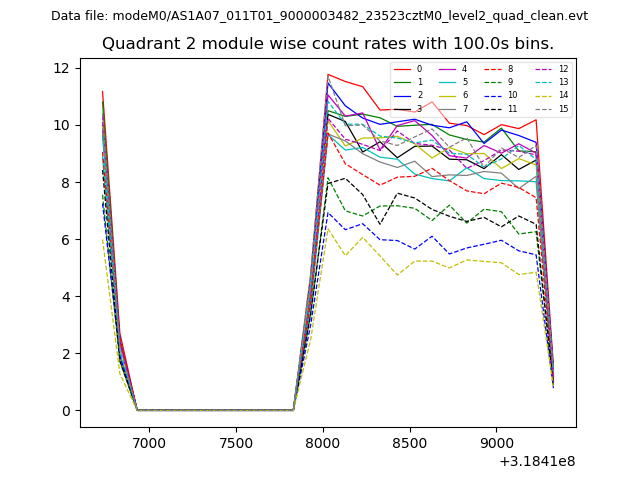
| Module-wise count rates for Quadrant B Data is divided into 100 sec bins |
 |
 |
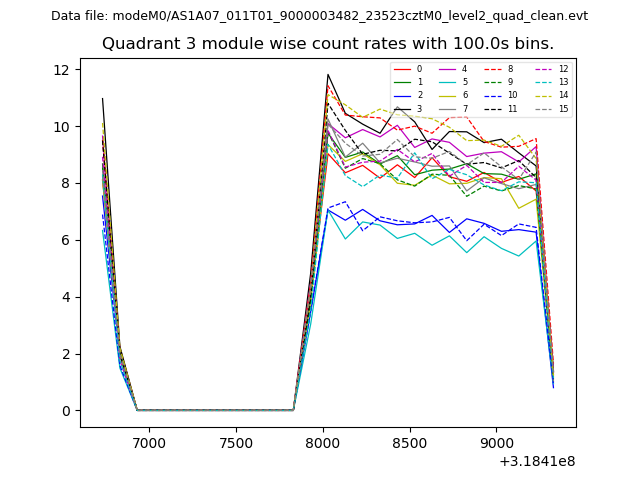
| Module-wise count rates for Quadrant C Data is divided into 100 sec bins |
 |
 |
| Module-wise count rates for Quadrant D Data is divided into 100 sec bins |
 |
 |
| Parameter | Plot |
|---|---|
| CZT HV Monitor | 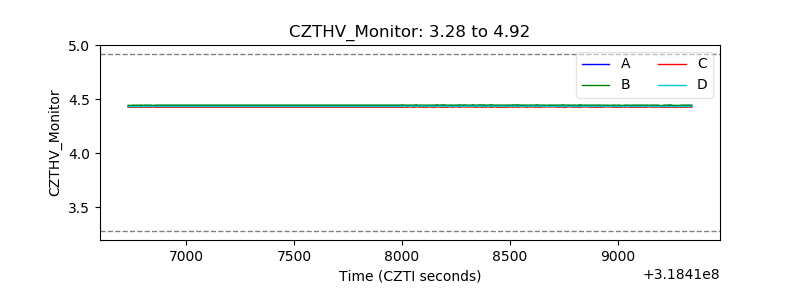 |
| D_VDD | 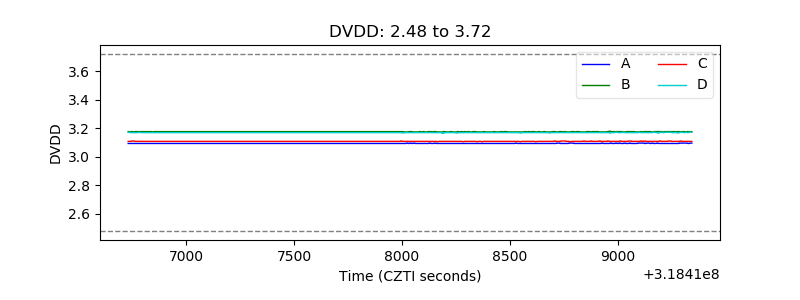 |
| Temperature 1 | 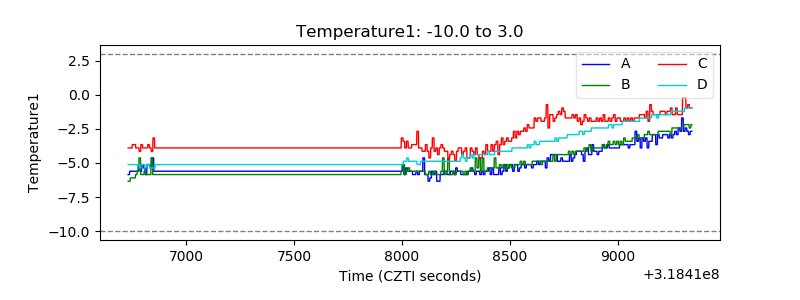 |
| Veto HV Monitor | 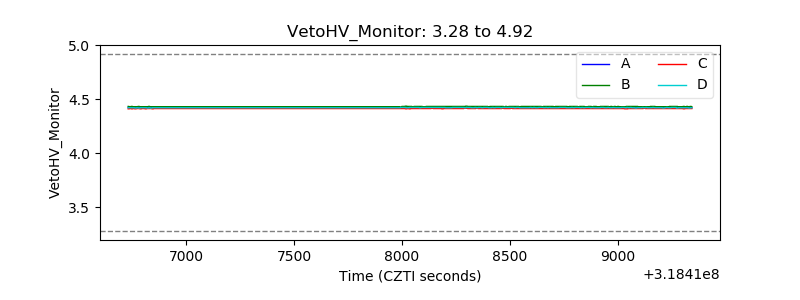 |
| Veto LLD | 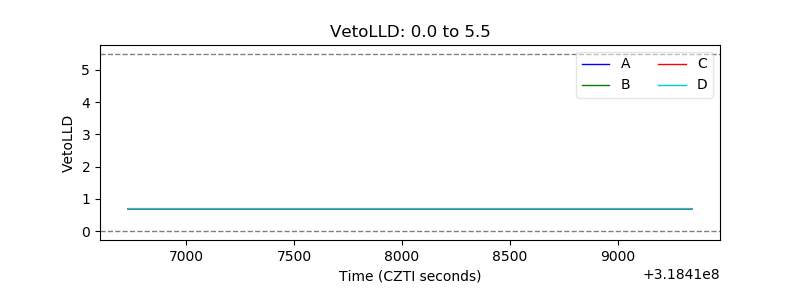 |
| Alpha Counter | 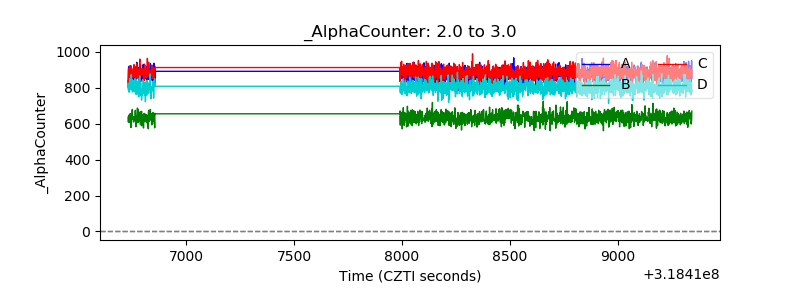 |
| _CPM_Rate | 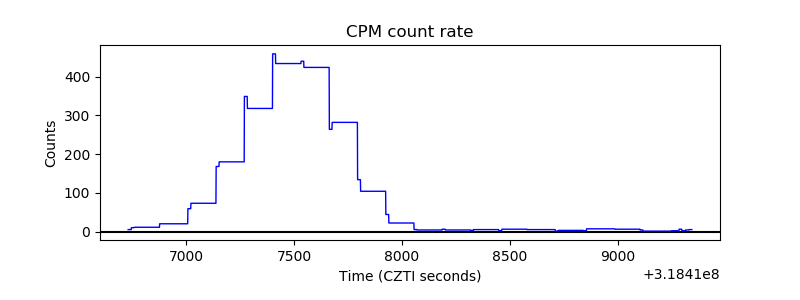 |
| CZT Counter | 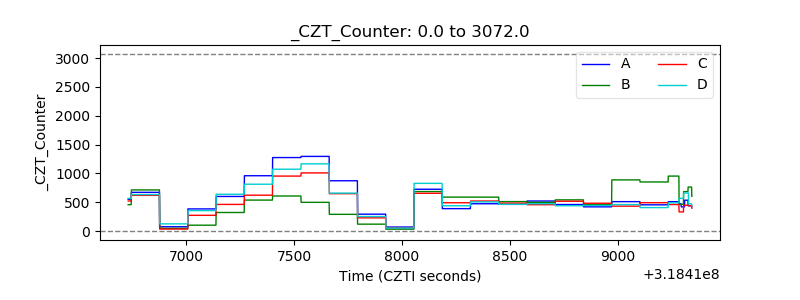 |
| +2.5 Volts monitor |  |
| +5 Volts monitor | 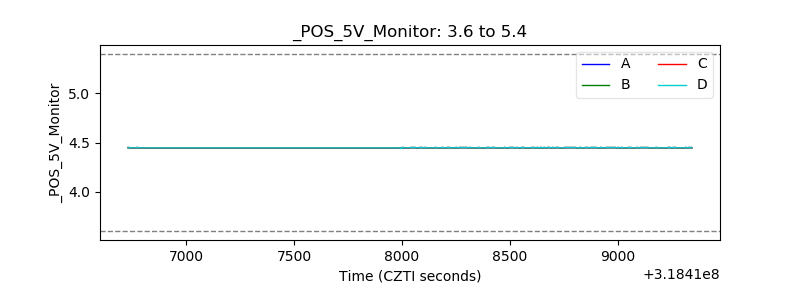 |
| _ROLL_ROT | 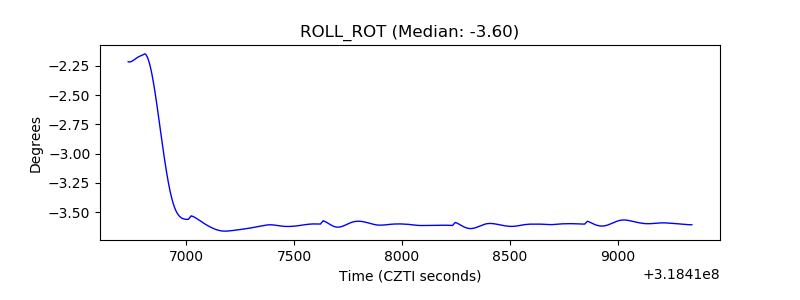 |
| _Roll_DEC | 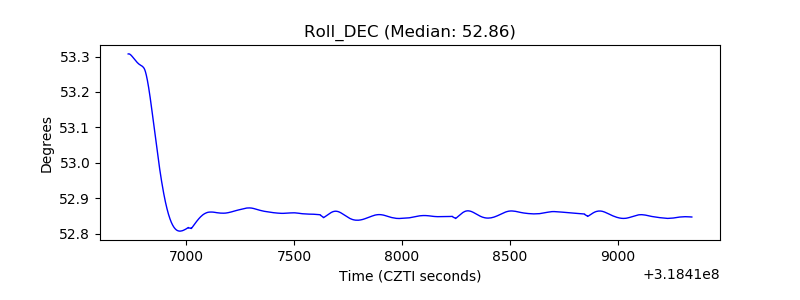 |
| _Roll_RA | 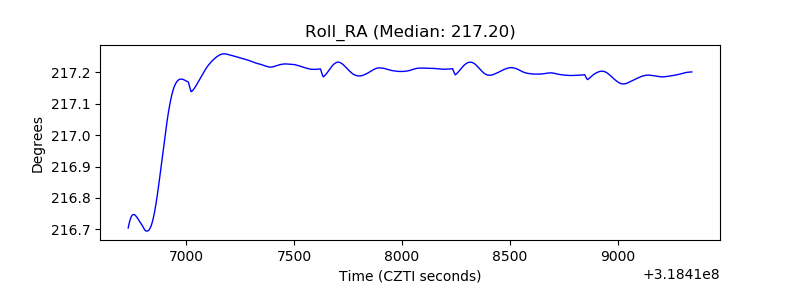 |
| Veto Counter | 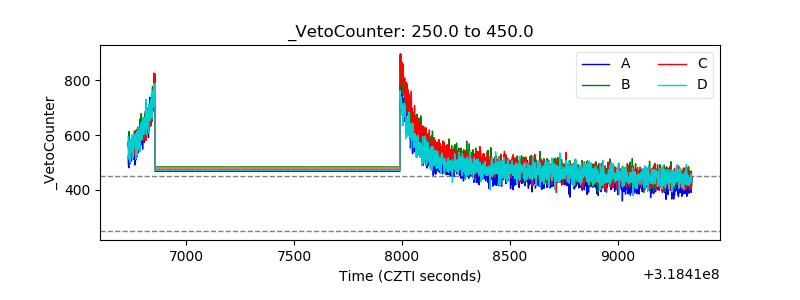 |