| Param | Original file | Final file |
|---|---|---|
| Filename | modeM0/AS1A07_011T01_9000003482_23524cztM0_level2.evt | modeM0/AS1A07_011T01_9000003482_23524cztM0_level2_quad_clean.evt |
| Size (bytes) | 460,523,520 | 87,857,280 |
| Size | 439.2 MB | 83.8 MB |
| Events in quadrant A | 2,987,525 | 568,004 |
| Events in quadrant B | 3,746,582 | 566,771 |
| Events in quadrant C | 3,079,674 | 546,939 |
| Events in quadrant D | 3,703,665 | 537,661 |
| Mode M9 | |||
|---|---|---|---|
| Quadrant | BADHDUFLAG | Total packets | Discarded packets |
| A | 0 | 8 | 0 |
| B | 0 | 8 | 0 |
| C | 0 | 8 | 0 |
| D | 0 | 8 | 0 |
| Mode SS | |||
|---|---|---|---|
| Quadrant | BADHDUFLAG | Total packets | Discarded packets |
| A | 0 | 128 | 0 |
| B | 0 | 128 | 0 |
| C | 0 | 128 | 0 |
| D | 0 | 128 | 0 |
| Mode M0 | |||
|---|---|---|---|
| Quadrant | BADHDUFLAG | Total packets | Discarded packets |
| A | 0 | 12853 | 1 |
| B | 0 | 15099 | 1 |
| C | 0 | 13081 | 1 |
| D | 0 | 15178 | 1 |
| Quadrant | Total seconds | Saturated seconds | Saturation percentage |
|---|---|---|---|
| A | 6322 | 67 | 1.059791% |
| B | 6323 | 146 | 2.309031% |
| C | 6323 | 93 | 1.470821% |
| D | 6323 | 201 | 3.178871% |
Noise dominated data is calculated using 1-second bins in cleaned event files. If a bin has >2000 counts, and if more than 50% of those come from <1% of pixels, then it is considered to be noise-dominated and hence unusable.
| Quadrant | # 1 sec bins | Bins with >0 counts | Bins with >2000 counts | High rate bins dominated by noise | Noise dominated (total time) | Noise dominated (detector-on time) | Marked lightcurve |
|---|---|---|---|---|---|---|---|
| A | 7172 | 6322 | 0 | 0 | 0.00% | 0.00% | 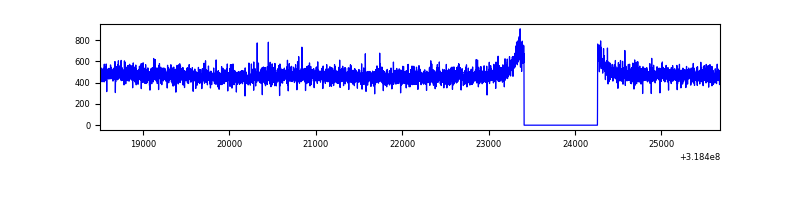 |
| B | 7173 | 6323 | 49 | 49 | 0.68% | 0.77% | 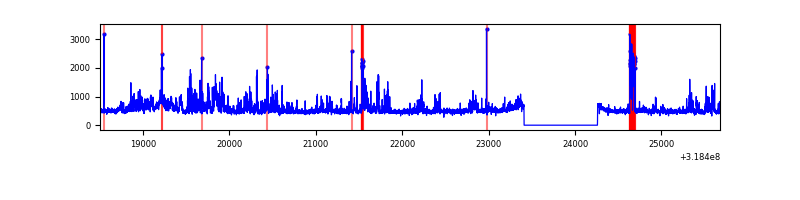 |
| C | 7173 | 6323 | 4 | 4 | 0.06% | 0.06% | 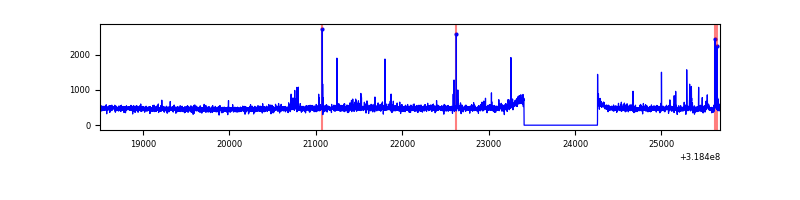 |
| D | 7173 | 6323 | 163 | 163 | 2.27% | 2.58% | 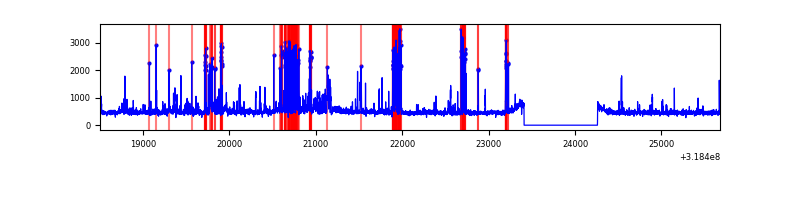 |
Top three noisy pixels from each quadrant. If the there are fewer than three noisy pixels in the level2.evt file, extra rows are filled as -1
| Pixel properties | Quadrant properties | ||||||
|---|---|---|---|---|---|---|---|
| Quadrant | DetID | PixID | Counts | Sigma | Mean | Median | Sigma |
| A | 13 | 254 | 11180 | 67.03 | 774 | 759 | 155.5 |
| A | 0 | 226 | 6747 | 38.51 | 774 | 759 | 155.5 |
| A | 3 | 137 | 6542 | 37.2 | 774 | 759 | 155.5 |
| B | 0 | 189 | 594208 | 4162.3 | 758 | 741 | 142.6 |
| B | 15 | 33 | 38484 | 264.71 | 758 | 741 | 142.6 |
| B | 0 | 229 | 38009 | 261.38 | 758 | 741 | 142.6 |
| C | 14 | 238 | 117740 | 690.07 | 732 | 735 | 169.6 |
| C | 2 | 16 | 53860 | 313.32 | 732 | 735 | 169.6 |
| C | 0 | 207 | 42967 | 249.07 | 732 | 735 | 169.6 |
| D | 1 | 52 | 811386 | 4490.31 | 745 | 723 | 180.5 |
| D | 2 | 234 | 27744 | 149.67 | 745 | 723 | 180.5 |
| D | 8 | 195 | 11823 | 61.48 | 745 | 723 | 180.5 |
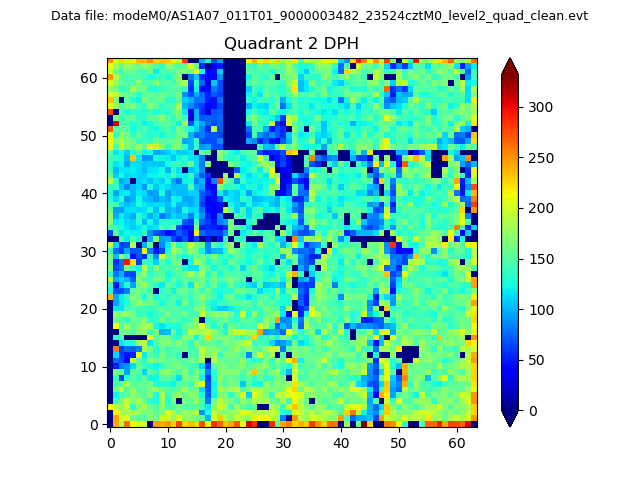
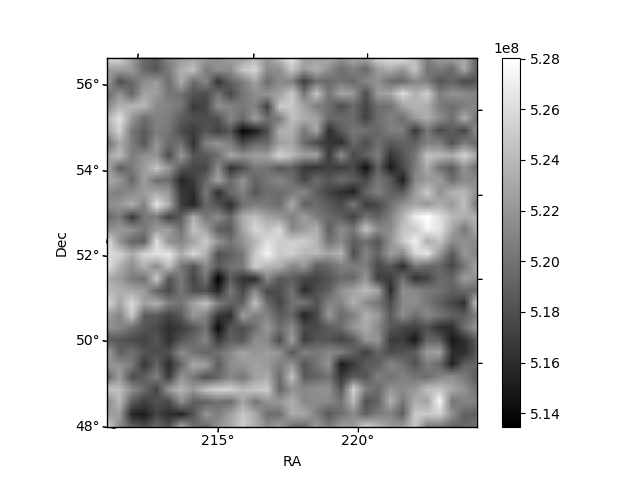
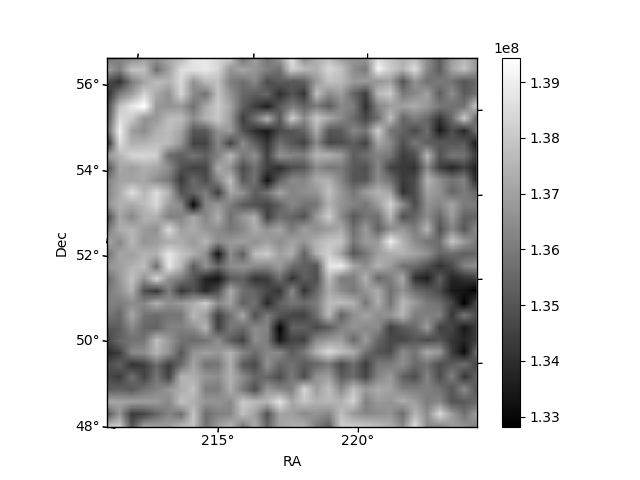
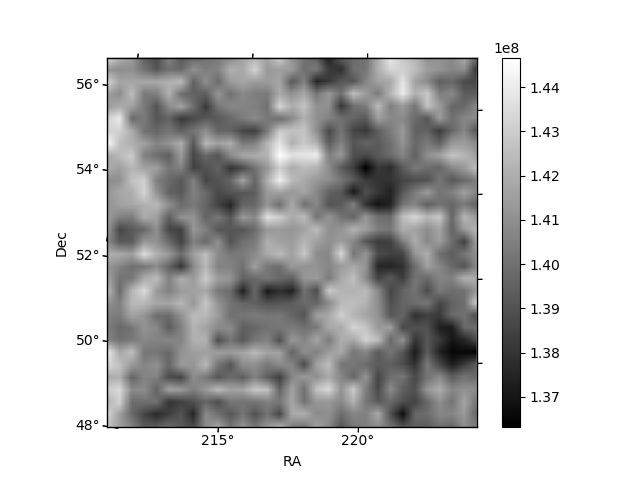
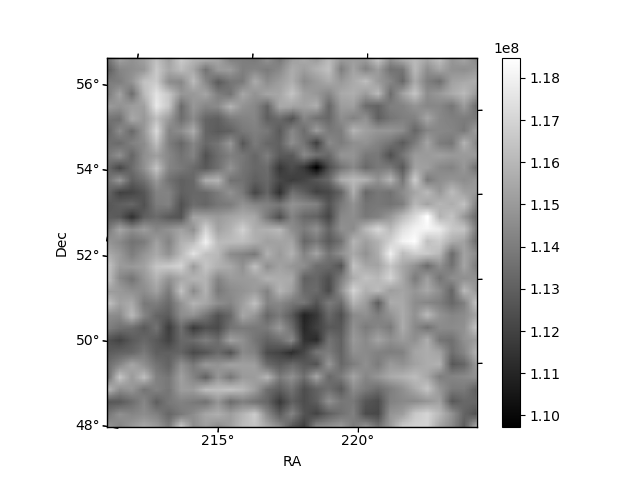
Histogram calculated using DETX and DETY for each event in the final _common_clean file
| Quadrant A | 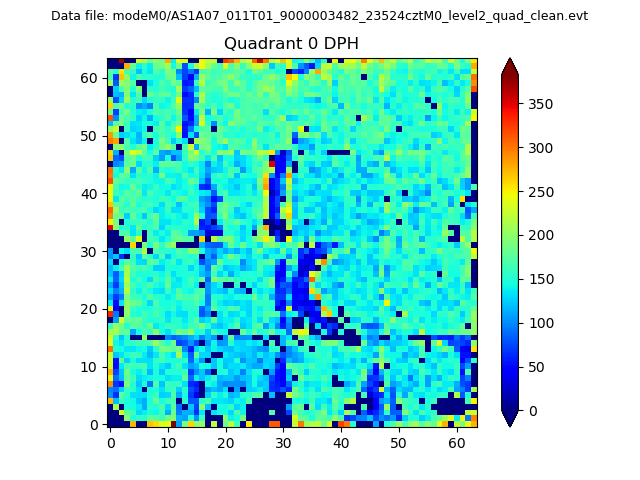 |
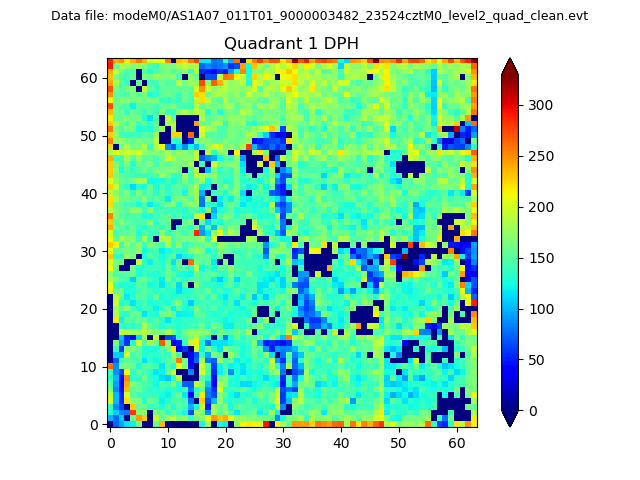 |
Quadrant B |
|---|---|---|---|
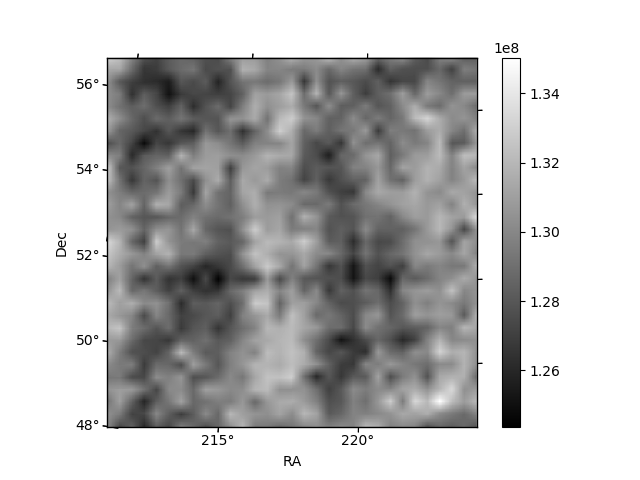
| Quadrant D | 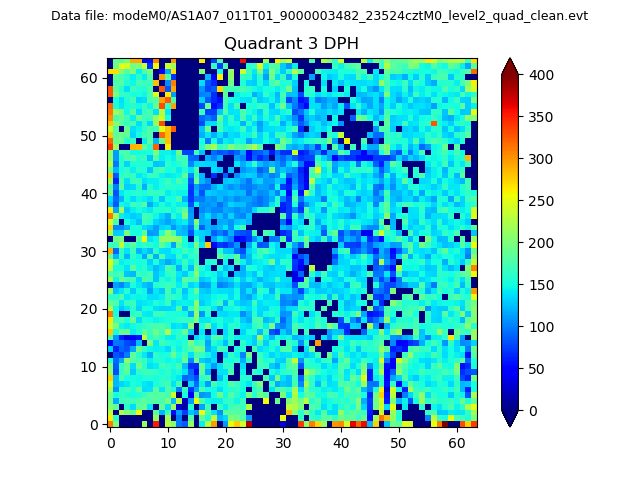 |
 |
Quadrant C |
| Plot type | Count rate plots | Images |
|---|---|---|
| Comparison with Poisson distribution Blue bars denote a histogram of data divided into 1 sec bins. Red curve is a Poisson curve with rate = median count rate of data. |
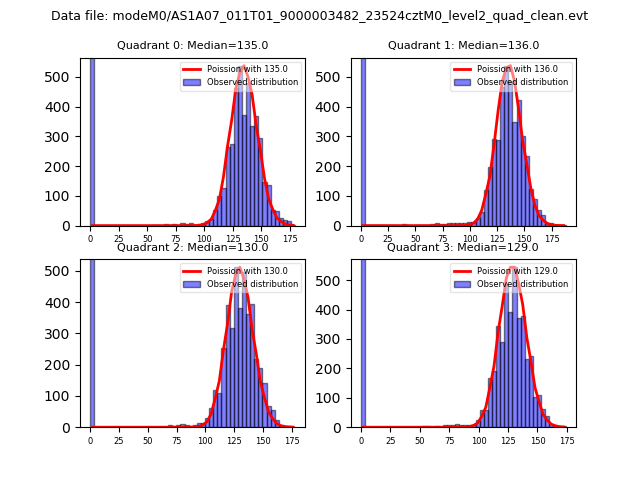 |
 |
| Quadrant-wise count rates Data is divided into 100 sec bins |
 |
|
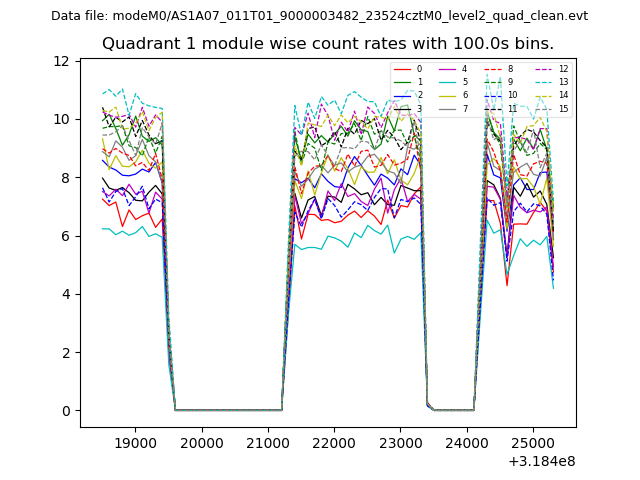
| Module-wise count rates for Quadrant A Data is divided into 100 sec bins |
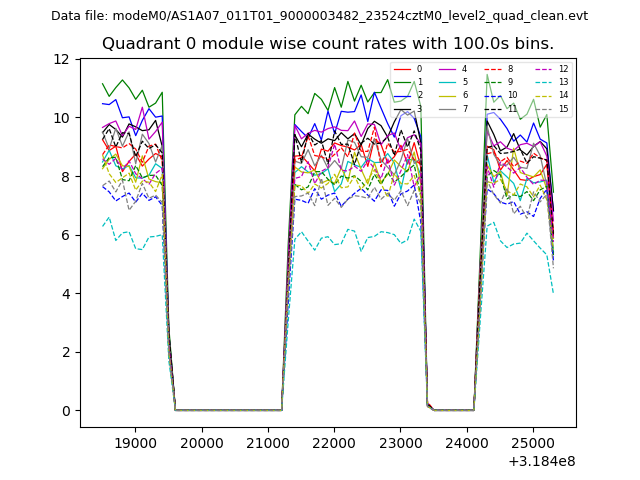 |
 |
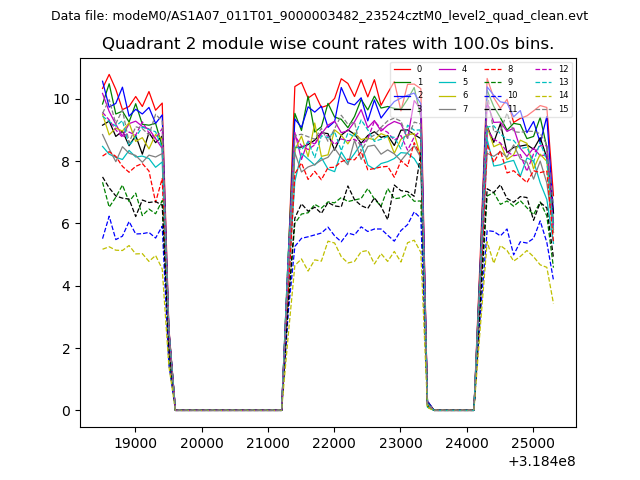
| Module-wise count rates for Quadrant B Data is divided into 100 sec bins |
 |
 |
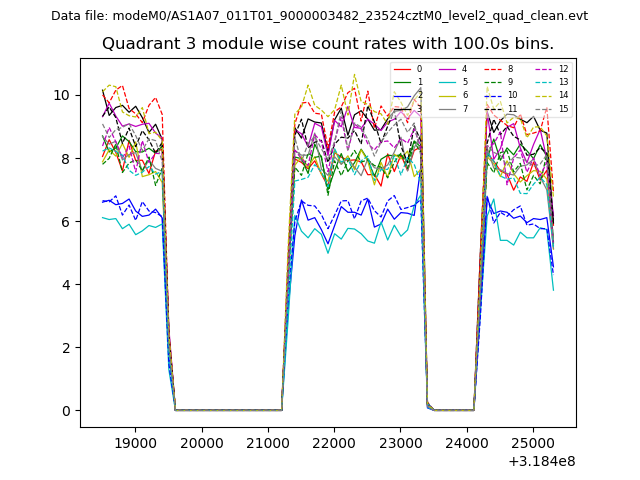
| Module-wise count rates for Quadrant C Data is divided into 100 sec bins |
 |
 |
| Module-wise count rates for Quadrant D Data is divided into 100 sec bins |
 |
 |
| Parameter | Plot |
|---|---|
| CZT HV Monitor | 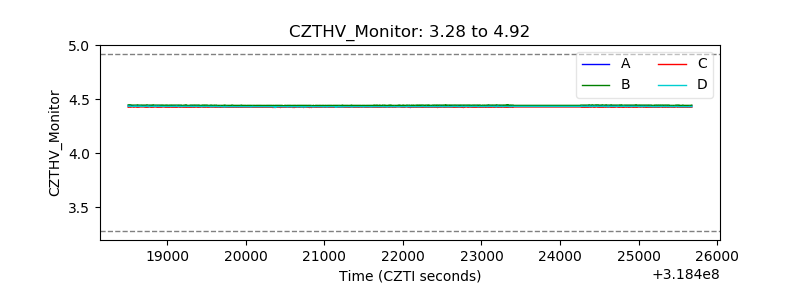 |
| D_VDD | 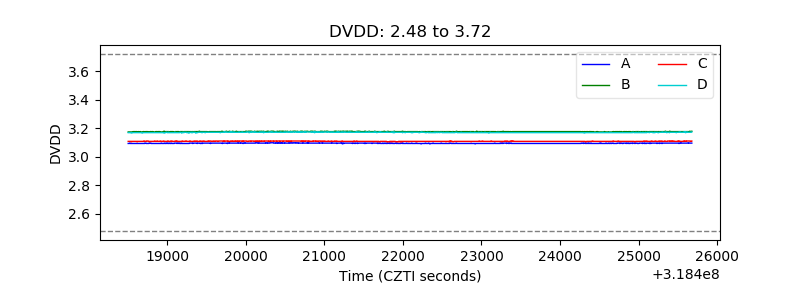 |
| Temperature 1 | 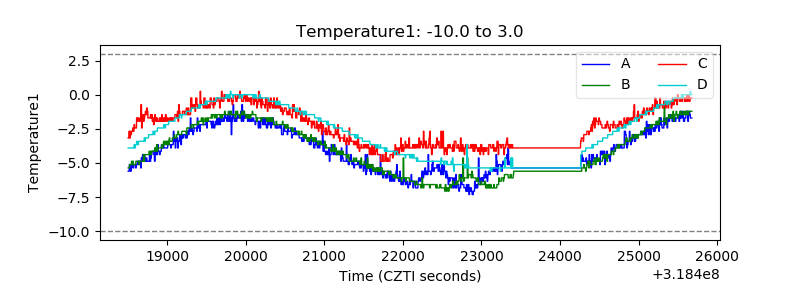 |
| Veto HV Monitor | 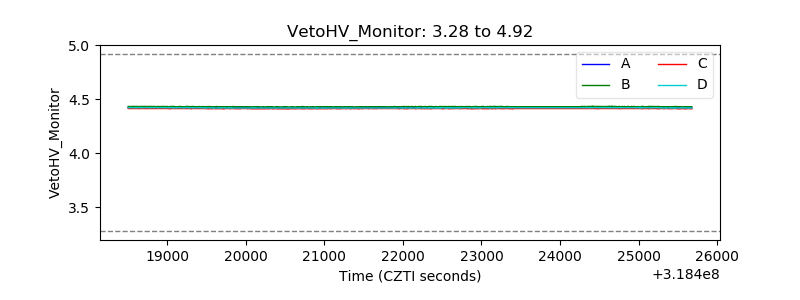 |
| Veto LLD | 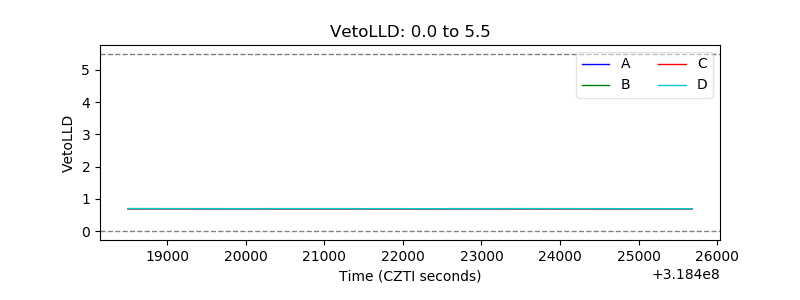 |
| Alpha Counter |  |
| _CPM_Rate |  |
| CZT Counter | 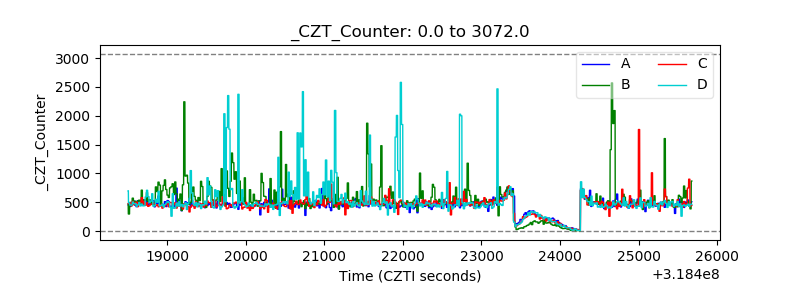 |
| +2.5 Volts monitor |  |
| +5 Volts monitor |  |
| _ROLL_ROT | 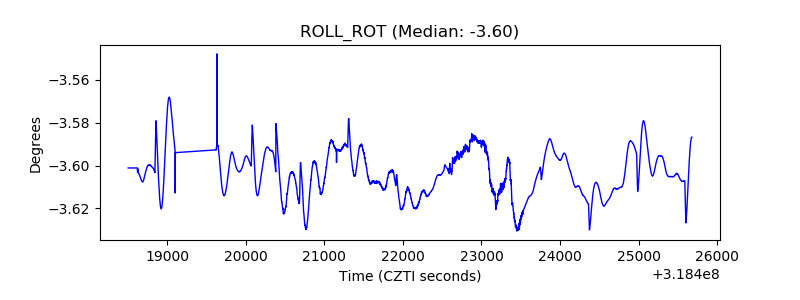 |
| _Roll_DEC | 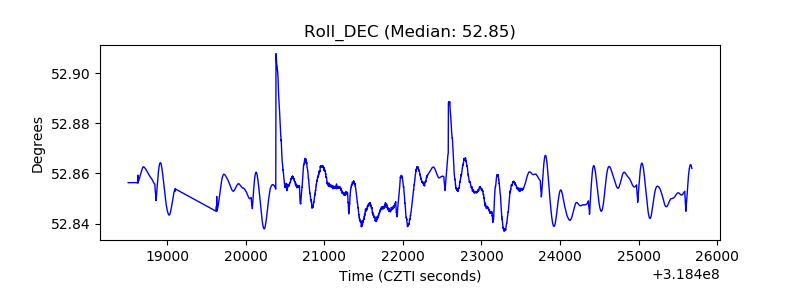 |
| _Roll_RA | 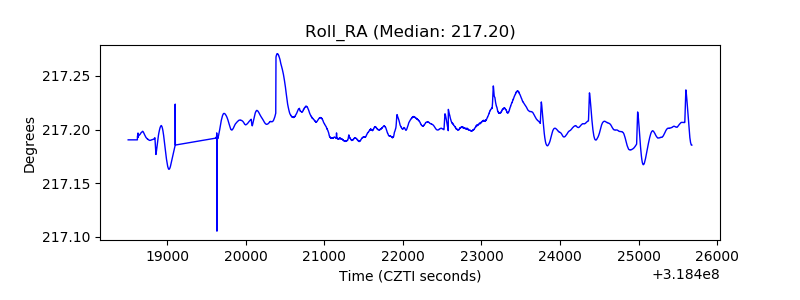 |
| Veto Counter | 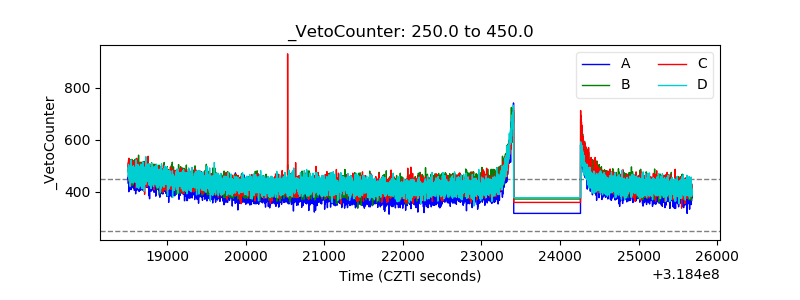 |