| Param | Original file | Final file |
|---|---|---|
| Filename | modeM0/AS1A07_011T01_9000003482_23525cztM0_level2.evt | modeM0/AS1A07_011T01_9000003482_23525cztM0_level2_quad_clean.evt |
| Size (bytes) | 536,472,000 | 98,867,520 |
| Size | 511.6 MB | 94.3 MB |
| Events in quadrant A | 3,608,578 | 626,864 |
| Events in quadrant B | 4,391,593 | 629,502 |
| Events in quadrant C | 3,711,310 | 607,848 |
| Events in quadrant D | 4,018,531 | 599,942 |
| Mode M9 | |||
|---|---|---|---|
| Quadrant | BADHDUFLAG | Total packets | Discarded packets |
| A | 0 | 4 | 0 |
| B | 0 | 5 | 0 |
| C | 0 | 5 | 0 |
| D | 0 | 5 | 0 |
| Mode SS | |||
|---|---|---|---|
| Quadrant | BADHDUFLAG | Total packets | Discarded packets |
| A | 0 | 154 | 0 |
| B | 0 | 154 | 0 |
| C | 0 | 154 | 0 |
| D | 0 | 154 | 0 |
| Mode M0 | |||
|---|---|---|---|
| Quadrant | BADHDUFLAG | Total packets | Discarded packets |
| A | 0 | 15659 | 2 |
| B | 0 | 17815 | 4 |
| C | 0 | 15861 | 2 |
| D | 0 | 16971 | 2 |
| Quadrant | Total seconds | Saturated seconds | Saturation percentage |
|---|---|---|---|
| A | 7616 | 140 | 1.838235% |
| B | 7615 | 258 | 3.388050% |
| C | 7615 | 177 | 2.324360% |
| D | 7615 | 167 | 2.193040% |
Noise dominated data is calculated using 1-second bins in cleaned event files. If a bin has >2000 counts, and if more than 50% of those come from <1% of pixels, then it is considered to be noise-dominated and hence unusable.
| Quadrant | # 1 sec bins | Bins with >0 counts | Bins with >2000 counts | High rate bins dominated by noise | Noise dominated (total time) | Noise dominated (detector-on time) | Marked lightcurve |
|---|---|---|---|---|---|---|---|
| A | 7961 | 7616 | 2 | 2 | 0.03% | 0.03% | 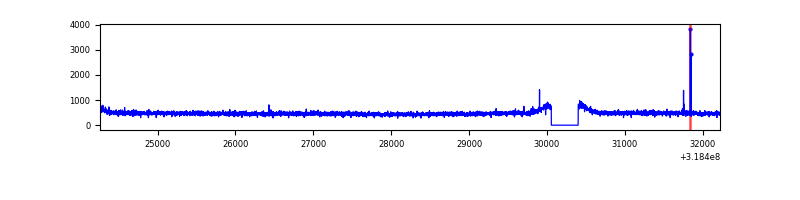 |
| B | 7960 | 7615 | 62 | 62 | 0.78% | 0.81% | 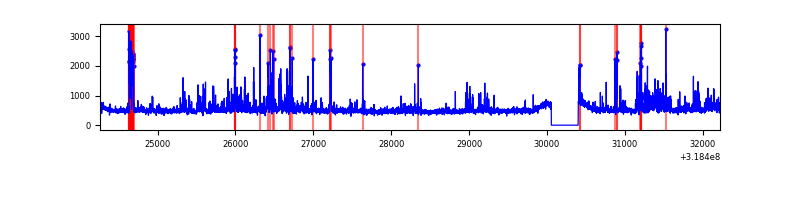 |
| C | 7960 | 7615 | 3 | 3 | 0.04% | 0.04% | 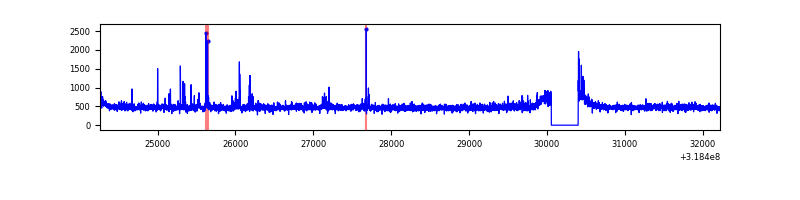 |
| D | 7960 | 7616 | 49 | 49 | 0.62% | 0.64% | 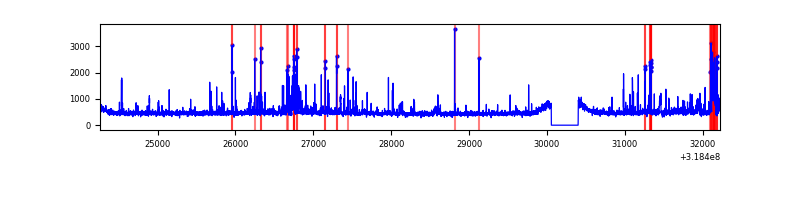 |
Top three noisy pixels from each quadrant. If the there are fewer than three noisy pixels in the level2.evt file, extra rows are filled as -1
| Pixel properties | Quadrant properties | ||||||
|---|---|---|---|---|---|---|---|
| Quadrant | DetID | PixID | Counts | Sigma | Mean | Median | Sigma |
| A | 13 | 254 | 14191 | 70.53 | 932 | 911 | 188.3 |
| A | 10 | 253 | 10671 | 51.83 | 932 | 911 | 188.3 |
| A | 0 | 226 | 8187 | 38.64 | 932 | 911 | 188.3 |
| B | 0 | 189 | 493558 | 2825.64 | 915 | 891 | 174.4 |
| B | 3 | 64 | 118020 | 671.78 | 915 | 891 | 174.4 |
| B | 0 | 230 | 64872 | 366.96 | 915 | 891 | 174.4 |
| C | 14 | 238 | 139511 | 681.48 | 881 | 884 | 203.4 |
| C | 2 | 16 | 71540 | 347.34 | 881 | 884 | 203.4 |
| C | 0 | 10 | 19778 | 92.88 | 881 | 884 | 203.4 |
| D | 1 | 52 | 292760 | 1327.08 | 901 | 873 | 219.9 |
| D | 7 | 238 | 180385 | 816.16 | 901 | 873 | 219.9 |
| D | 2 | 234 | 35052 | 155.4 | 901 | 873 | 219.9 |
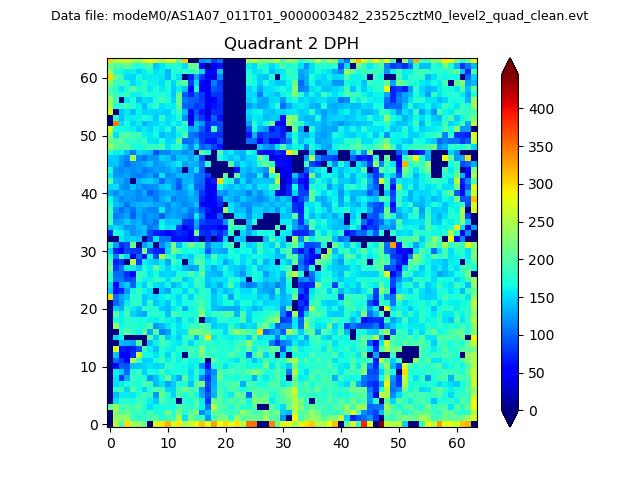
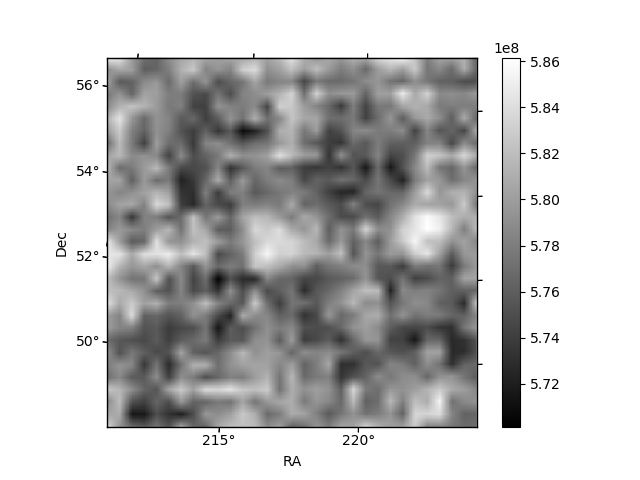
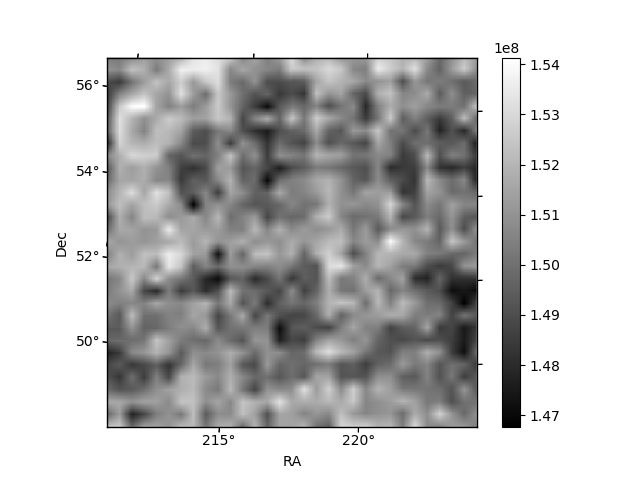
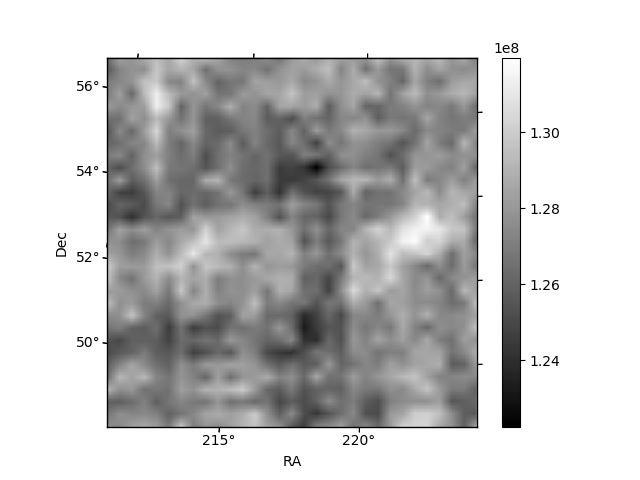
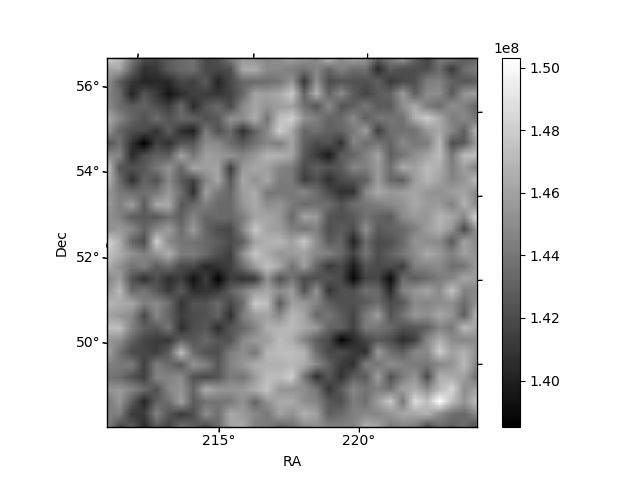
Histogram calculated using DETX and DETY for each event in the final _common_clean file
| Quadrant A | 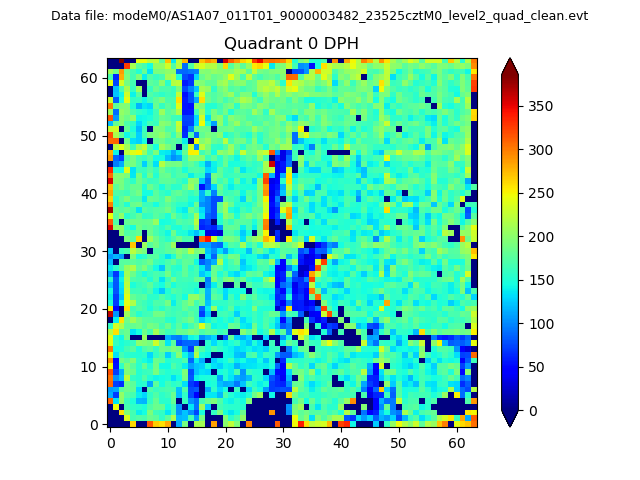 |
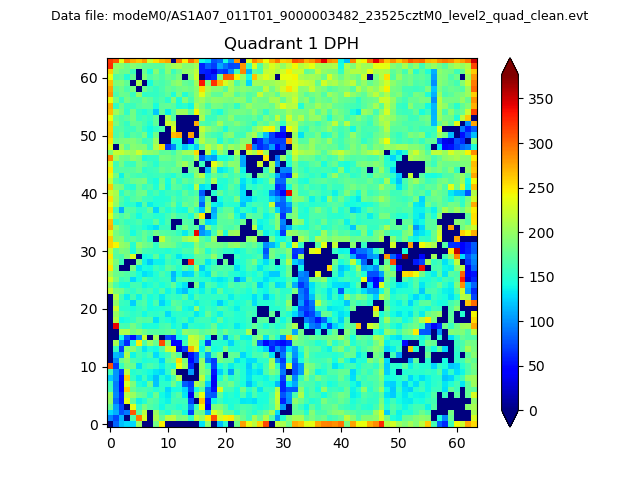 |
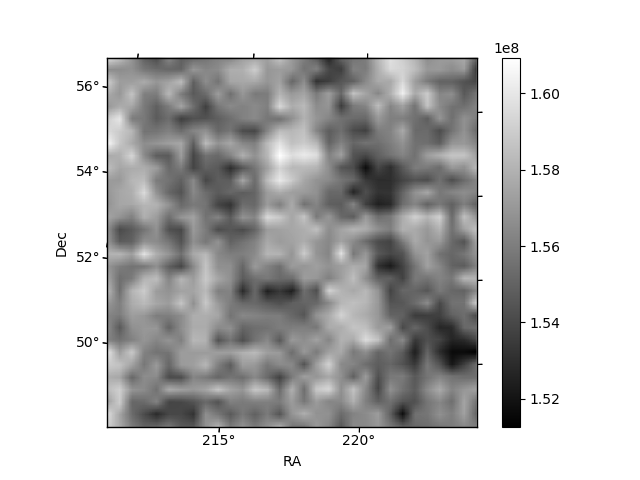
Quadrant B |
|---|---|---|---|
| Quadrant D | 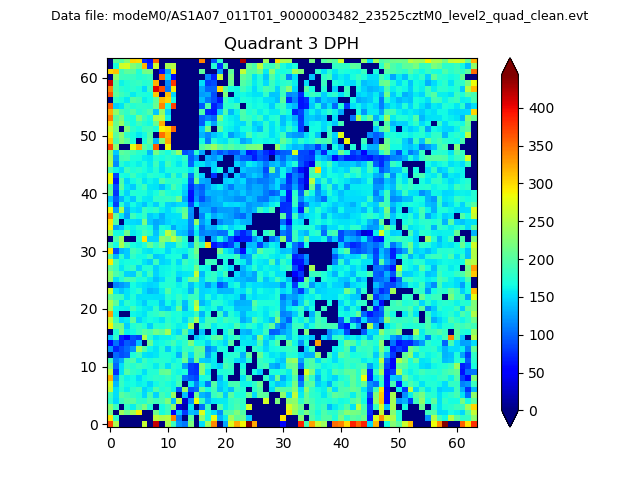 |
 |
Quadrant C |
| Plot type | Count rate plots | Images |
|---|---|---|
| Comparison with Poisson distribution Blue bars denote a histogram of data divided into 1 sec bins. Red curve is a Poisson curve with rate = median count rate of data. |
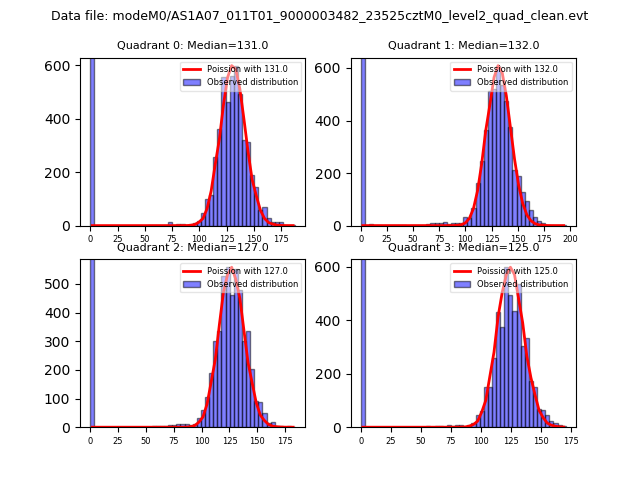 |
 |
| Quadrant-wise count rates Data is divided into 100 sec bins |
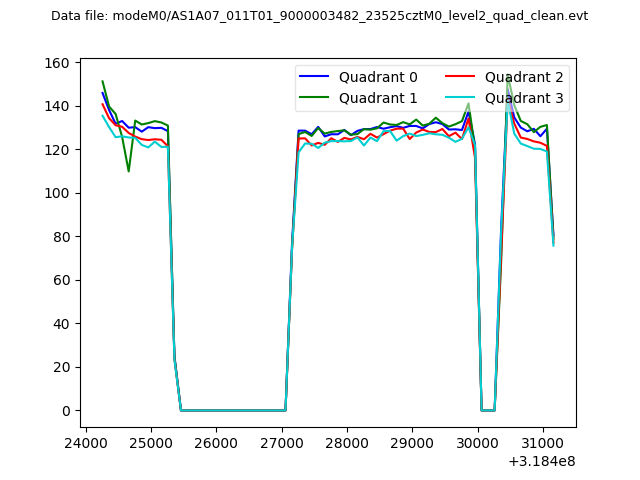 |
|
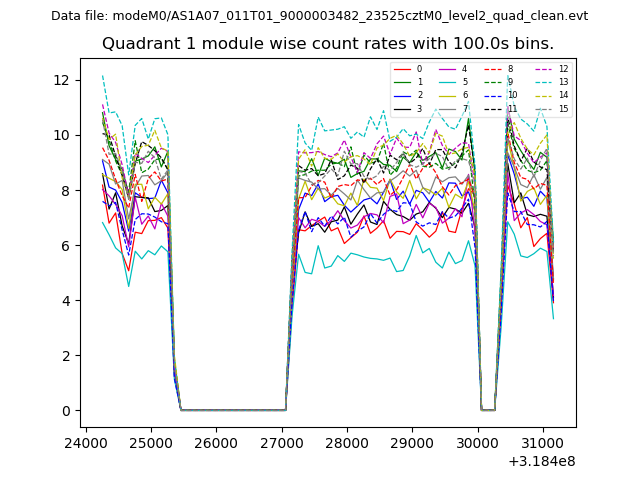
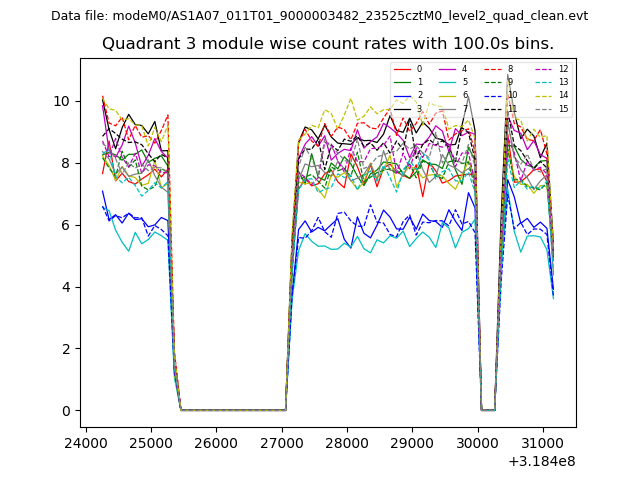
| Module-wise count rates for Quadrant A Data is divided into 100 sec bins |
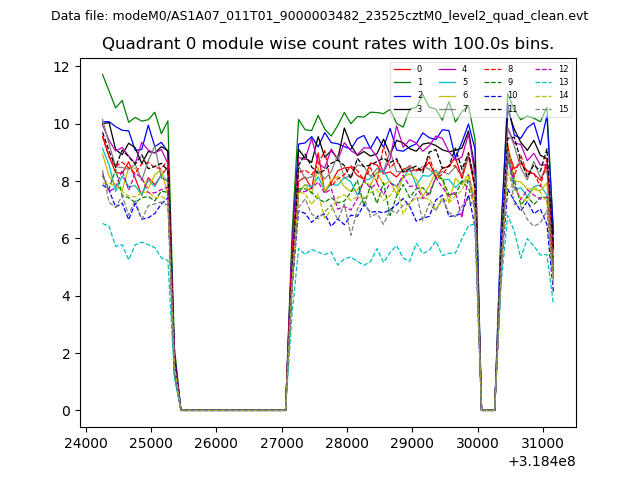 |
 |
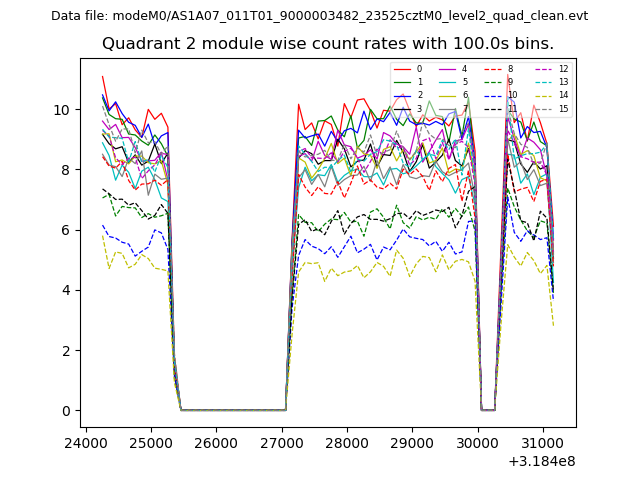
| Module-wise count rates for Quadrant B Data is divided into 100 sec bins |
 |
 |
| Module-wise count rates for Quadrant C Data is divided into 100 sec bins |
 |
 |
| Module-wise count rates for Quadrant D Data is divided into 100 sec bins |
 |
 |
| Parameter | Plot |
|---|---|
| CZT HV Monitor | 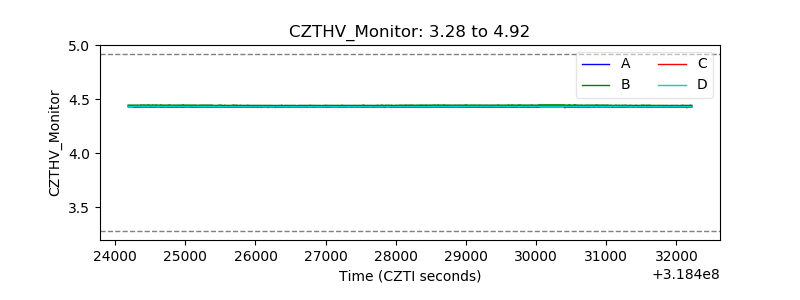 |
| D_VDD | 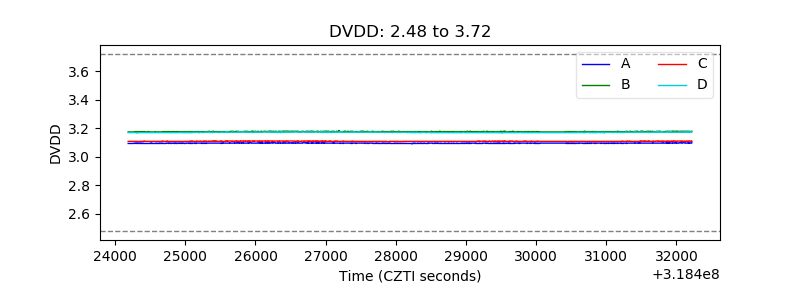 |
| Temperature 1 | 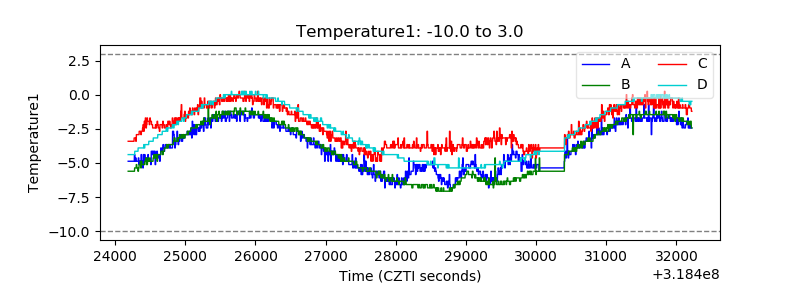 |
| Veto HV Monitor | 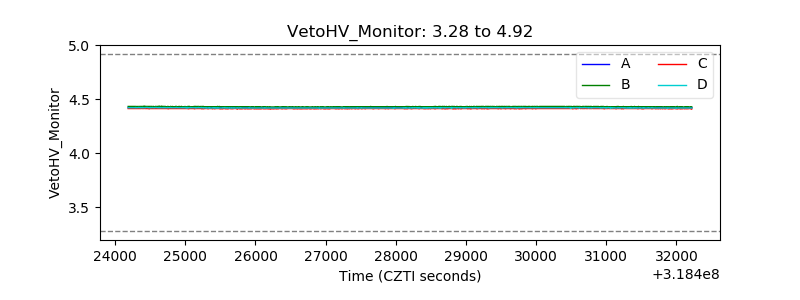 |
| Veto LLD | 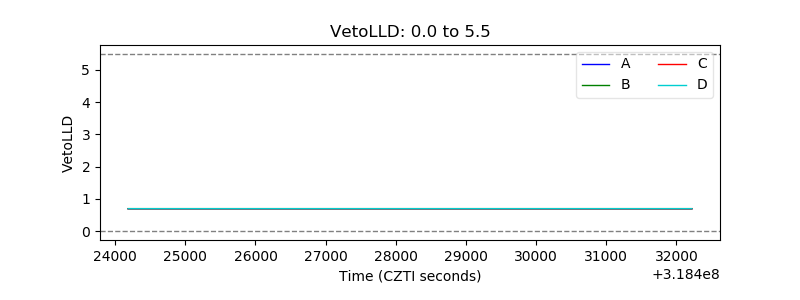 |
| Alpha Counter | 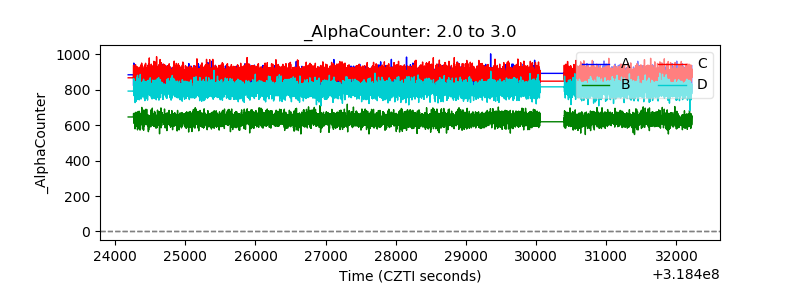 |
| _CPM_Rate |  |
| CZT Counter | 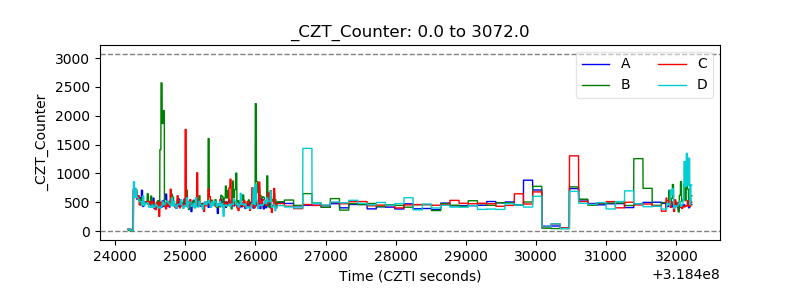 |
| +2.5 Volts monitor | 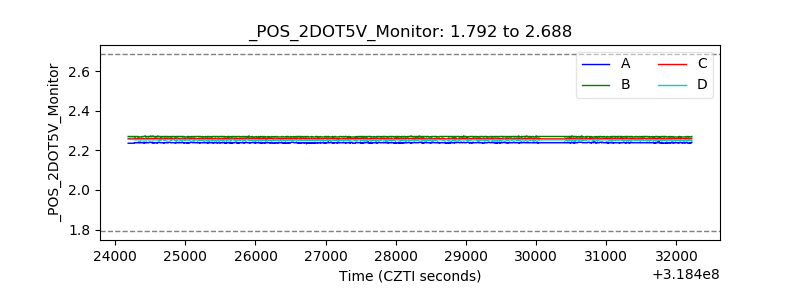 |
| +5 Volts monitor |  |
| _ROLL_ROT | 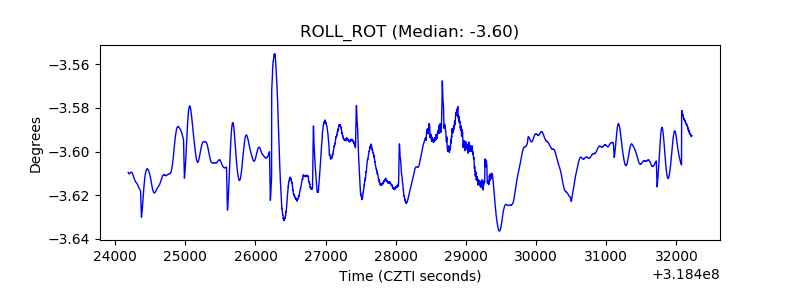 |
| _Roll_DEC | 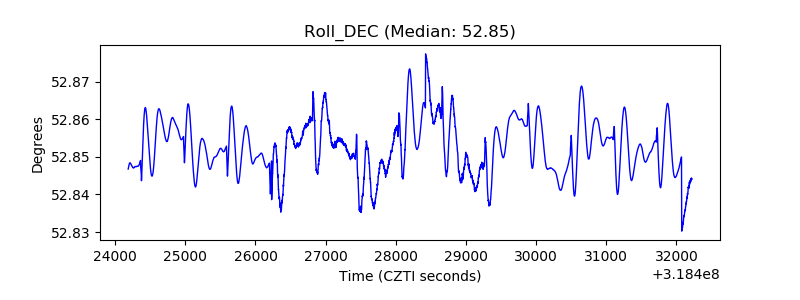 |
| _Roll_RA | 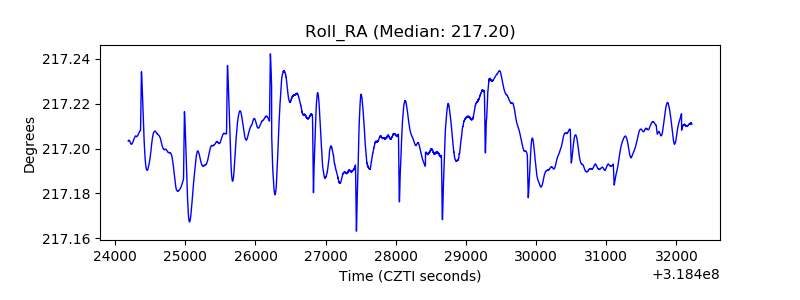 |
| Veto Counter | 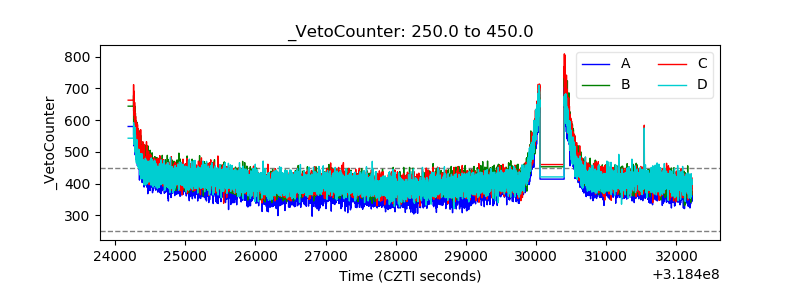 |