| Param | Original file | Final file |
|---|---|---|
| Filename | modeM0/AS1A07_011T01_9000003482_23526cztM0_level2.evt | modeM0/AS1A07_011T01_9000003482_23526cztM0_level2_quad_clean.evt |
| Size (bytes) | 557,795,520 | 92,779,200 |
| Size | 532.0 MB | 88.5 MB |
| Events in quadrant A | 3,604,100 | 581,439 |
| Events in quadrant B | 4,194,156 | 586,366 |
| Events in quadrant C | 3,639,595 | 563,673 |
| Events in quadrant D | 4,937,954 | 548,092 |
| Mode M9 | |||
|---|---|---|---|
| Quadrant | BADHDUFLAG | Total packets | Discarded packets |
| A | 0 | 2 | 0 |
| B | 0 | 2 | 0 |
| C | 0 | 2 | 0 |
| D | 0 | 2 | 0 |
| Mode SS | |||
|---|---|---|---|
| Quadrant | BADHDUFLAG | Total packets | Discarded packets |
| A | 0 | 156 | 0 |
| B | 0 | 156 | 0 |
| C | 0 | 156 | 0 |
| D | 0 | 156 | 0 |
| Mode M0 | |||
|---|---|---|---|
| Quadrant | BADHDUFLAG | Total packets | Discarded packets |
| A | 0 | 15666 | 3 |
| B | 0 | 17302 | 3 |
| C | 0 | 15702 | 3 |
| D | 0 | 19690 | 3 |
| Quadrant | Total seconds | Saturated seconds | Saturation percentage |
|---|---|---|---|
| A | 7611 | 99 | 1.300749% |
| B | 7611 | 158 | 2.075943% |
| C | 7612 | 136 | 1.786653% |
| D | 7612 | 496 | 6.516027% |
Noise dominated data is calculated using 1-second bins in cleaned event files. If a bin has >2000 counts, and if more than 50% of those come from <1% of pixels, then it is considered to be noise-dominated and hence unusable.
| Quadrant | # 1 sec bins | Bins with >0 counts | Bins with >2000 counts | High rate bins dominated by noise | Noise dominated (total time) | Noise dominated (detector-on time) | Marked lightcurve |
|---|---|---|---|---|---|---|---|
| A | 7861 | 7612 | 4 | 4 | 0.05% | 0.05% | 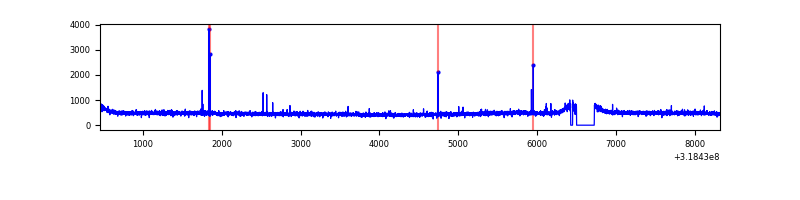 |
| B | 7861 | 7612 | 18 | 18 | 0.23% | 0.24% | 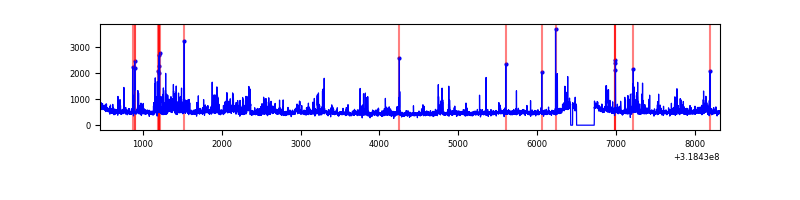 |
| C | 7862 | 7613 | 0 | 0 | 0.00% | 0.00% | 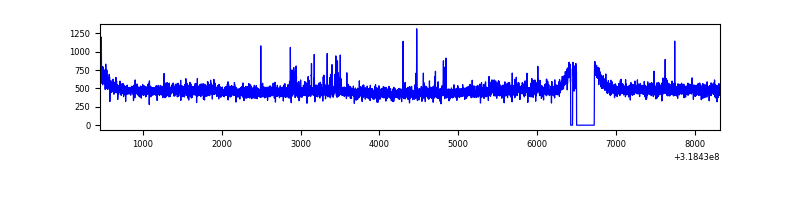 |
| D | 7862 | 7613 | 387 | 387 | 4.92% | 5.08% | 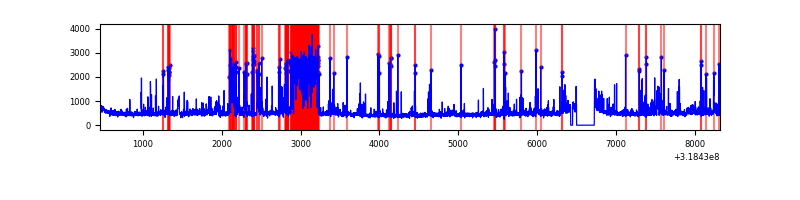 |
Top three noisy pixels from each quadrant. If the there are fewer than three noisy pixels in the level2.evt file, extra rows are filled as -1
| Pixel properties | Quadrant properties | ||||||
|---|---|---|---|---|---|---|---|
| Quadrant | DetID | PixID | Counts | Sigma | Mean | Median | Sigma |
| A | 10 | 253 | 16933 | 85.81 | 927 | 906 | 186.8 |
| A | 13 | 254 | 13885 | 69.49 | 927 | 906 | 186.8 |
| A | 3 | 137 | 8223 | 39.17 | 927 | 906 | 186.8 |
| B | 0 | 189 | 364048 | 2071.48 | 915 | 889 | 175.3 |
| B | 0 | 230 | 64504 | 362.86 | 915 | 889 | 175.3 |
| B | 15 | 33 | 45691 | 255.55 | 915 | 889 | 175.3 |
| C | 14 | 238 | 138930 | 675.42 | 879 | 883 | 204.4 |
| C | 7 | 247 | 32700 | 155.67 | 879 | 883 | 204.4 |
| C | 2 | 16 | 16222 | 75.05 | 879 | 883 | 204.4 |
| D | 1 | 52 | 775009 | 3600.57 | 881 | 855 | 215.0 |
| D | 12 | 233 | 662373 | 3076.7 | 881 | 855 | 215.0 |
| D | 7 | 238 | 83226 | 383.11 | 881 | 855 | 215.0 |
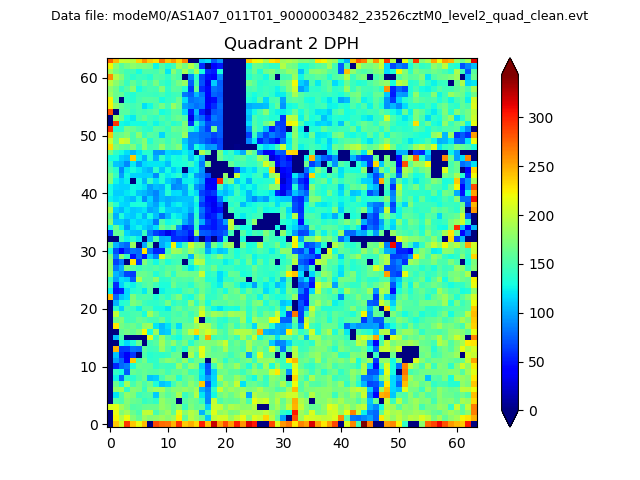
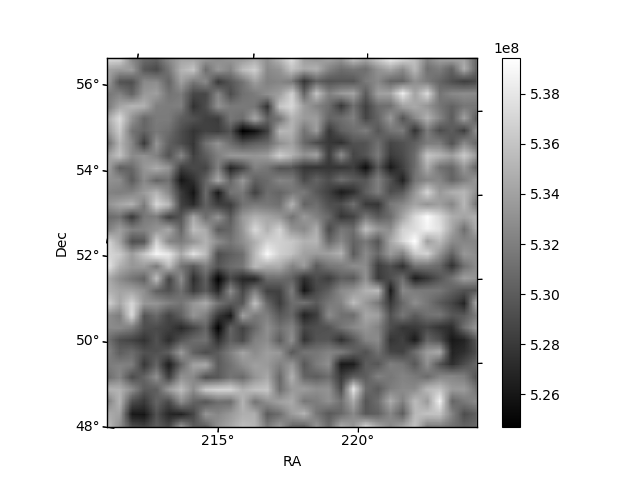
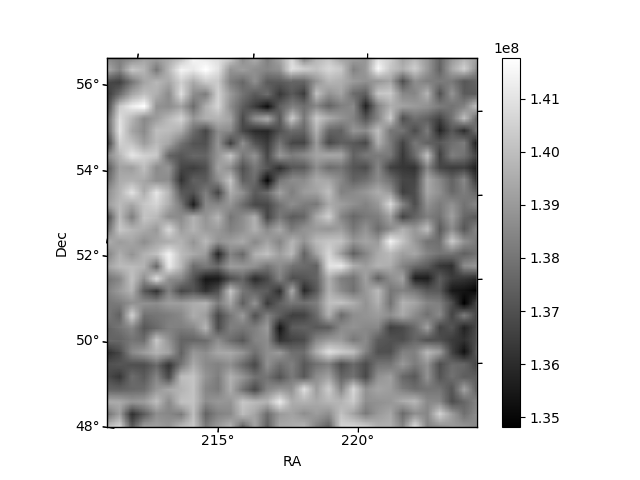
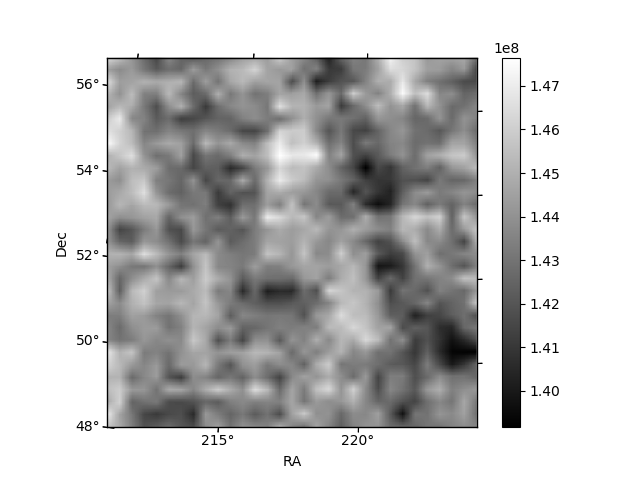
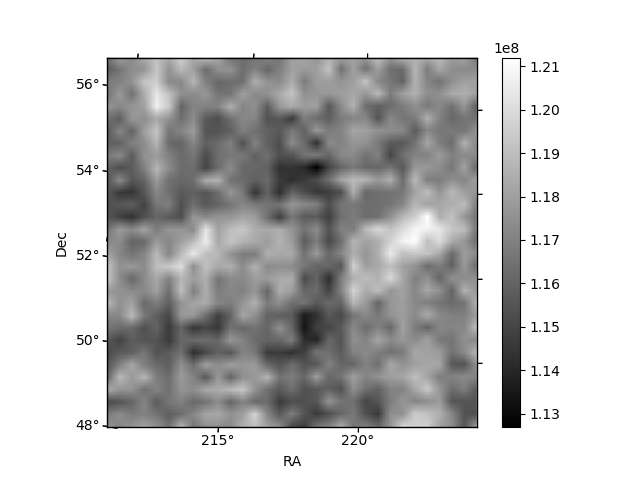
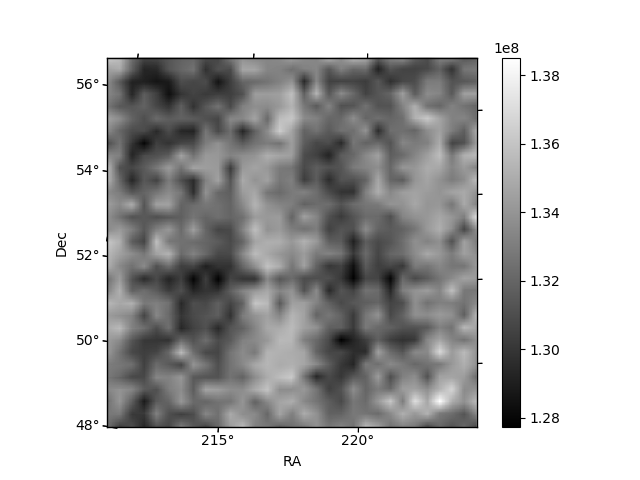
Histogram calculated using DETX and DETY for each event in the final _common_clean file
| Quadrant A | 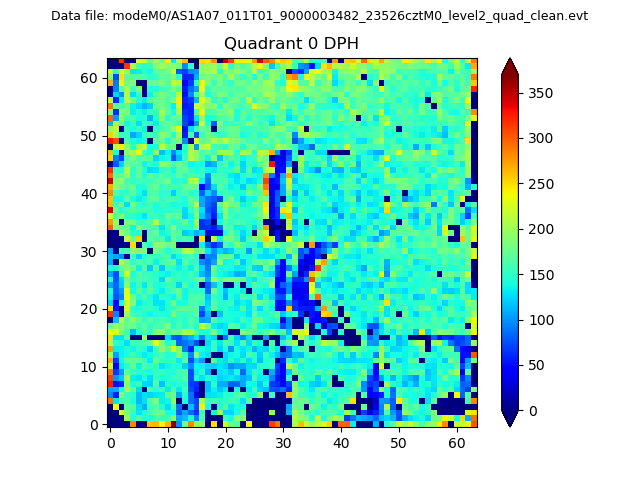 |
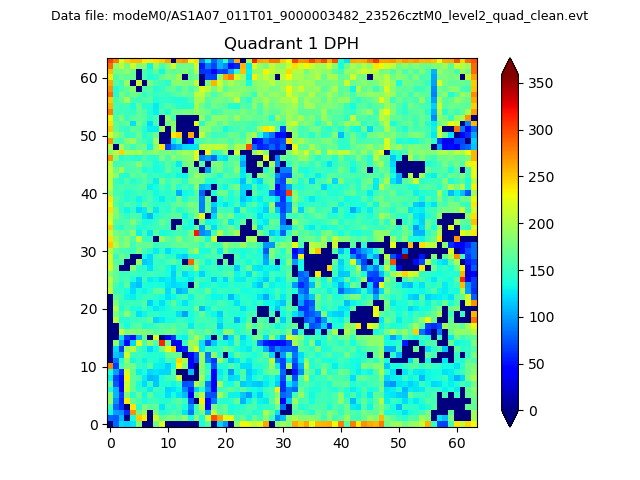 |
Quadrant B |
|---|---|---|---|
| Quadrant D | 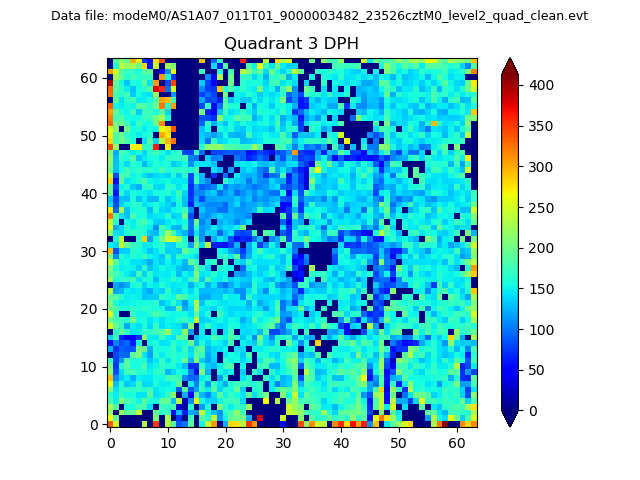 |
 |
Quadrant C |
| Plot type | Count rate plots | Images |
|---|---|---|
| Comparison with Poisson distribution Blue bars denote a histogram of data divided into 1 sec bins. Red curve is a Poisson curve with rate = median count rate of data. |
 |
 |
| Quadrant-wise count rates Data is divided into 100 sec bins |
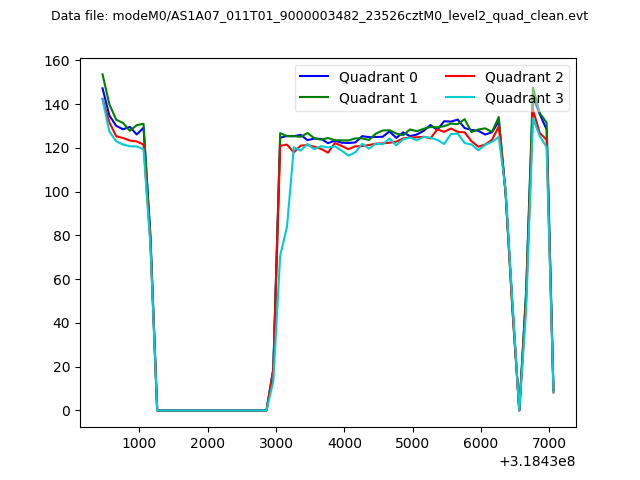 |
|
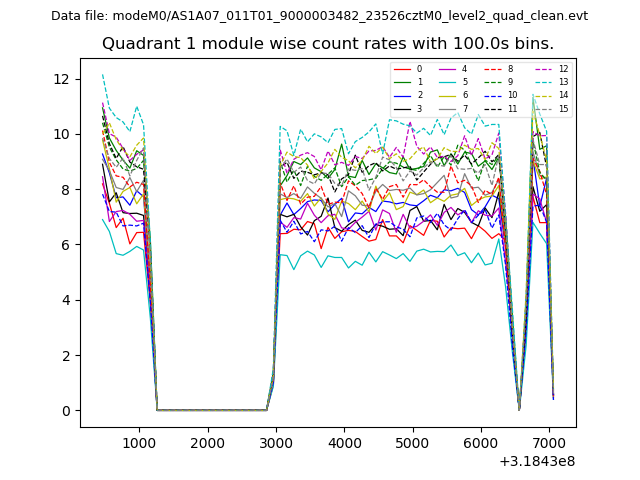
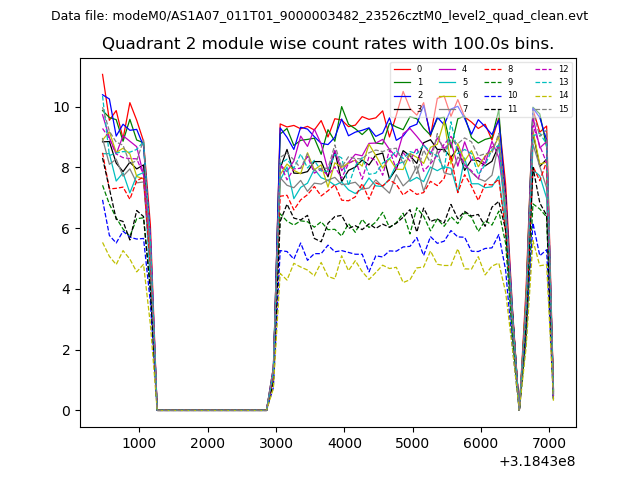
| Module-wise count rates for Quadrant A Data is divided into 100 sec bins |
 |
 |
| Module-wise count rates for Quadrant B Data is divided into 100 sec bins |
 |
 |
| Module-wise count rates for Quadrant C Data is divided into 100 sec bins |
 |
 |
| Module-wise count rates for Quadrant D Data is divided into 100 sec bins |
 |
 |
| Parameter | Plot |
|---|---|
| CZT HV Monitor | 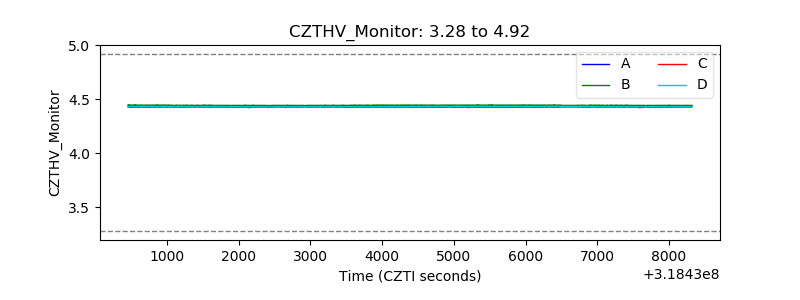 |
| D_VDD | 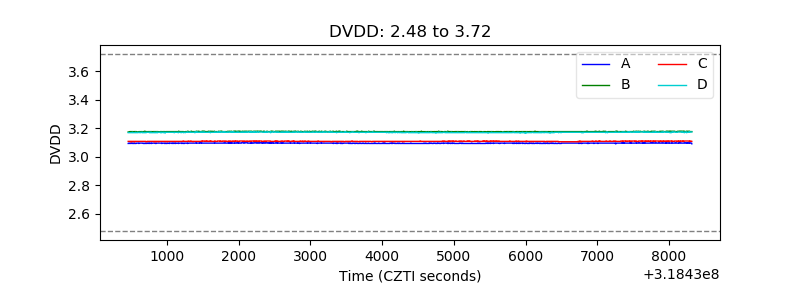 |
| Temperature 1 | 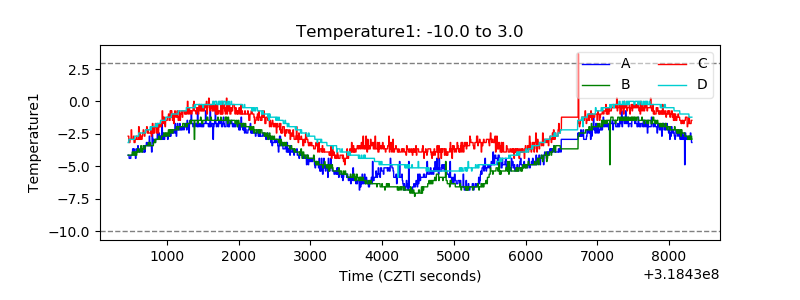 |
| Veto HV Monitor | 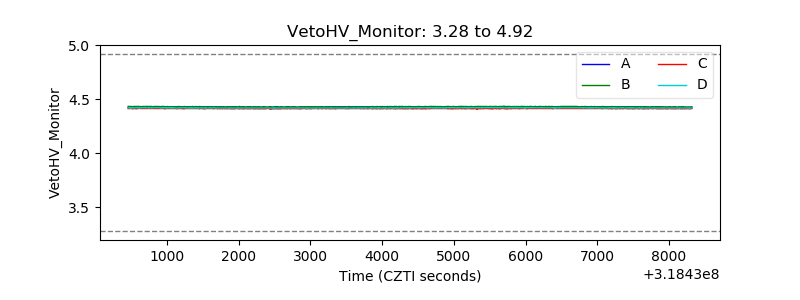 |
| Veto LLD | 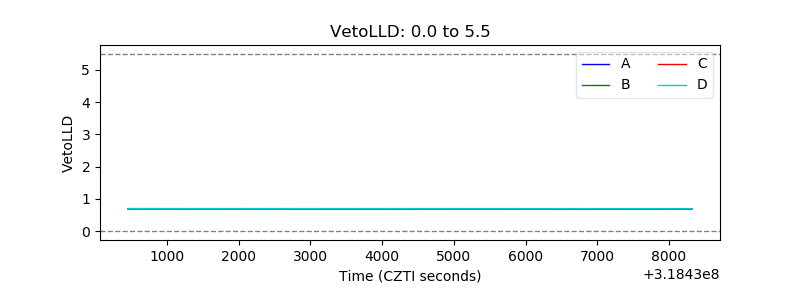 |
| Alpha Counter | 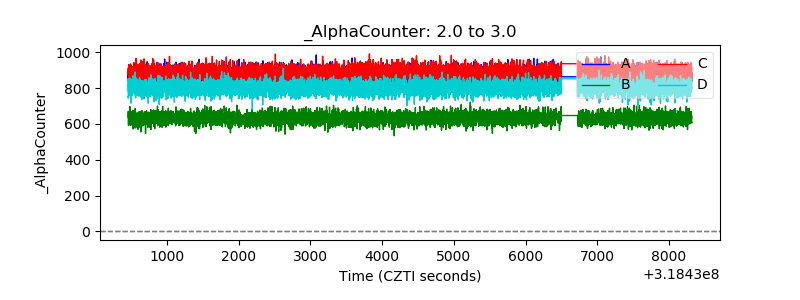 |
| _CPM_Rate | 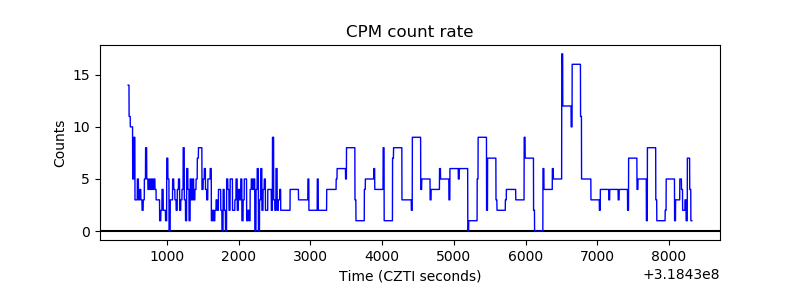 |
| CZT Counter | 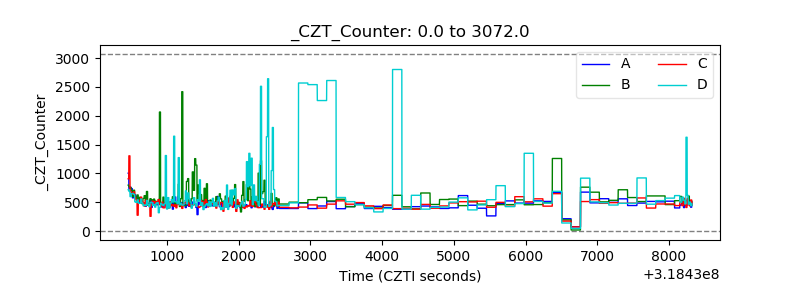 |
| +2.5 Volts monitor |  |
| +5 Volts monitor | 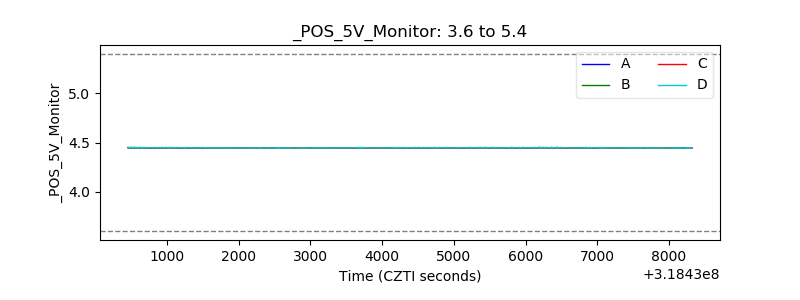 |
| _ROLL_ROT | 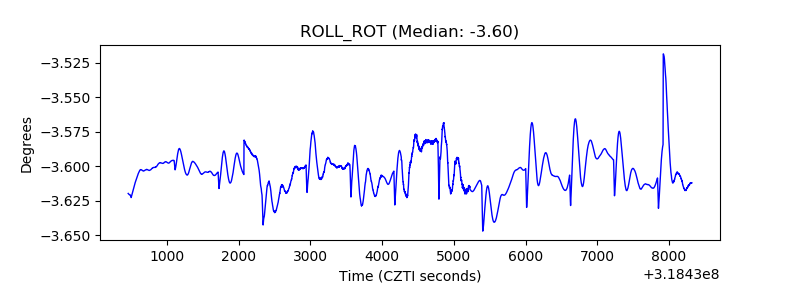 |
| _Roll_DEC | 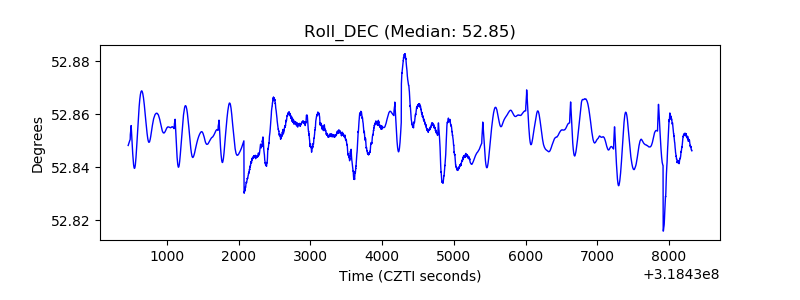 |
| _Roll_RA | 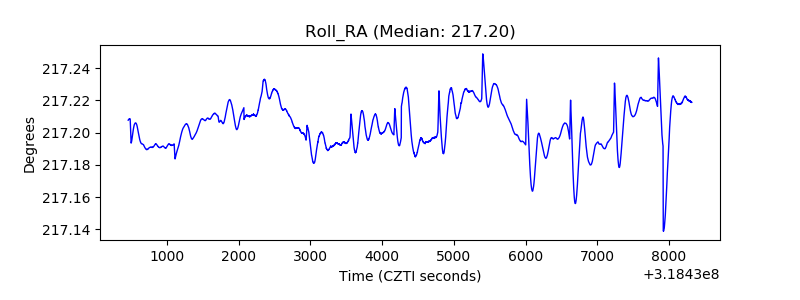 |
| Veto Counter | 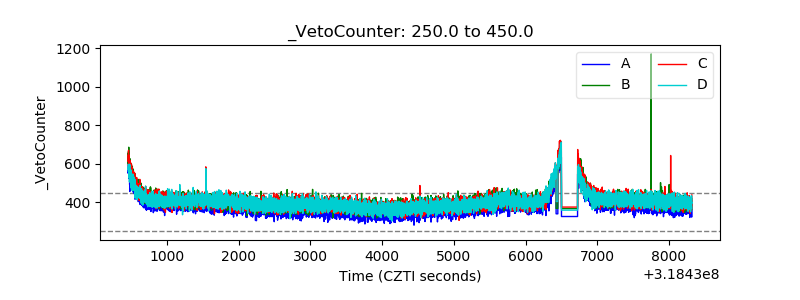 |