| Param | Original file | Final file |
|---|---|---|
| Filename | modeM0/AS1A07_011T01_9000003482_23527cztM0_level2.evt | modeM0/AS1A07_011T01_9000003482_23527cztM0_level2_quad_clean.evt |
| Size (bytes) | 531,904,320 | 84,807,360 |
| Size | 507.3 MB | 80.9 MB |
| Events in quadrant A | 3,550,588 | 517,790 |
| Events in quadrant B | 4,036,958 | 522,855 |
| Events in quadrant C | 3,725,416 | 503,193 |
| Events in quadrant D | 4,281,662 | 497,360 |
| Mode M9 | |||
|---|---|---|---|
| Quadrant | BADHDUFLAG | Total packets | Discarded packets |
| A | 0 | 4 | 0 |
| B | 0 | 4 | 0 |
| C | 0 | 4 | 0 |
| D | 0 | 4 | 0 |
| Mode SS | |||
|---|---|---|---|
| Quadrant | BADHDUFLAG | Total packets | Discarded packets |
| A | 0 | 154 | 0 |
| B | 0 | 154 | 0 |
| C | 0 | 152 | 0 |
| D | 0 | 152 | 0 |
| Mode M0 | |||
|---|---|---|---|
| Quadrant | BADHDUFLAG | Total packets | Discarded packets |
| A | 0 | 15498 | 2 |
| B | 0 | 16859 | 2 |
| C | 0 | 15837 | 2 |
| D | 0 | 17730 | 2 |
| Quadrant | Total seconds | Saturated seconds | Saturation percentage |
|---|---|---|---|
| A | 7575 | 61 | 0.805281% |
| B | 7575 | 106 | 1.399340% |
| C | 7574 | 113 | 1.491946% |
| D | 7574 | 111 | 1.465540% |
Noise dominated data is calculated using 1-second bins in cleaned event files. If a bin has >2000 counts, and if more than 50% of those come from <1% of pixels, then it is considered to be noise-dominated and hence unusable.
| Quadrant | # 1 sec bins | Bins with >0 counts | Bins with >2000 counts | High rate bins dominated by noise | Noise dominated (total time) | Noise dominated (detector-on time) | Marked lightcurve |
|---|---|---|---|---|---|---|---|
| A | 7950 | 7575 | 1 | 1 | 0.01% | 0.01% | 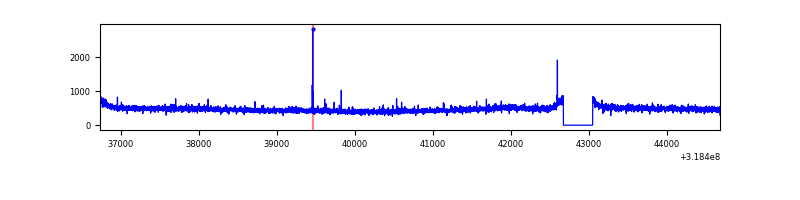 |
| B | 7950 | 7576 | 22 | 22 | 0.28% | 0.29% | 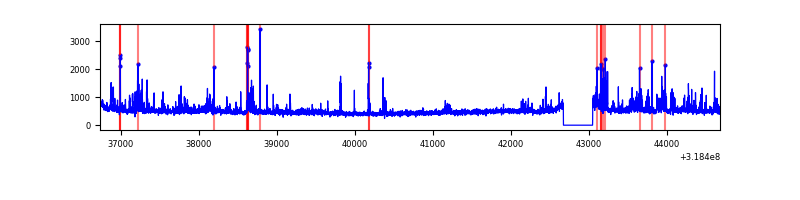 |
| C | 7949 | 7574 | 10 | 10 | 0.13% | 0.13% | 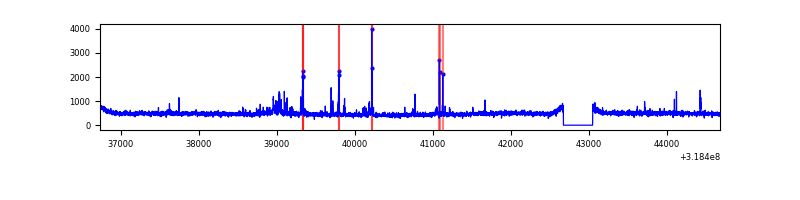 |
| D | 7949 | 7574 | 62 | 62 | 0.78% | 0.82% | 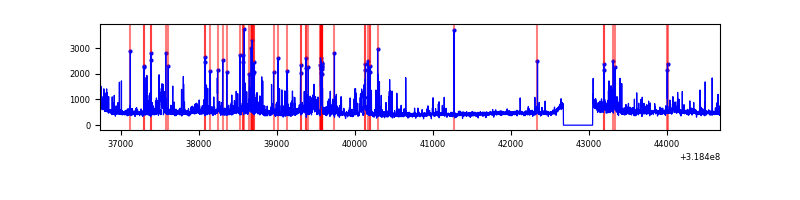 |
Top three noisy pixels from each quadrant. If the there are fewer than three noisy pixels in the level2.evt file, extra rows are filled as -1
| Pixel properties | Quadrant properties | ||||||
|---|---|---|---|---|---|---|---|
| Quadrant | DetID | PixID | Counts | Sigma | Mean | Median | Sigma |
| A | 13 | 254 | 13433 | 67.63 | 917 | 896 | 185.4 |
| A | 10 | 253 | 13223 | 66.5 | 917 | 896 | 185.4 |
| A | 0 | 226 | 8066 | 38.68 | 917 | 896 | 185.4 |
| B | 0 | 189 | 293990 | 1692.28 | 906 | 881 | 173.2 |
| B | 0 | 228 | 60160 | 342.25 | 906 | 881 | 173.2 |
| B | 15 | 32 | 40983 | 231.53 | 906 | 881 | 173.2 |
| C | 14 | 238 | 139207 | 676.99 | 873 | 875 | 204.3 |
| C | 0 | 207 | 60355 | 291.09 | 873 | 875 | 204.3 |
| C | 10 | 9 | 56677 | 273.09 | 873 | 875 | 204.3 |
| D | 1 | 52 | 601854 | 2764.77 | 891 | 864 | 217.4 |
| D | 9 | 85 | 90345 | 411.64 | 891 | 864 | 217.4 |
| D | 12 | 233 | 59417 | 269.36 | 891 | 864 | 217.4 |
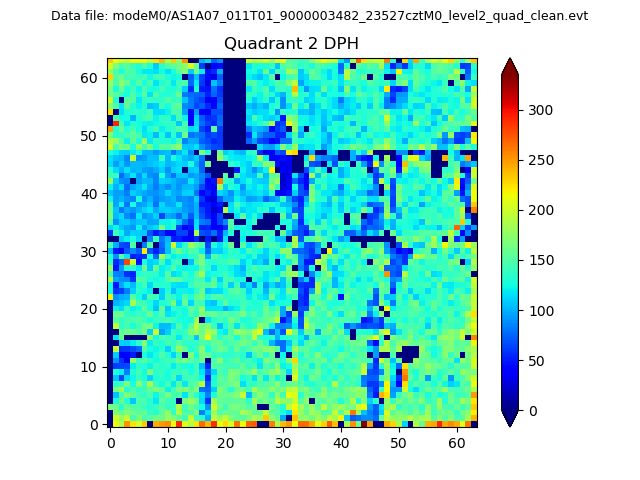
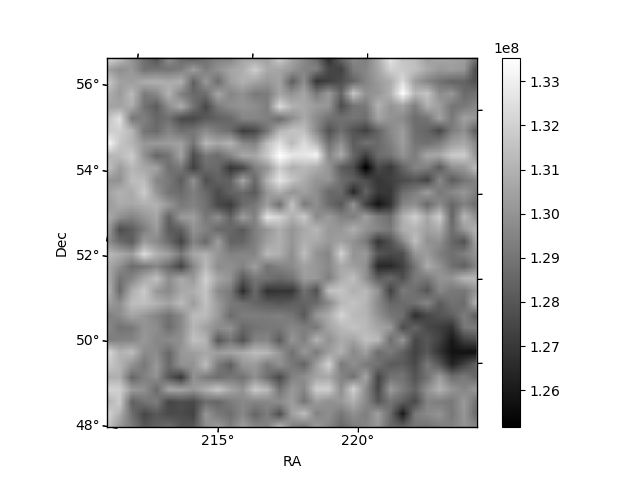
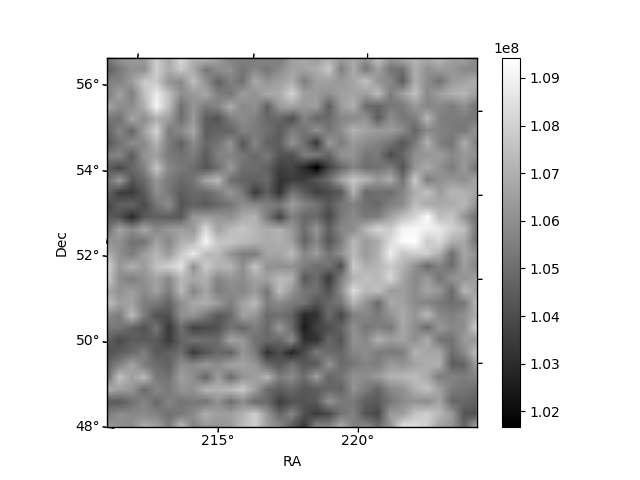
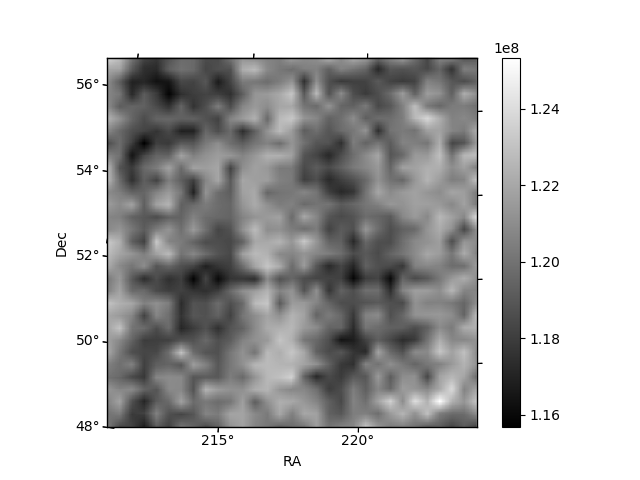
Histogram calculated using DETX and DETY for each event in the final _common_clean file
| Quadrant A | 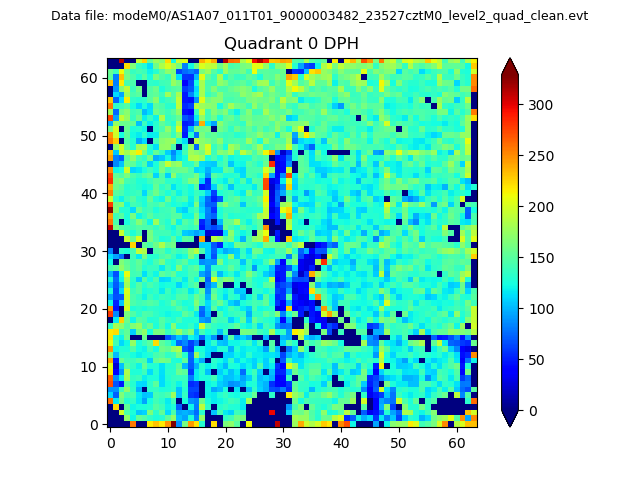 |
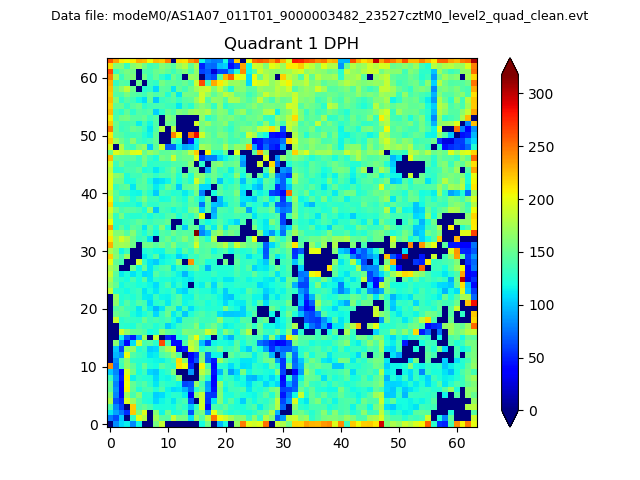 |
Quadrant B |
|---|---|---|---|
| Quadrant D | 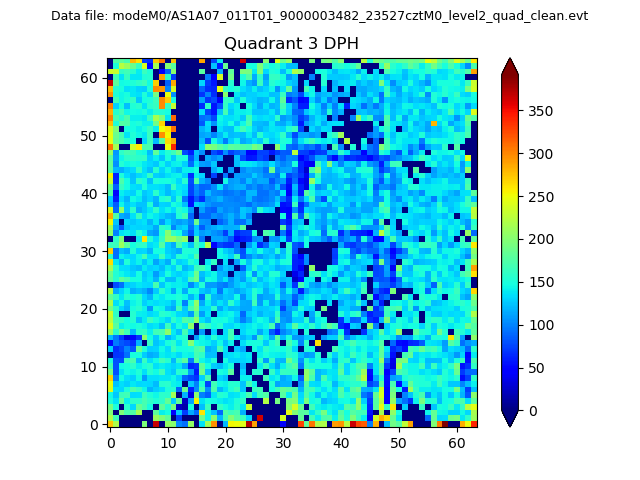 |
 |
Quadrant C |
| Plot type | Count rate plots | Images |
|---|---|---|
| Comparison with Poisson distribution Blue bars denote a histogram of data divided into 1 sec bins. Red curve is a Poisson curve with rate = median count rate of data. |
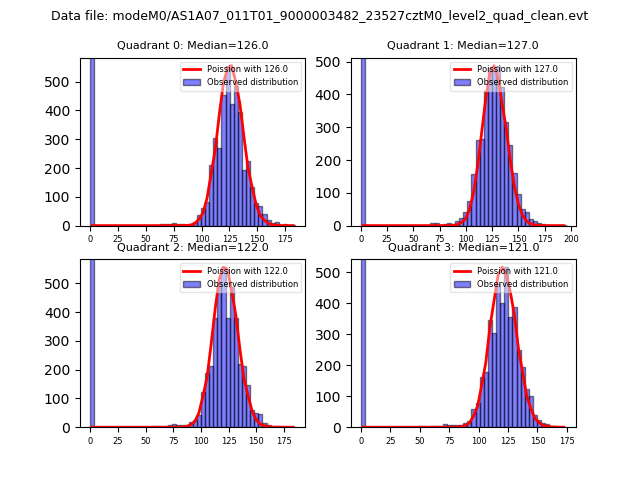 |
 |
| Quadrant-wise count rates Data is divided into 100 sec bins |
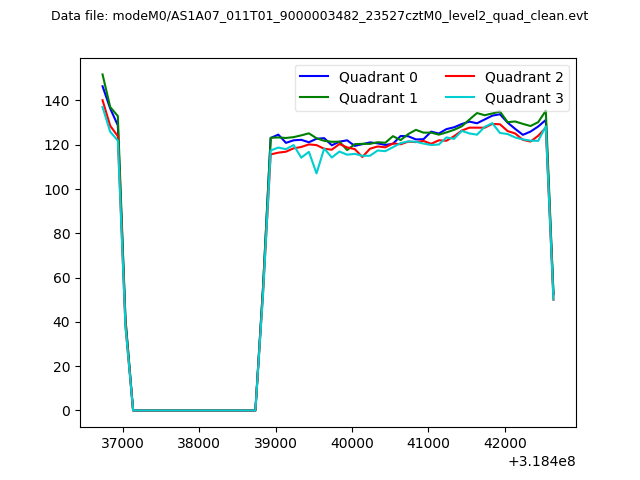 |
|
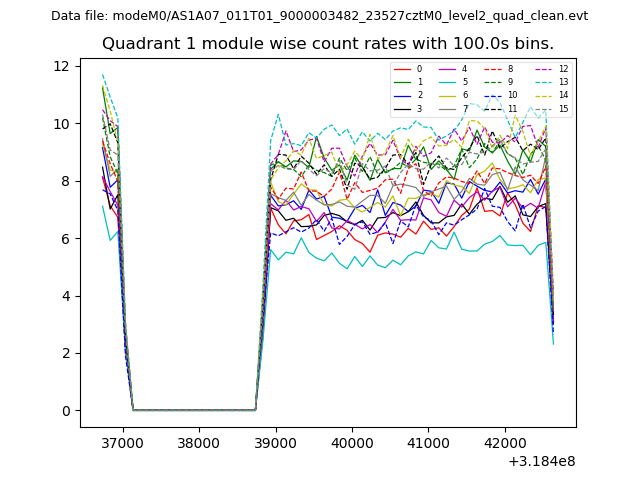
| Module-wise count rates for Quadrant A Data is divided into 100 sec bins |
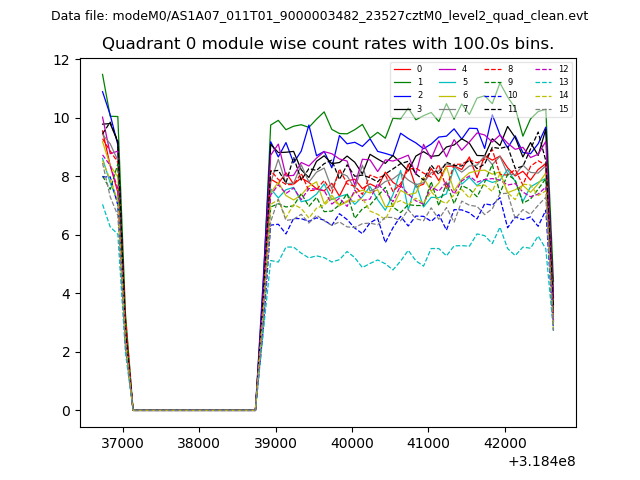 |
 |
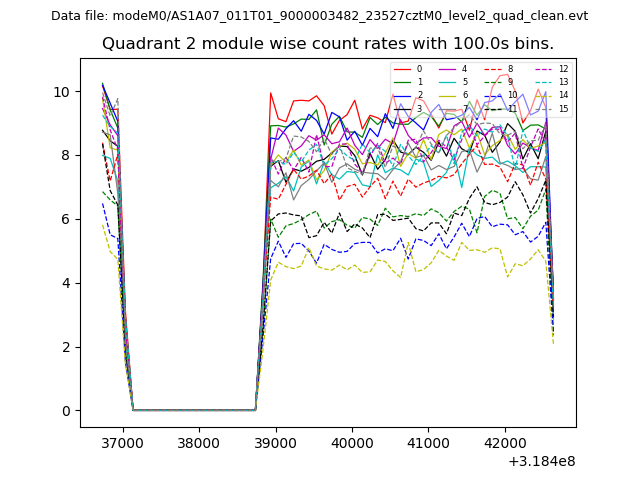
| Module-wise count rates for Quadrant B Data is divided into 100 sec bins |
 |
 |
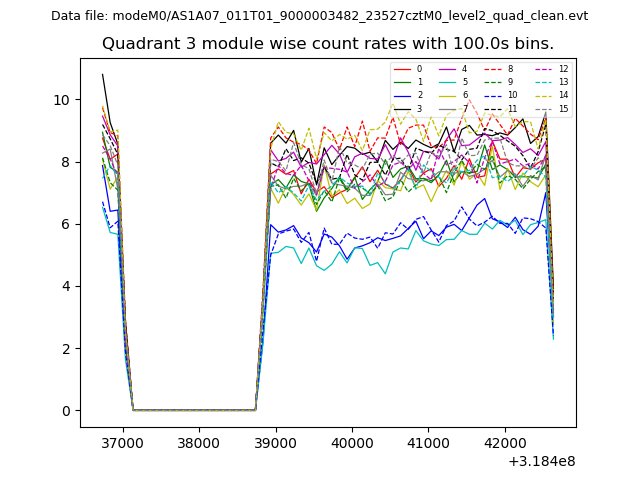
| Module-wise count rates for Quadrant C Data is divided into 100 sec bins |
 |
 |
| Module-wise count rates for Quadrant D Data is divided into 100 sec bins |
 |
 |
| Parameter | Plot |
|---|---|
| CZT HV Monitor | 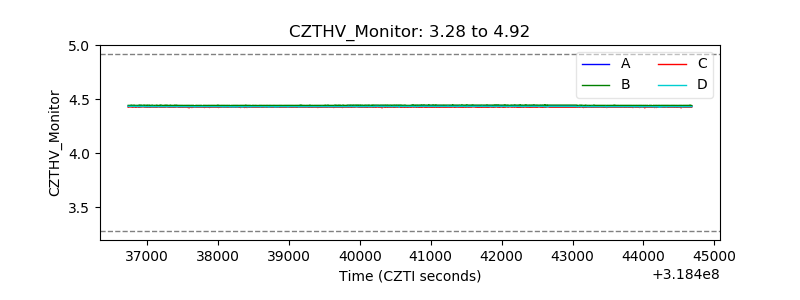 |
| D_VDD | 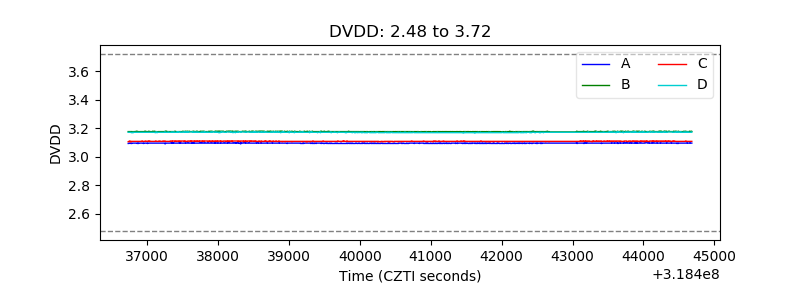 |
| Temperature 1 | 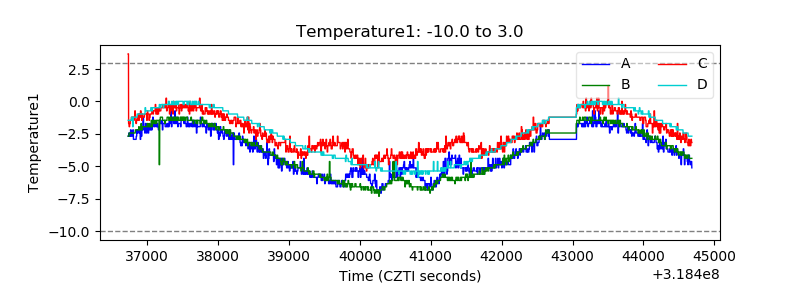 |
| Veto HV Monitor | 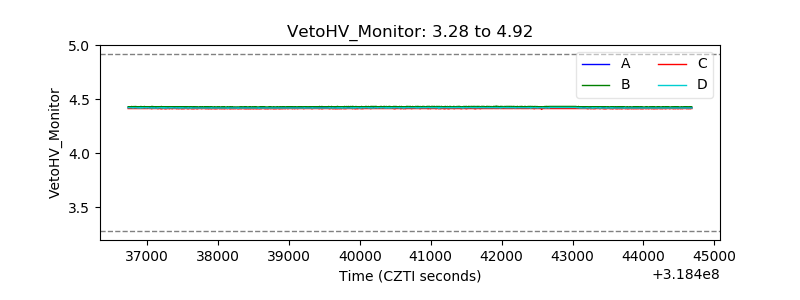 |
| Veto LLD | 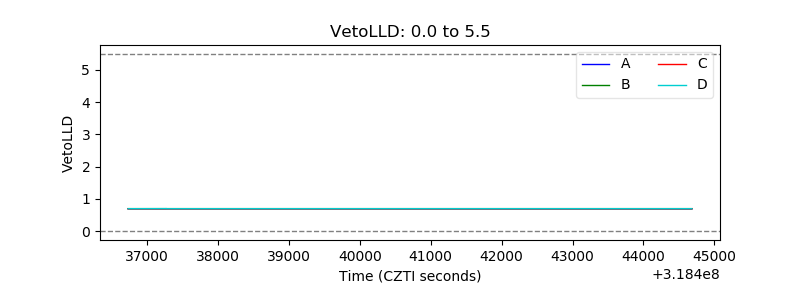 |
| Alpha Counter | 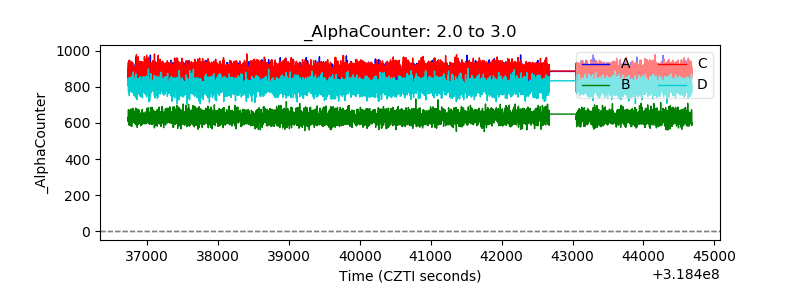 |
| _CPM_Rate | 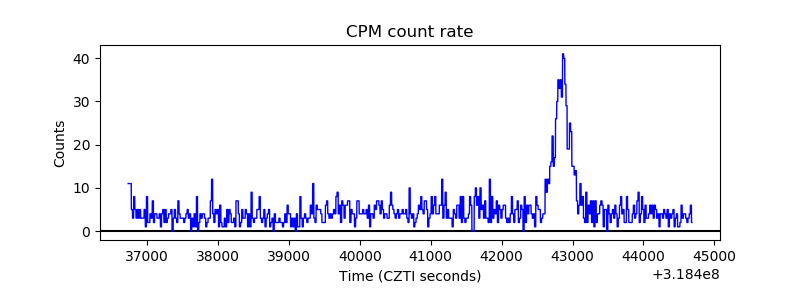 |
| CZT Counter |  |
| +2.5 Volts monitor |  |
| +5 Volts monitor | 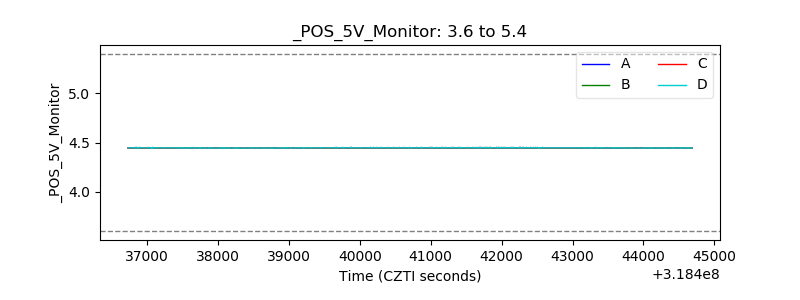 |
| _ROLL_ROT | 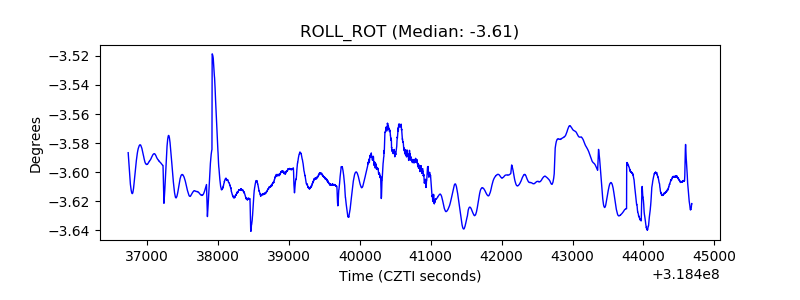 |
| _Roll_DEC | 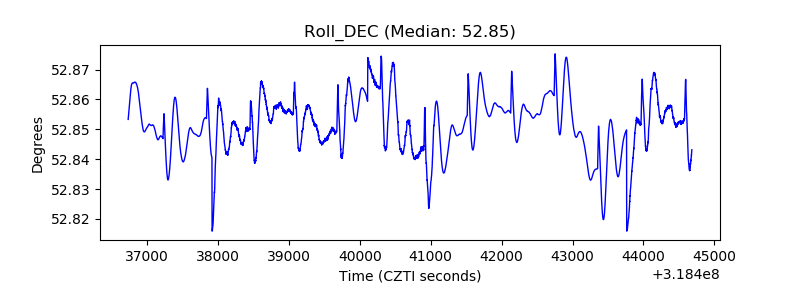 |
| _Roll_RA | 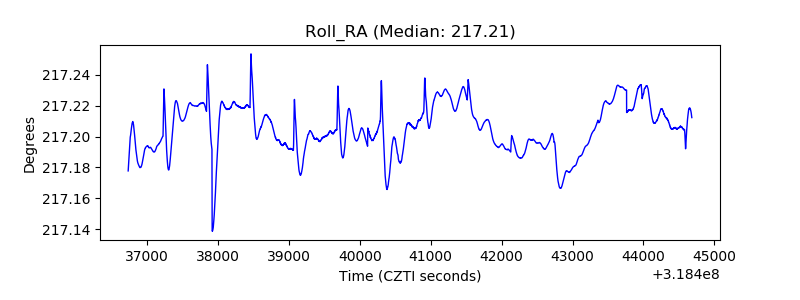 |
| Veto Counter | 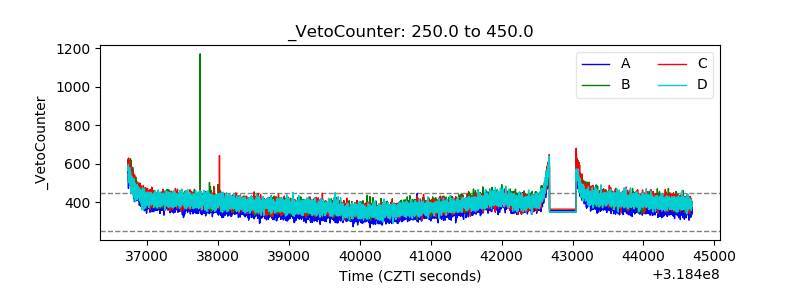 |