| Param | Original file | Final file |
|---|---|---|
| Filename | modeM0/AS1A07_011T01_9000003482_23529cztM0_level2.evt | modeM0/AS1A07_011T01_9000003482_23529cztM0_level2_quad_clean.evt |
| Size (bytes) | 867,499,200 | 162,308,160 |
| Size | 827.3 MB | 154.8 MB |
| Events in quadrant A | 5,743,702 | 1,028,336 |
| Events in quadrant B | 6,593,859 | 1,036,059 |
| Events in quadrant C | 5,919,527 | 1,002,397 |
| Events in quadrant D | 7,174,533 | 990,925 |
| Mode M9 | |||
|---|---|---|---|
| Quadrant | BADHDUFLAG | Total packets | Discarded packets |
| A | 0 | 12 | 0 |
| B | 0 | 12 | 0 |
| C | 0 | 12 | 0 |
| D | 0 | 12 | 0 |
| Mode SS | |||
|---|---|---|---|
| Quadrant | BADHDUFLAG | Total packets | Discarded packets |
| A | 0 | 257 | 5 |
| B | 0 | 256 | 6 |
| C | 0 | 255 | 5 |
| D | 0 | 257 | 7 |
| Mode M0 | |||
|---|---|---|---|
| Quadrant | BADHDUFLAG | Total packets | Discarded packets |
| A | 0 | 25920 | 543 |
| B | 0 | 28402 | 582 |
| C | 0 | 26290 | 538 |
| D | 0 | 31485 | 1340 |
| Quadrant | Total seconds | Saturated seconds | Saturation percentage |
|---|---|---|---|
| A | 12423 | 100 | 0.804959% |
| B | 12425 | 230 | 1.851107% |
| C | 12430 | 171 | 1.375704% |
| D | 12401 | 495 | 3.991614% |
Noise dominated data is calculated using 1-second bins in cleaned event files. If a bin has >2000 counts, and if more than 50% of those come from <1% of pixels, then it is considered to be noise-dominated and hence unusable.
| Quadrant | # 1 sec bins | Bins with >0 counts | Bins with >2000 counts | High rate bins dominated by noise | Noise dominated (total time) | Noise dominated (detector-on time) | Marked lightcurve |
|---|---|---|---|---|---|---|---|
| A | 14197 | 12454 | 3 | 3 | 0.02% | 0.02% | 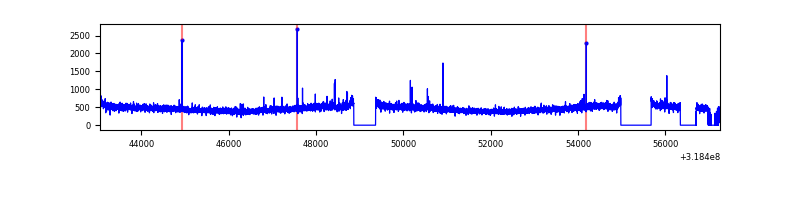 |
| B | 14198 | 12449 | 65 | 65 | 0.46% | 0.52% | 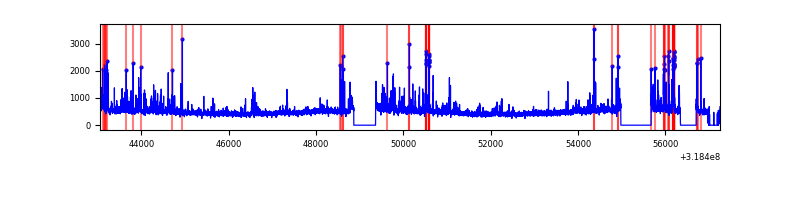 |
| C | 14197 | 12456 | 0 | 0 | 0.00% | 0.00% | 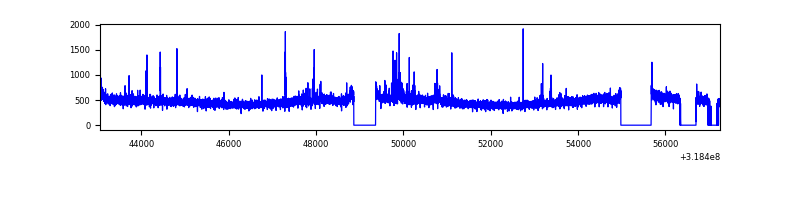 |
| D | 14197 | 12422 | 255 | 255 | 1.80% | 2.05% | 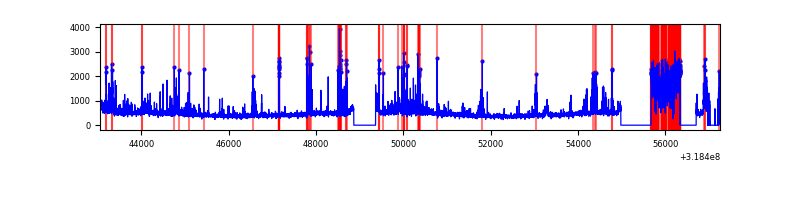 |
Top three noisy pixels from each quadrant. If the there are fewer than three noisy pixels in the level2.evt file, extra rows are filled as -1
| Pixel properties | Quadrant properties | ||||||
|---|---|---|---|---|---|---|---|
| Quadrant | DetID | PixID | Counts | Sigma | Mean | Median | Sigma |
| A | 10 | 253 | 27535 | 87.37 | 1481 | 1447 | 298.6 |
| A | 13 | 254 | 21853 | 68.34 | 1481 | 1447 | 298.6 |
| A | 3 | 137 | 13091 | 39.0 | 1481 | 1447 | 298.6 |
| B | 0 | 189 | 418218 | 1494.92 | 1467 | 1429 | 278.8 |
| B | 3 | 64 | 238648 | 850.85 | 1467 | 1429 | 278.8 |
| B | 15 | 32 | 63347 | 222.08 | 1467 | 1429 | 278.8 |
| C | 14 | 238 | 224844 | 674.37 | 1418 | 1423 | 331.3 |
| C | 7 | 247 | 119298 | 355.79 | 1418 | 1423 | 331.3 |
| C | 0 | 207 | 20313 | 57.02 | 1418 | 1423 | 331.3 |
| D | 9 | 85 | 1004746 | 2891.34 | 1428 | 1384 | 347.0 |
| D | 1 | 52 | 482392 | 1386.1 | 1428 | 1384 | 347.0 |
| D | 12 | 233 | 121609 | 346.45 | 1428 | 1384 | 347.0 |
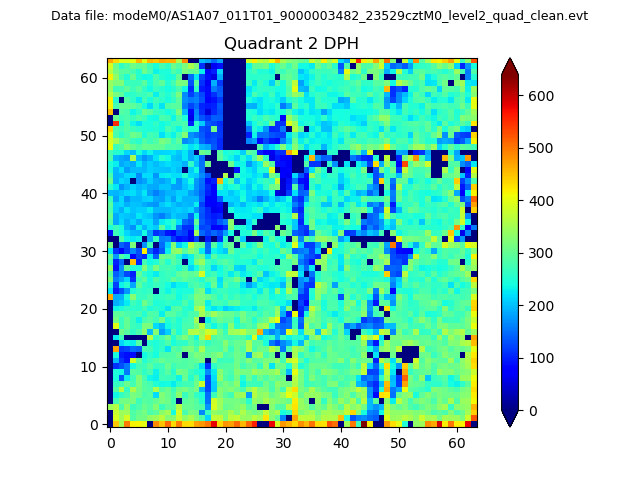
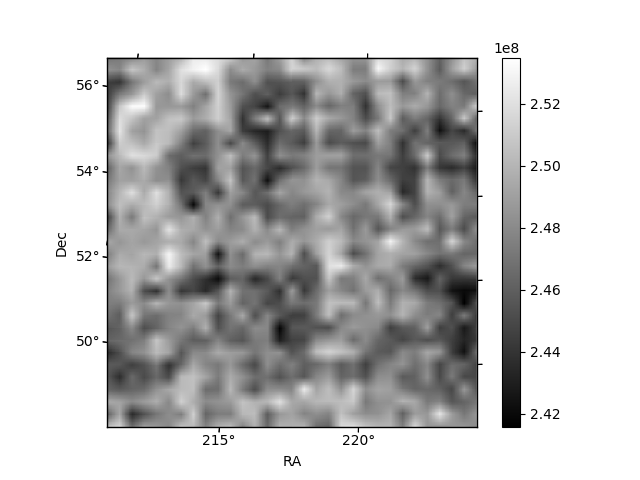
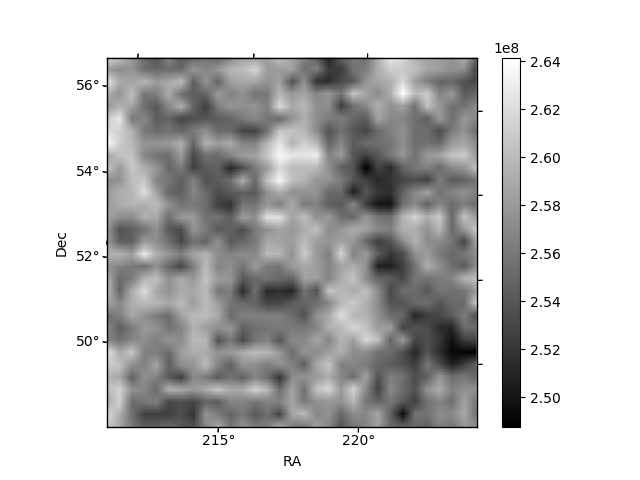
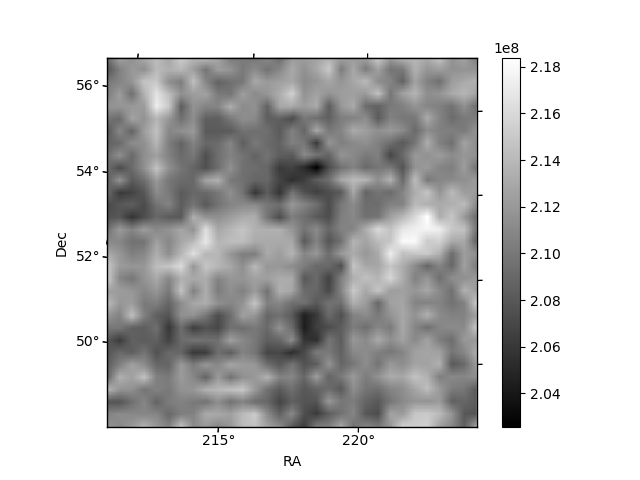
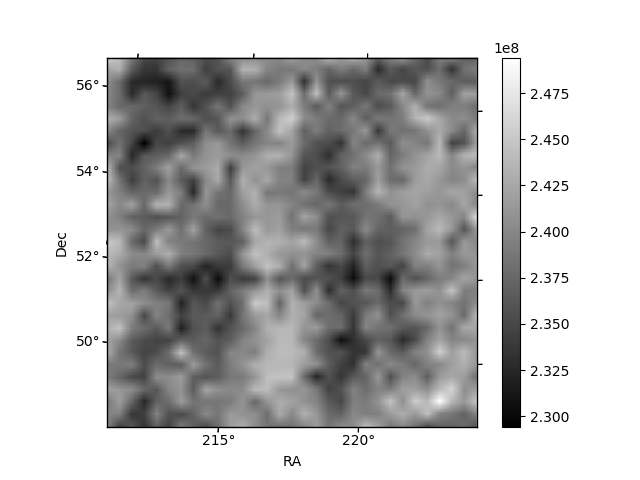
Histogram calculated using DETX and DETY for each event in the final _common_clean file
| Quadrant A | 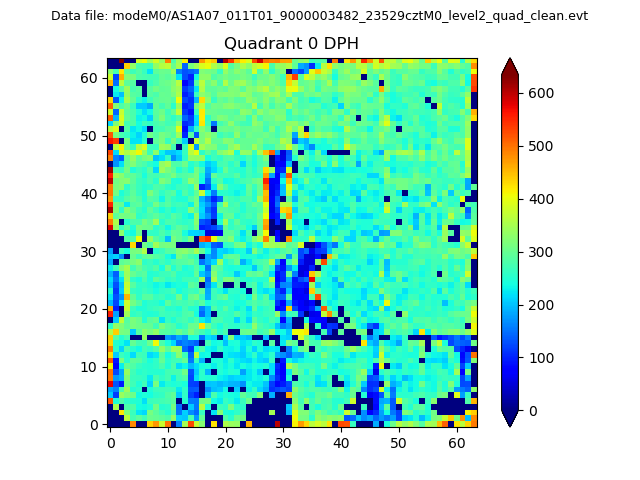 |
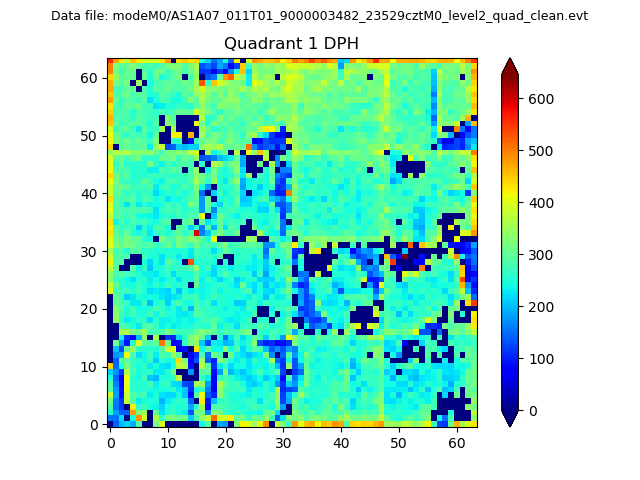 |
Quadrant B |
|---|---|---|---|
| Quadrant D | 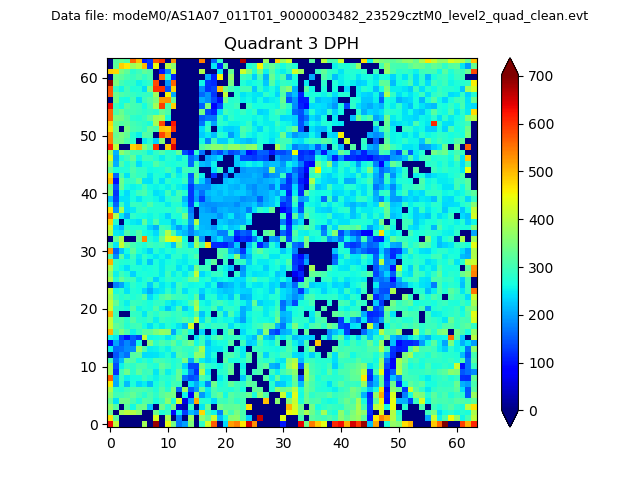 |
 |
Quadrant C |
| Plot type | Count rate plots | Images |
|---|---|---|
| Comparison with Poisson distribution Blue bars denote a histogram of data divided into 1 sec bins. Red curve is a Poisson curve with rate = median count rate of data. |
 |
 |
| Quadrant-wise count rates Data is divided into 100 sec bins |
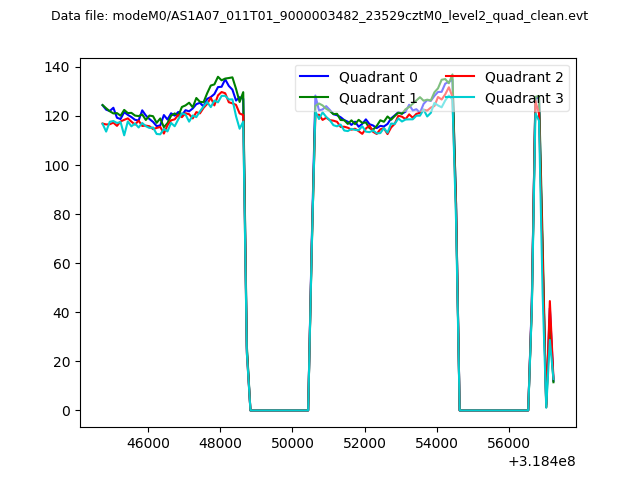 |
|
| Module-wise count rates for Quadrant A Data is divided into 100 sec bins |
 |
 |
| Module-wise count rates for Quadrant B Data is divided into 100 sec bins |
 |
 |
| Module-wise count rates for Quadrant C Data is divided into 100 sec bins |
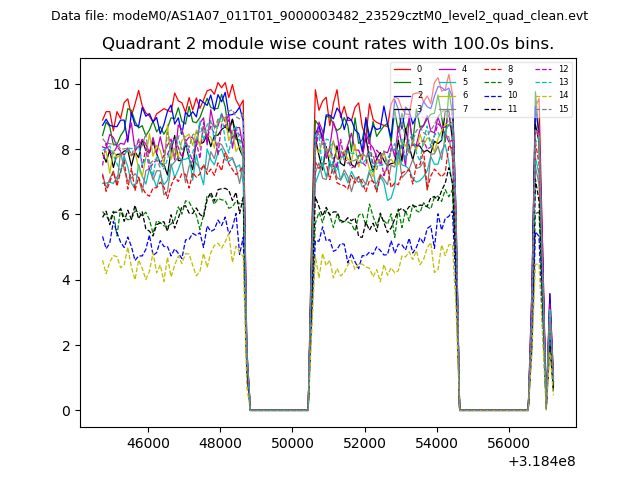 |
 |
| Module-wise count rates for Quadrant D Data is divided into 100 sec bins |
 |
 |
| Parameter | Plot |
|---|---|
| CZT HV Monitor | 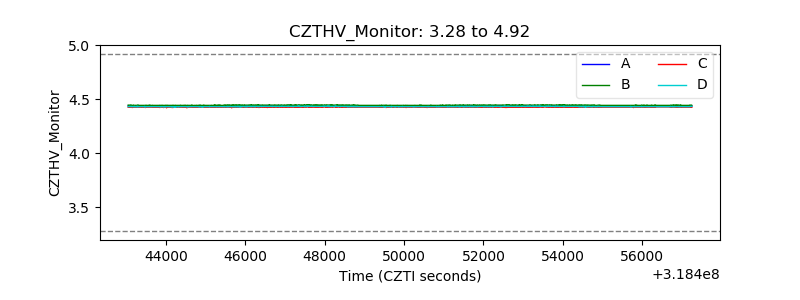 |
| D_VDD | 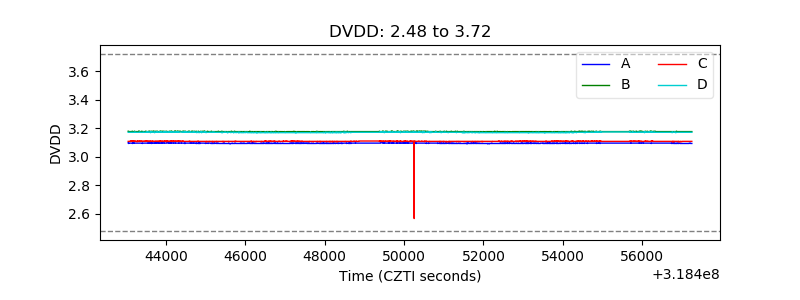 |
| Temperature 1 | 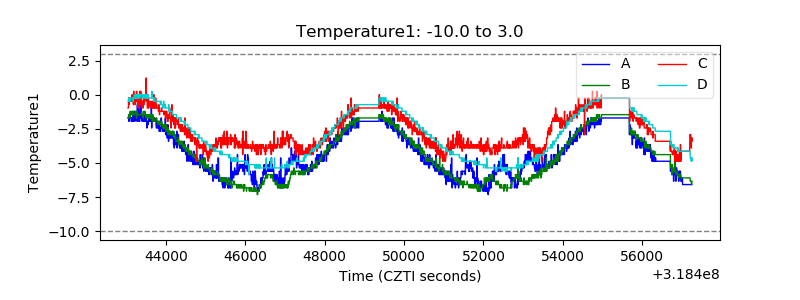 |
| Veto HV Monitor |  |
| Veto LLD | 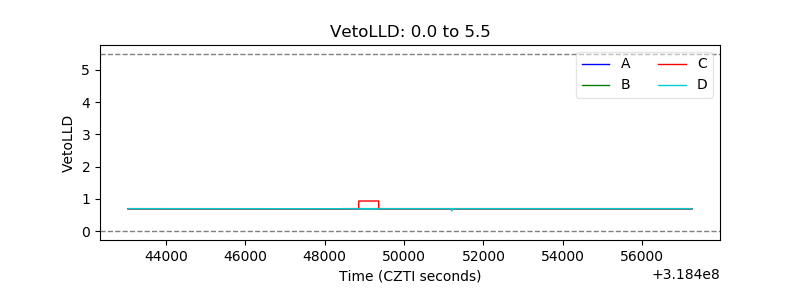 |
| Alpha Counter | 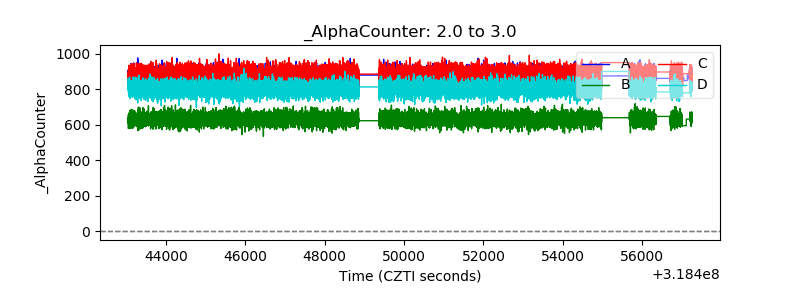 |
| _CPM_Rate | 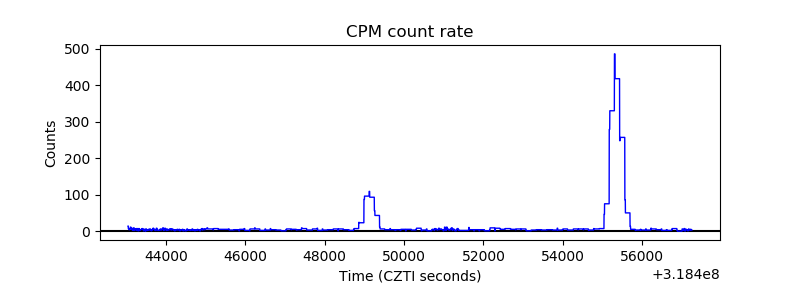 |
| CZT Counter |  |
| +2.5 Volts monitor | 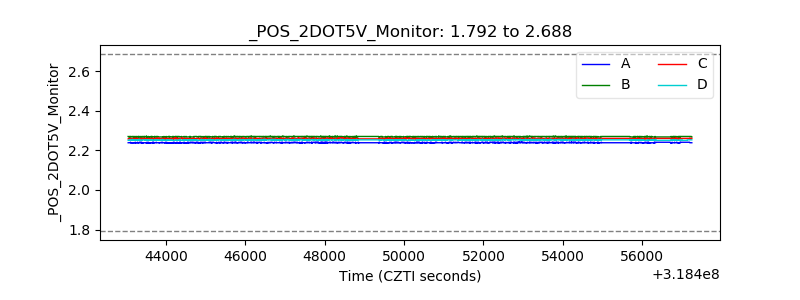 |
| +5 Volts monitor |  |
| _ROLL_ROT | 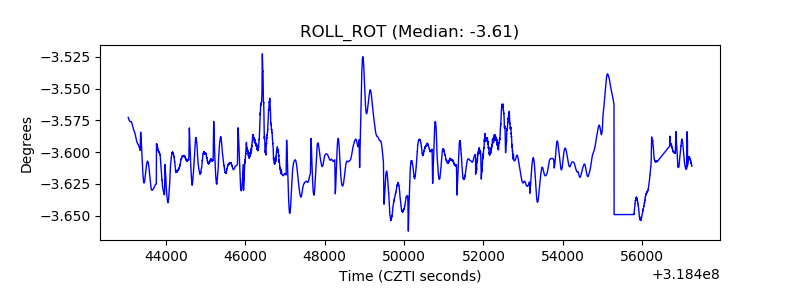 |
| _Roll_DEC | 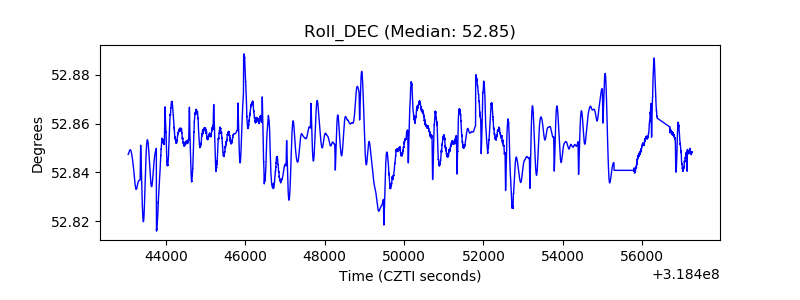 |
| _Roll_RA |  |
| Veto Counter | 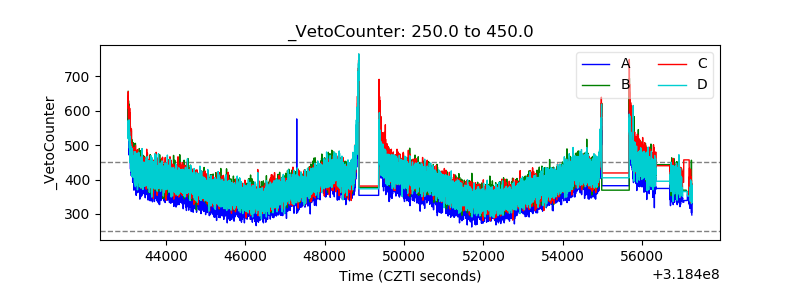 |