| Param | Original file | Final file |
|---|---|---|
| Filename | modeM0/AS1A07_011T01_9000003482_23530cztM0_level2.evt | modeM0/AS1A07_011T01_9000003482_23530cztM0_level2_quad_clean.evt |
| Size (bytes) | 704,050,560 | 153,383,040 |
| Size | 671.4 MB | 146.3 MB |
| Events in quadrant A | 4,484,567 | 999,599 |
| Events in quadrant B | 5,139,136 | 1,007,153 |
| Events in quadrant C | 4,684,578 | 977,718 |
| Events in quadrant D | 6,331,168 | 963,261 |
| Mode M9 | |||
|---|---|---|---|
| Quadrant | BADHDUFLAG | Total packets | Discarded packets |
| A | 0 | 9 | 0 |
| B | 0 | 9 | 0 |
| C | 0 | 9 | 0 |
| D | 0 | 9 | 0 |
| Mode SS | |||
|---|---|---|---|
| Quadrant | BADHDUFLAG | Total packets | Discarded packets |
| A | 0 | 202 | 0 |
| B | 0 | 202 | 0 |
| C | 0 | 202 | 0 |
| D | 0 | 202 | 0 |
| Mode M0 | |||
|---|---|---|---|
| Quadrant | BADHDUFLAG | Total packets | Discarded packets |
| A | 0 | 20407 | 7 |
| B | 0 | 22093 | 13 |
| C | 0 | 20764 | 17 |
| D | 0 | 26214 | 15 |
| Quadrant | Total seconds | Saturated seconds | Saturation percentage |
|---|---|---|---|
| A | 10080 | 22 | 0.218254% |
| B | 10078 | 94 | 0.932725% |
| C | 10076 | 72 | 0.714569% |
| D | 10078 | 519 | 5.149831% |
Noise dominated data is calculated using 1-second bins in cleaned event files. If a bin has >2000 counts, and if more than 50% of those come from <1% of pixels, then it is considered to be noise-dominated and hence unusable.
| Quadrant | # 1 sec bins | Bins with >0 counts | Bins with >2000 counts | High rate bins dominated by noise | Noise dominated (total time) | Noise dominated (detector-on time) | Marked lightcurve |
|---|---|---|---|---|---|---|---|
| A | 19285 | 10085 | 2 | 2 | 0.01% | 0.02% | 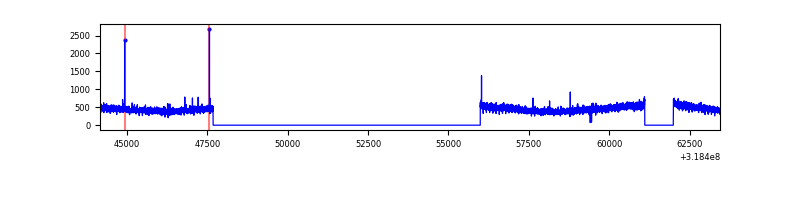 |
| B | 19285 | 10086 | 49 | 49 | 0.25% | 0.49% | 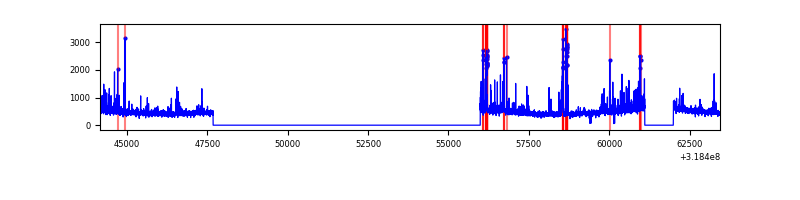 |
| C | 19285 | 10084 | 0 | 0 | 0.00% | 0.00% | 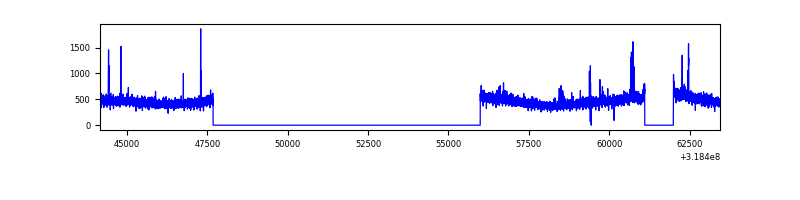 |
| D | 19286 | 10083 | 343 | 343 | 1.78% | 3.40% | 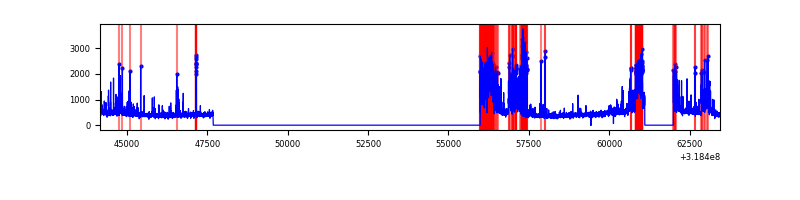 |
Top three noisy pixels from each quadrant. If the there are fewer than three noisy pixels in the level2.evt file, extra rows are filled as -1
| Pixel properties | Quadrant properties | ||||||
|---|---|---|---|---|---|---|---|
| Quadrant | DetID | PixID | Counts | Sigma | Mean | Median | Sigma |
| A | 13 | 254 | 17666 | 70.91 | 1159 | 1132 | 233.2 |
| A | 10 | 253 | 10674 | 40.92 | 1159 | 1132 | 233.2 |
| A | 3 | 137 | 10146 | 38.66 | 1159 | 1132 | 233.2 |
| B | 0 | 189 | 318144 | 1452.31 | 1157 | 1126 | 218.3 |
| B | 3 | 64 | 215984 | 984.3 | 1157 | 1126 | 218.3 |
| B | 0 | 229 | 27228 | 119.58 | 1157 | 1126 | 218.3 |
| C | 14 | 238 | 178164 | 673.04 | 1121 | 1127 | 263.0 |
| C | 7 | 247 | 97641 | 366.91 | 1121 | 1127 | 263.0 |
| C | 9 | 232 | 11125 | 38.01 | 1121 | 1127 | 263.0 |
| D | 9 | 85 | 1562521 | 5747.0 | 1118 | 1084 | 271.7 |
| D | 1 | 52 | 311591 | 1142.84 | 1118 | 1084 | 271.7 |
| D | 12 | 233 | 100602 | 366.28 | 1118 | 1084 | 271.7 |
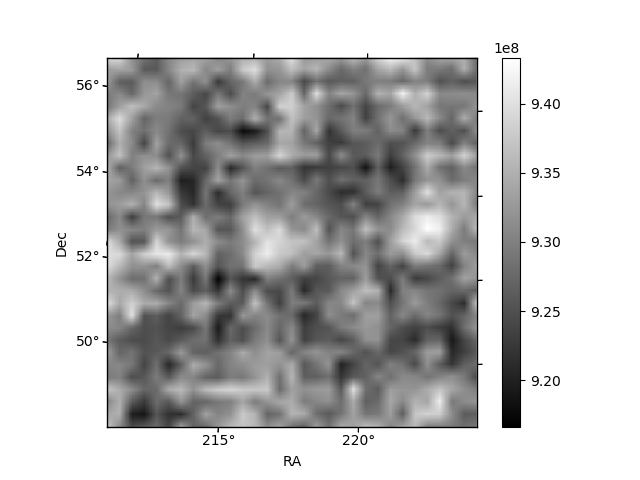
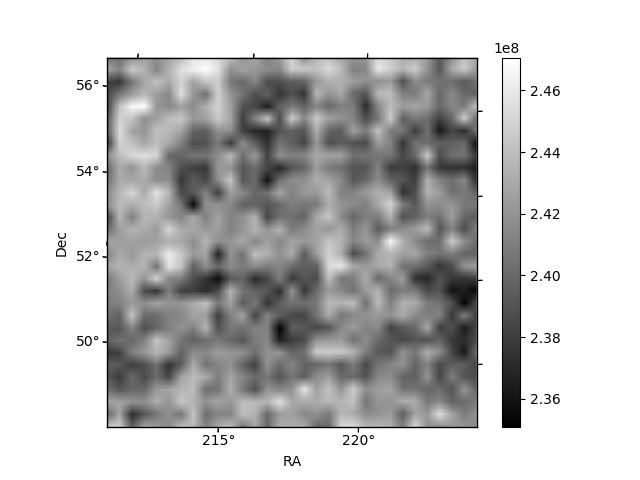
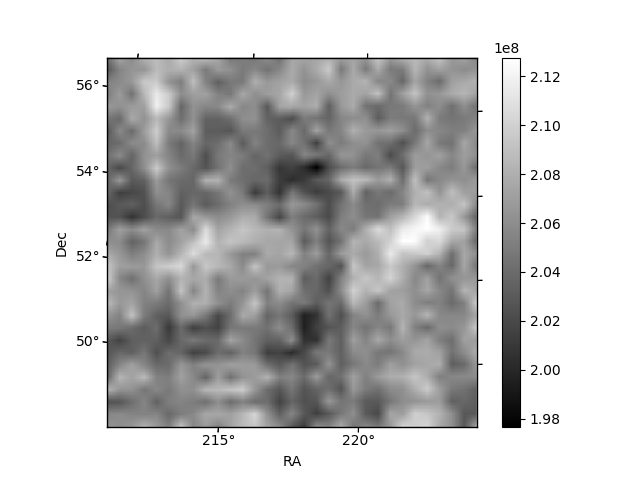
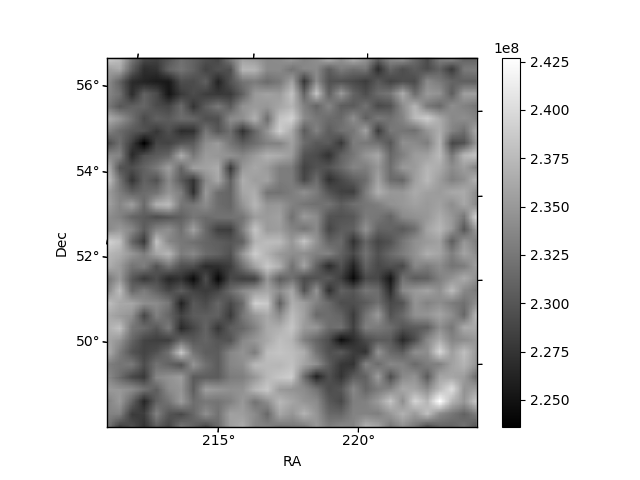
Histogram calculated using DETX and DETY for each event in the final _common_clean file
| Quadrant A | 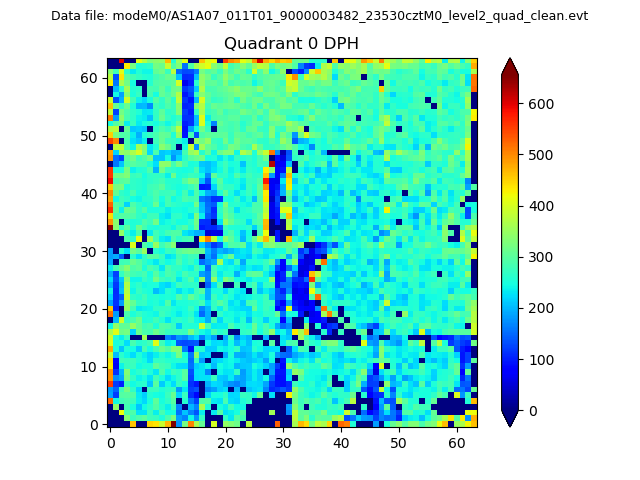 |
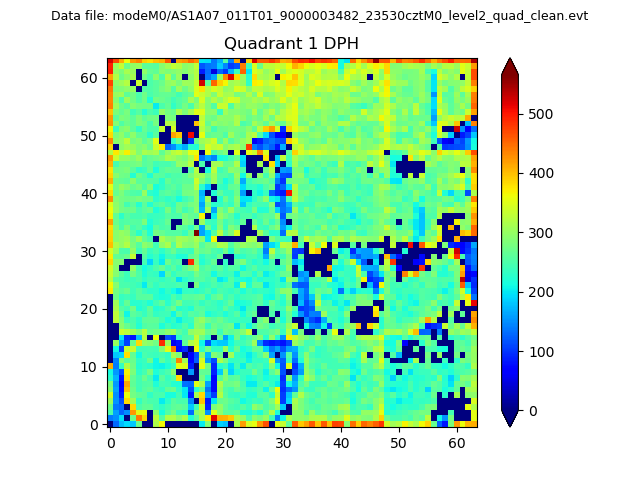 |
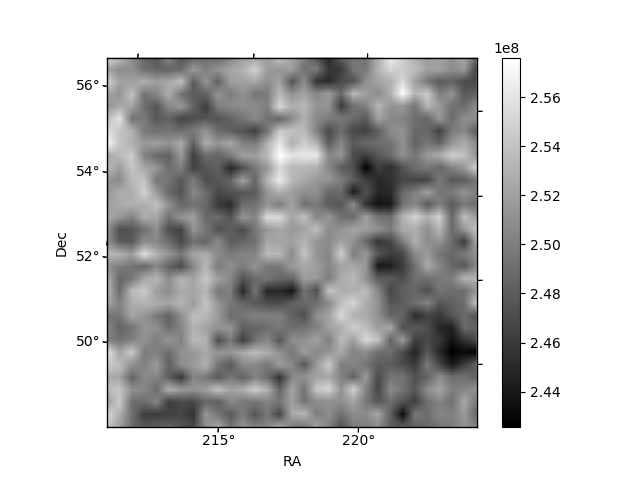
Quadrant B |
|---|---|---|---|
| Quadrant D | 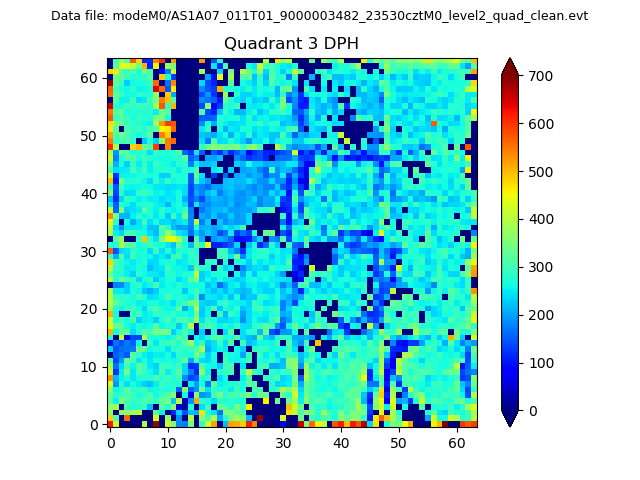 |
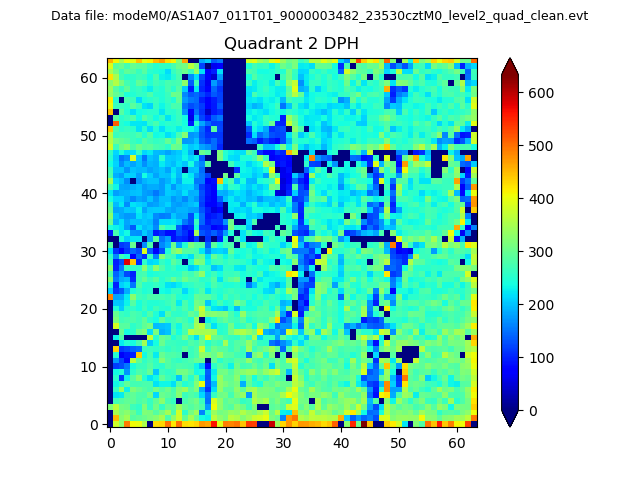 |
Quadrant C |
| Plot type | Count rate plots | Images |
|---|---|---|
| Comparison with Poisson distribution Blue bars denote a histogram of data divided into 1 sec bins. Red curve is a Poisson curve with rate = median count rate of data. |
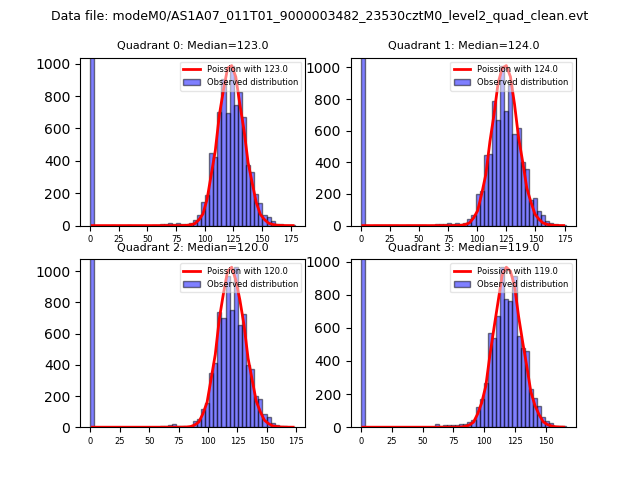 |
 |
| Quadrant-wise count rates Data is divided into 100 sec bins |
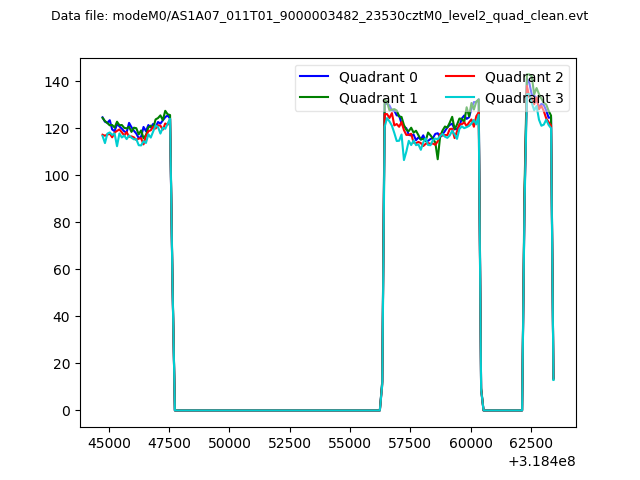 |
|
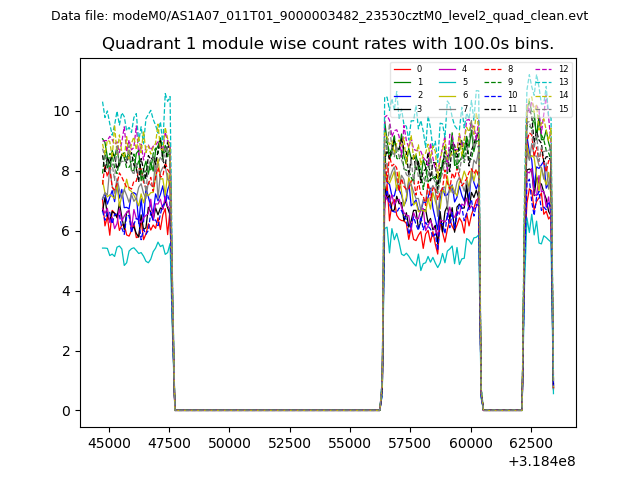
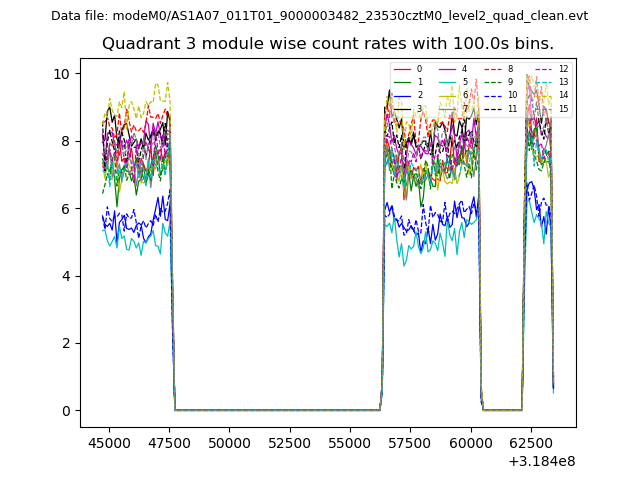
| Module-wise count rates for Quadrant A Data is divided into 100 sec bins |
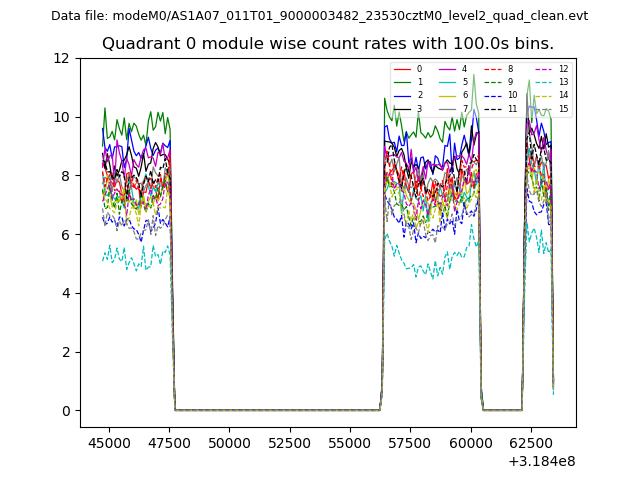 |
 |
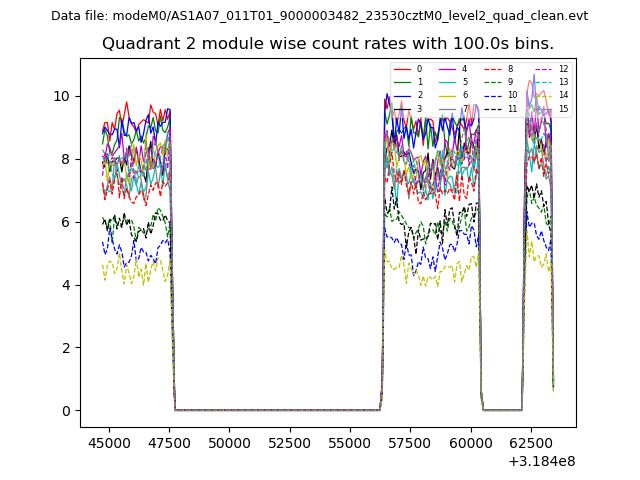
| Module-wise count rates for Quadrant B Data is divided into 100 sec bins |
 |
 |
| Module-wise count rates for Quadrant C Data is divided into 100 sec bins |
 |
 |
| Module-wise count rates for Quadrant D Data is divided into 100 sec bins |
 |
 |
| Parameter | Plot |
|---|---|
| CZT HV Monitor | 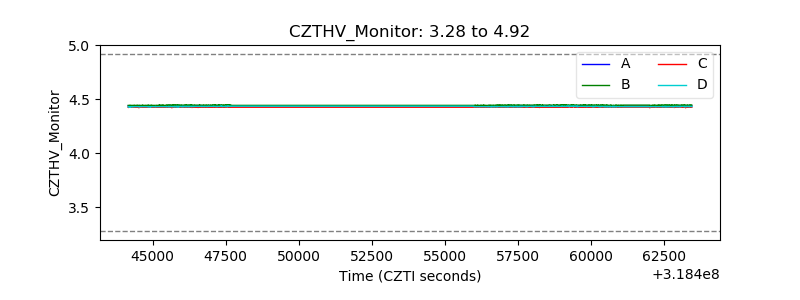 |
| D_VDD | 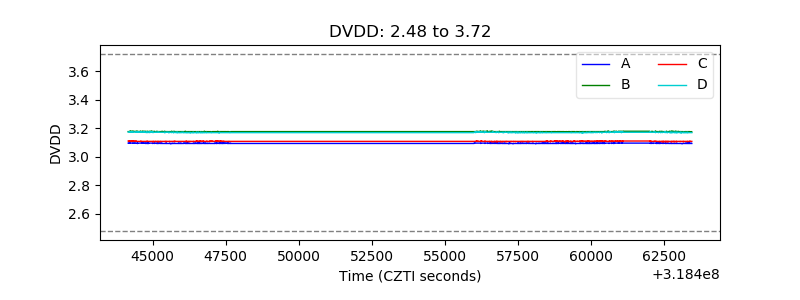 |
| Temperature 1 | 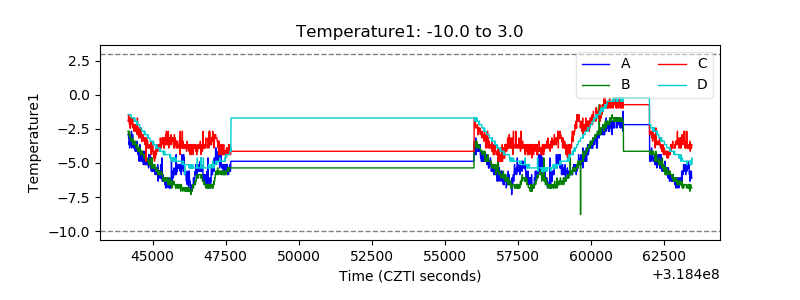 |
| Veto HV Monitor | 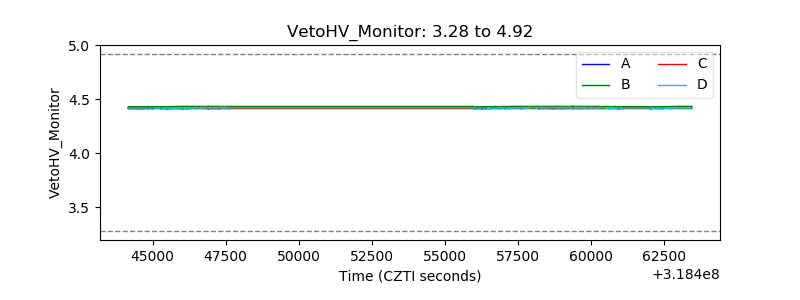 |
| Veto LLD | 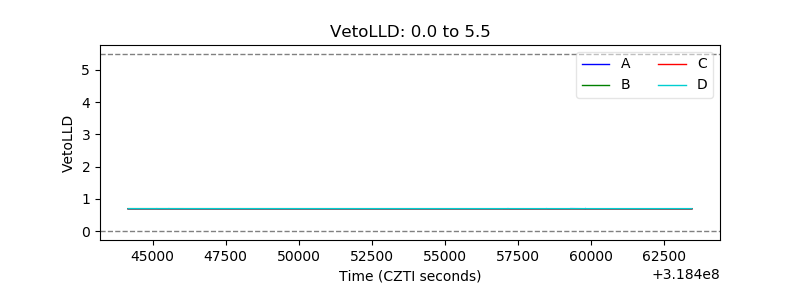 |
| Alpha Counter | 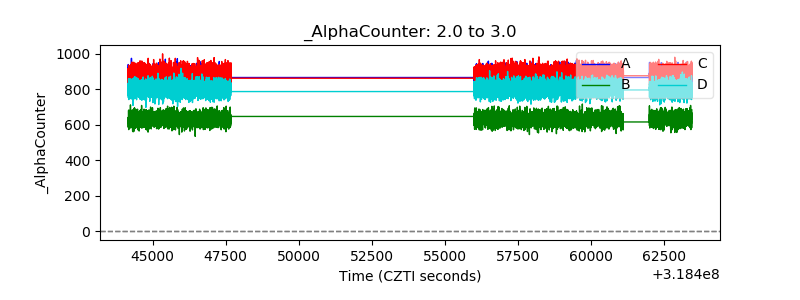 |
| _CPM_Rate | 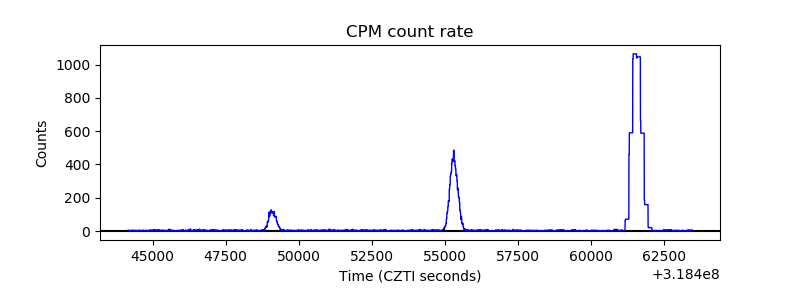 |
| CZT Counter | 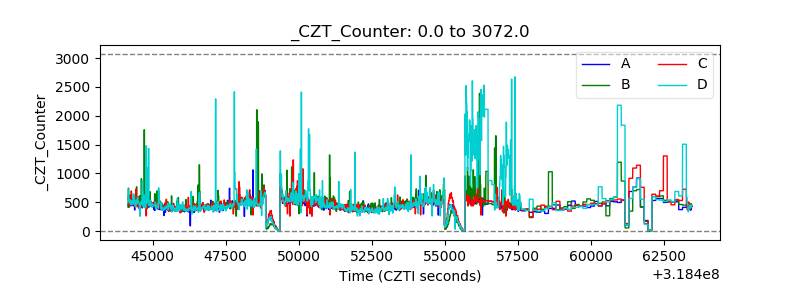 |
| +2.5 Volts monitor |  |
| +5 Volts monitor |  |
| _ROLL_ROT | 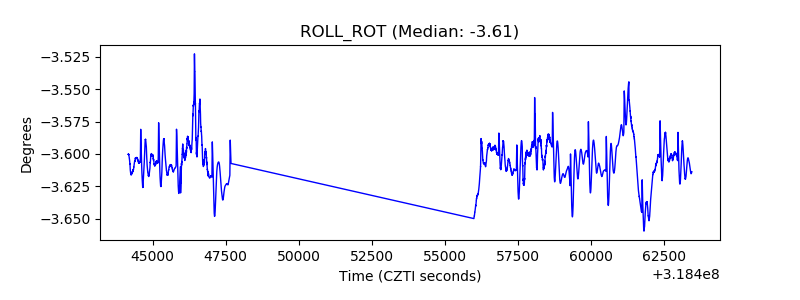 |
| _Roll_DEC | 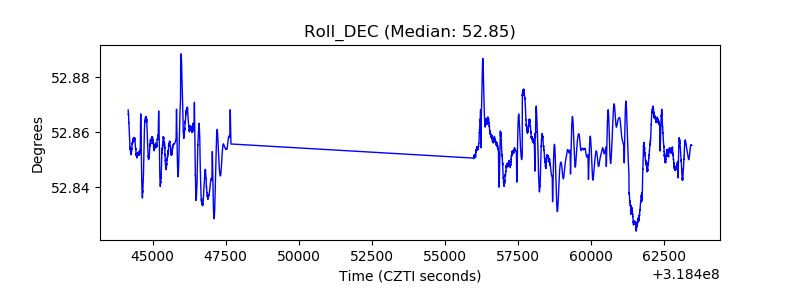 |
| _Roll_RA | 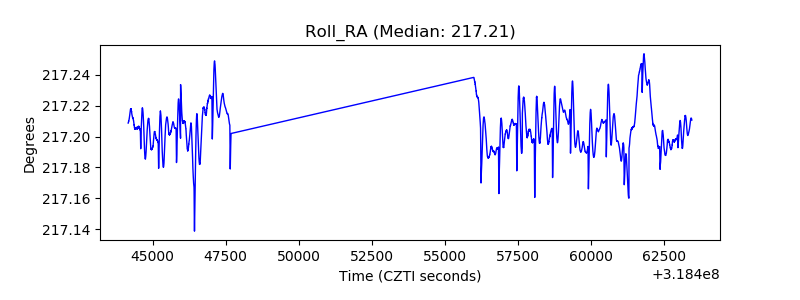 |
| Veto Counter | 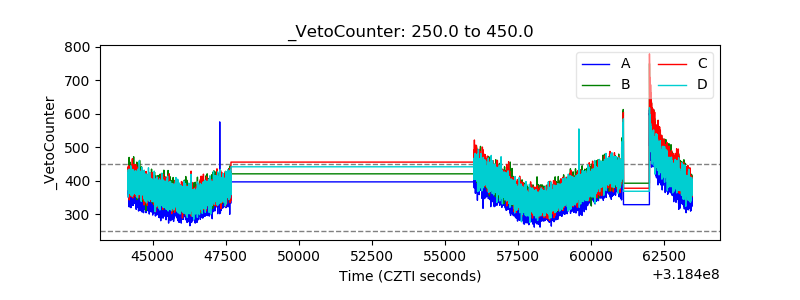 |