| Param | Original file | Final file |
|---|---|---|
| Filename | modeM0/AS1A07_011T01_9000003482_23533cztM0_level2.evt | modeM0/AS1A07_011T01_9000003482_23533cztM0_level2_quad_clean.evt |
| Size (bytes) | 464,434,560 | 107,228,160 |
| Size | 442.9 MB | 102.3 MB |
| Events in quadrant A | 3,017,919 | 707,071 |
| Events in quadrant B | 3,366,061 | 730,618 |
| Events in quadrant C | 3,101,706 | 698,772 |
| Events in quadrant D | 4,141,337 | 660,912 |
| Mode M9 | |||
|---|---|---|---|
| Quadrant | BADHDUFLAG | Total packets | Discarded packets |
| A | 0 | 13 | 1 |
| B | 0 | 13 | 0 |
| C | 0 | 14 | 2 |
| D | 0 | 13 | 1 |
| Mode SS | |||
|---|---|---|---|
| Quadrant | BADHDUFLAG | Total packets | Discarded packets |
| A | 0 | 134 | 2 |
| B | 0 | 134 | 2 |
| C | 0 | 135 | 5 |
| D | 0 | 134 | 4 |
| Mode M0 | |||
|---|---|---|---|
| Quadrant | BADHDUFLAG | Total packets | Discarded packets |
| A | 0 | 13459 | 162 |
| B | 0 | 14398 | 139 |
| C | 0 | 13656 | 150 |
| D | 0 | 16948 | 273 |
| Quadrant | Total seconds | Saturated seconds | Saturation percentage |
|---|---|---|---|
| A | 6453 | 15 | 0.232450% |
| B | 6462 | 70 | 1.083256% |
| C | 6460 | 69 | 1.068111% |
| D | 6446 | 166 | 2.575240% |
Noise dominated data is calculated using 1-second bins in cleaned event files. If a bin has >2000 counts, and if more than 50% of those come from <1% of pixels, then it is considered to be noise-dominated and hence unusable.
| Quadrant | # 1 sec bins | Bins with >0 counts | Bins with >2000 counts | High rate bins dominated by noise | Noise dominated (total time) | Noise dominated (detector-on time) | Marked lightcurve |
|---|---|---|---|---|---|---|---|
| A | 7787 | 6465 | 0 | 0 | 0.00% | 0.00% | 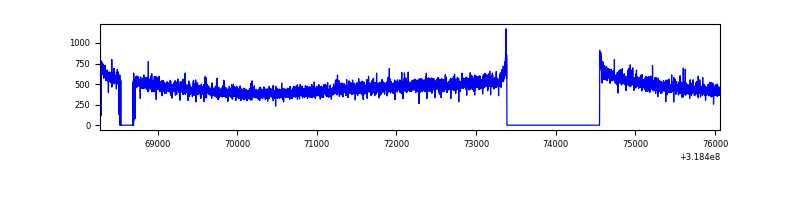 |
| B | 7787 | 6473 | 19 | 19 | 0.24% | 0.29% | 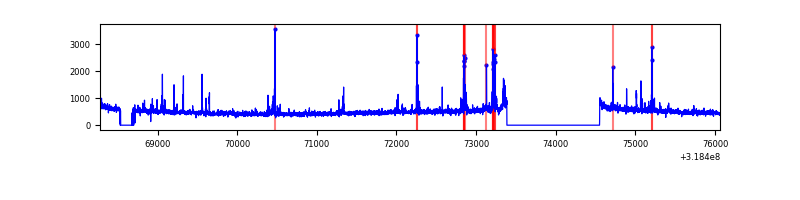 |
| C | 7787 | 6469 | 0 | 0 | 0.00% | 0.00% | 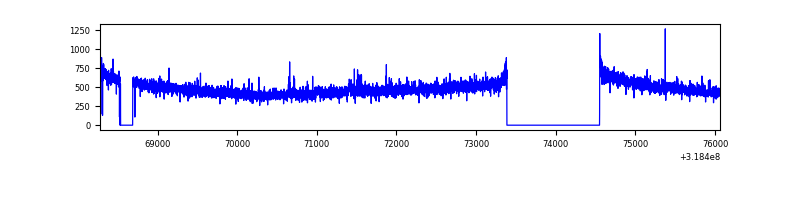 |
| D | 7786 | 6459 | 104 | 104 | 1.34% | 1.61% | 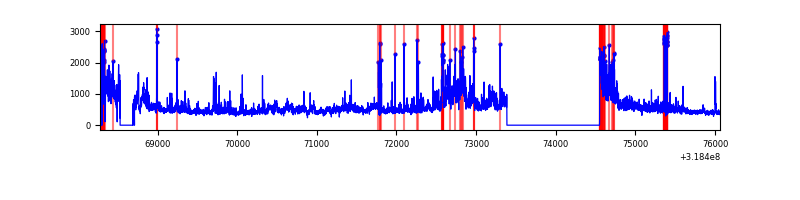 |
Top three noisy pixels from each quadrant. If the there are fewer than three noisy pixels in the level2.evt file, extra rows are filled as -1
| Pixel properties | Quadrant properties | ||||||
|---|---|---|---|---|---|---|---|
| Quadrant | DetID | PixID | Counts | Sigma | Mean | Median | Sigma |
| A | 13 | 254 | 11218 | 66.68 | 782 | 767 | 156.7 |
| A | 3 | 137 | 6676 | 37.7 | 782 | 767 | 156.7 |
| A | 0 | 226 | 6627 | 37.39 | 782 | 767 | 156.7 |
| B | 3 | 64 | 118642 | 799.08 | 786 | 767 | 147.5 |
| B | 0 | 189 | 116827 | 786.78 | 786 | 767 | 147.5 |
| B | 0 | 230 | 28181 | 185.84 | 786 | 767 | 147.5 |
| C | 14 | 238 | 122622 | 694.24 | 756 | 763 | 175.5 |
| C | 7 | 247 | 24651 | 136.09 | 756 | 763 | 175.5 |
| C | 13 | 61 | 5378 | 26.29 | 756 | 763 | 175.5 |
| D | 1 | 52 | 707505 | 3962.81 | 744 | 724 | 178.4 |
| D | 9 | 85 | 573447 | 3211.16 | 744 | 724 | 178.4 |
| D | 2 | 234 | 26040 | 141.94 | 744 | 724 | 178.4 |
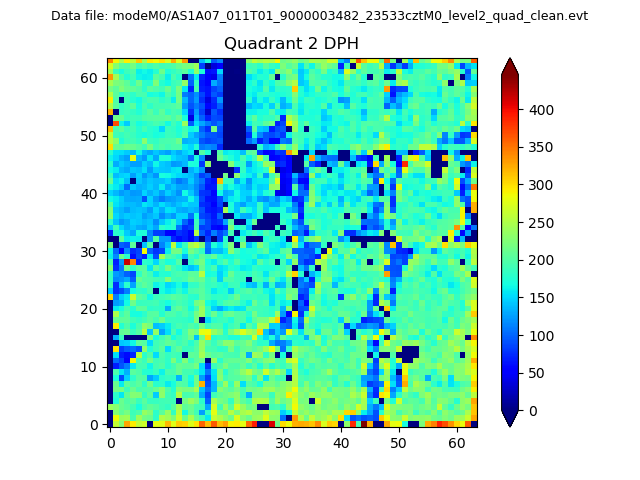
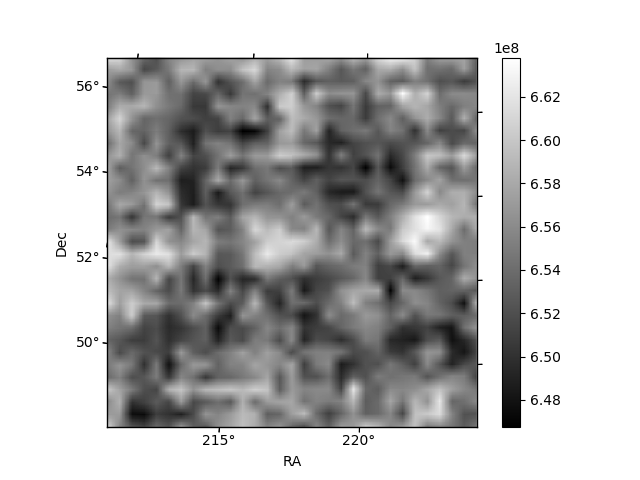
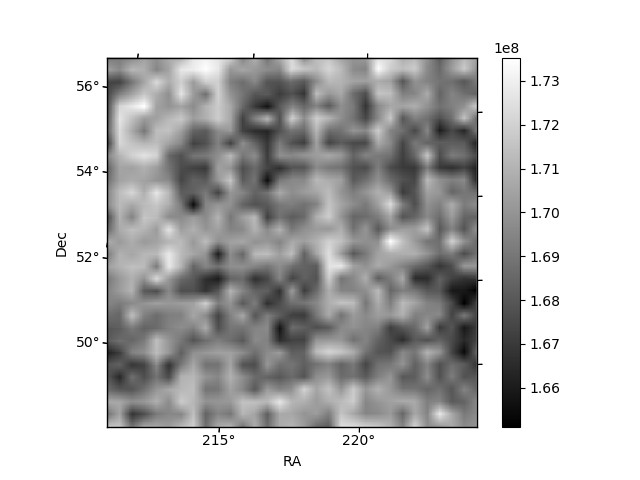
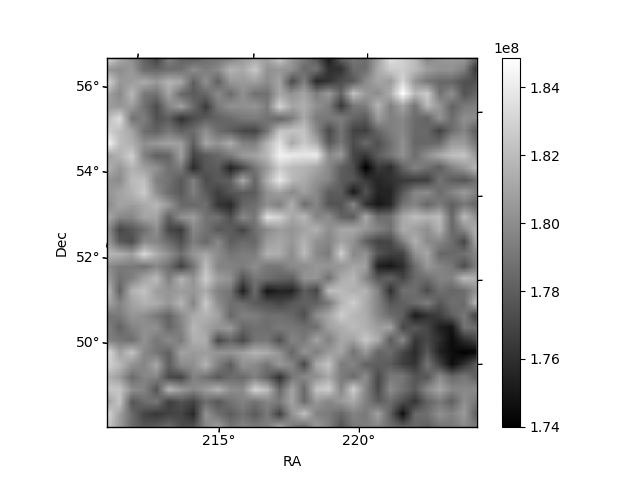
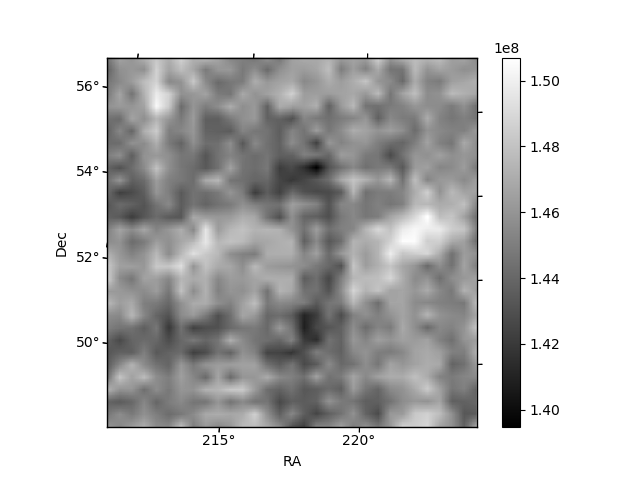
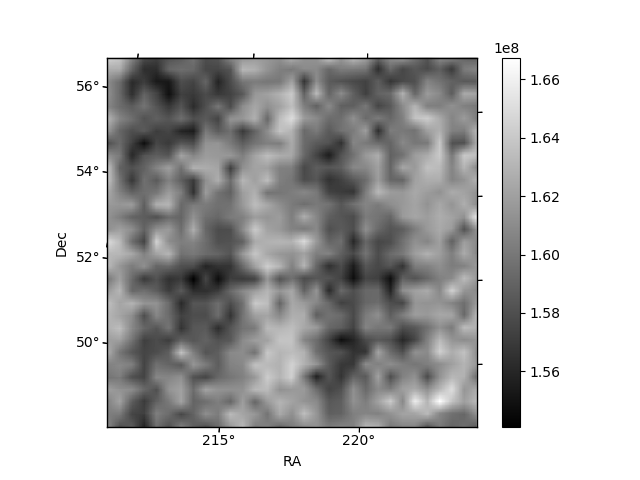
Histogram calculated using DETX and DETY for each event in the final _common_clean file
| Quadrant A | 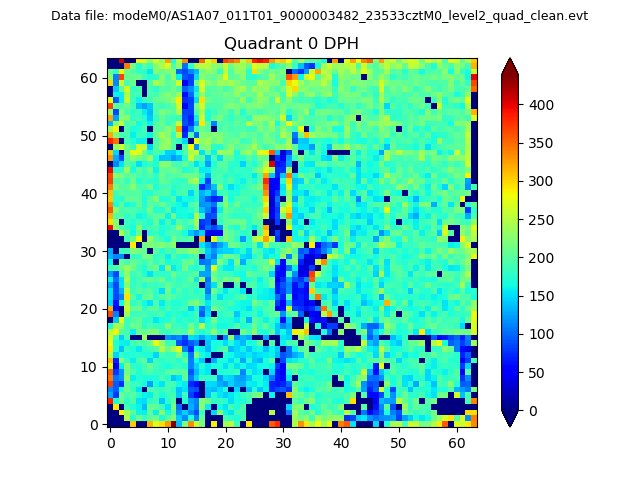 |
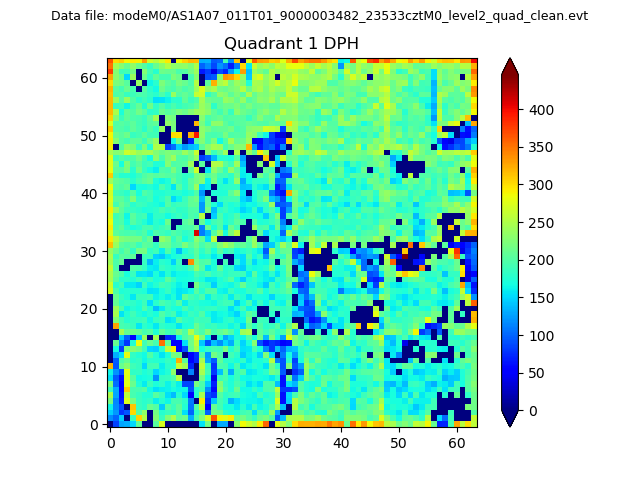 |
Quadrant B |
|---|---|---|---|
| Quadrant D | 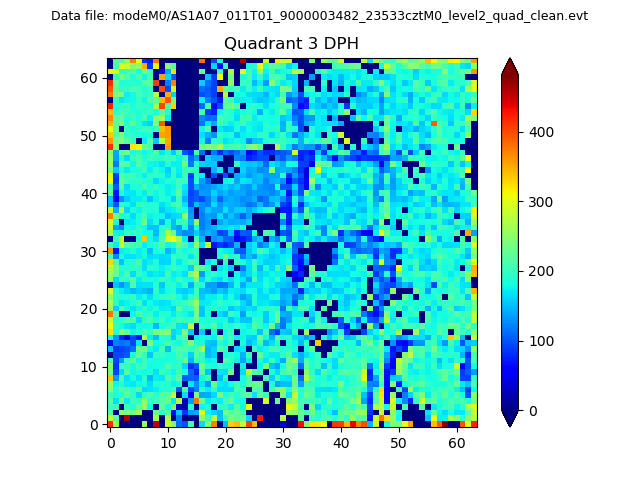 |
 |
Quadrant C |
| Plot type | Count rate plots | Images |
|---|---|---|
| Comparison with Poisson distribution Blue bars denote a histogram of data divided into 1 sec bins. Red curve is a Poisson curve with rate = median count rate of data. |
 |
 |
| Quadrant-wise count rates Data is divided into 100 sec bins |
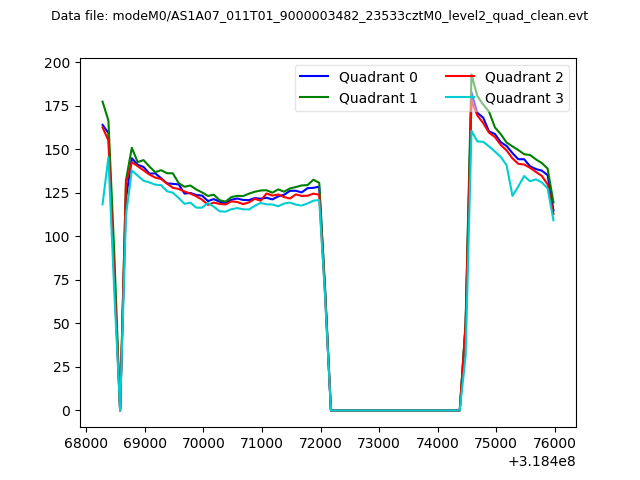 |
|
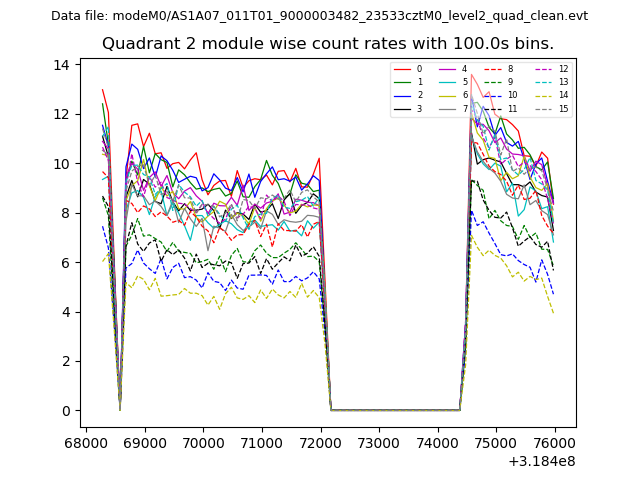
| Module-wise count rates for Quadrant A Data is divided into 100 sec bins |
 |
 |
| Module-wise count rates for Quadrant B Data is divided into 100 sec bins |
 |
 |
| Module-wise count rates for Quadrant C Data is divided into 100 sec bins |
 |
 |
| Module-wise count rates for Quadrant D Data is divided into 100 sec bins |
 |
 |
| Parameter | Plot |
|---|---|
| CZT HV Monitor | 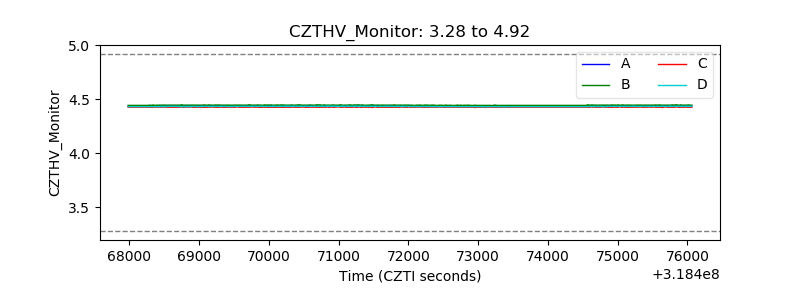 |
| D_VDD | 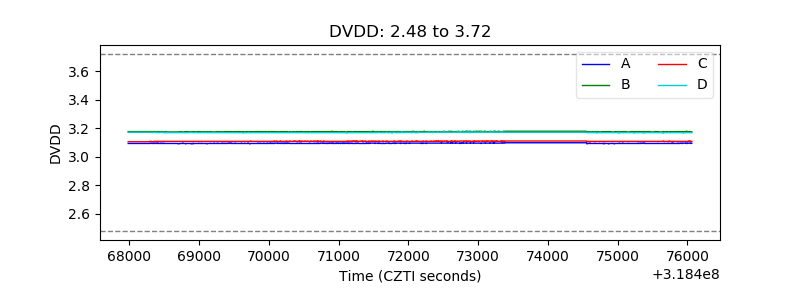 |
| Temperature 1 | 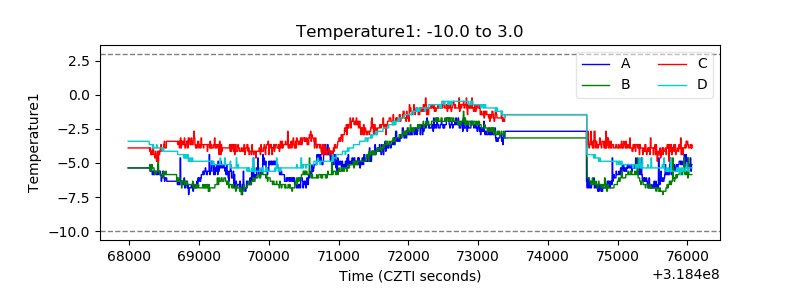 |
| Veto HV Monitor | 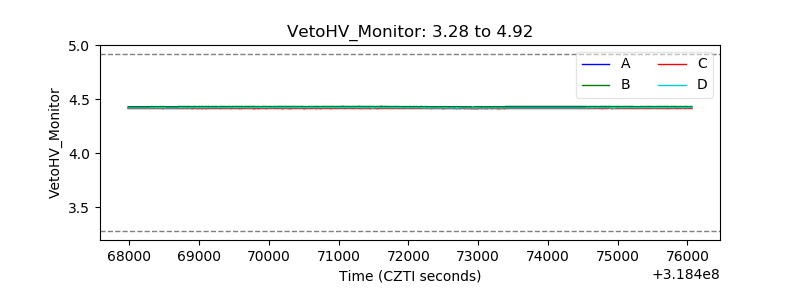 |
| Veto LLD | 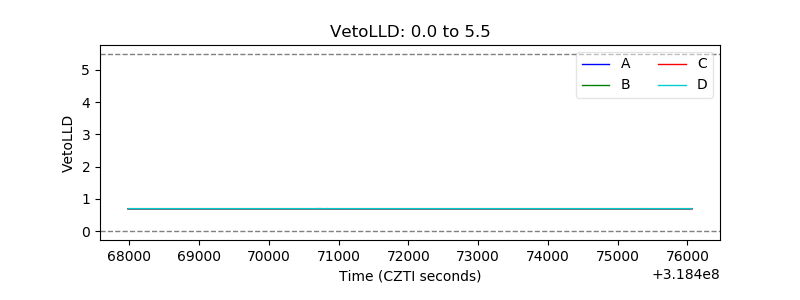 |
| Alpha Counter | 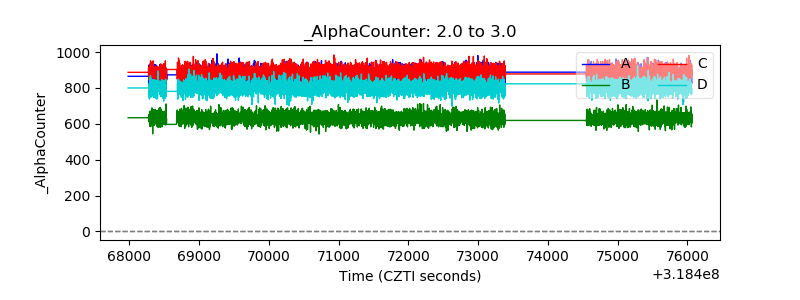 |
| _CPM_Rate | 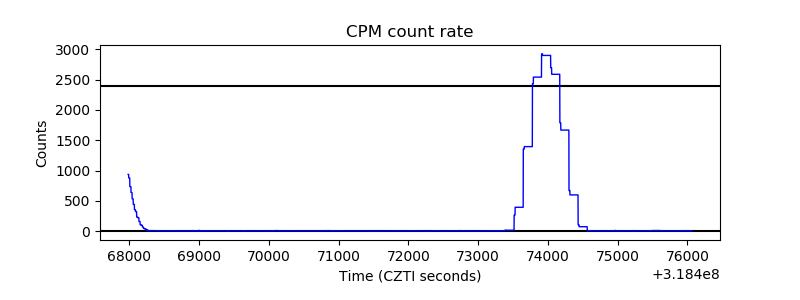 |
| CZT Counter | 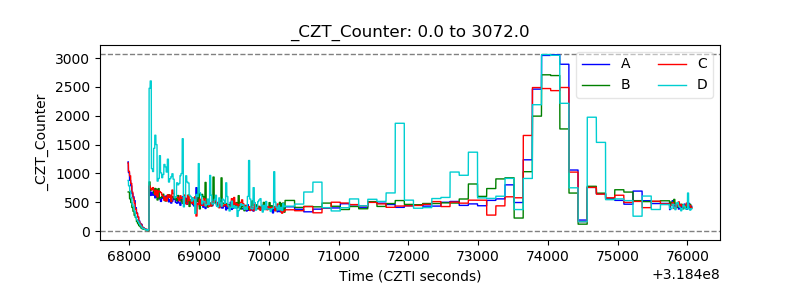 |
| +2.5 Volts monitor |  |
| +5 Volts monitor | 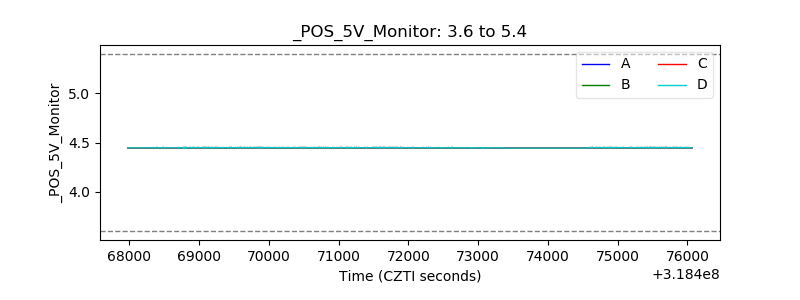 |
| _ROLL_ROT | 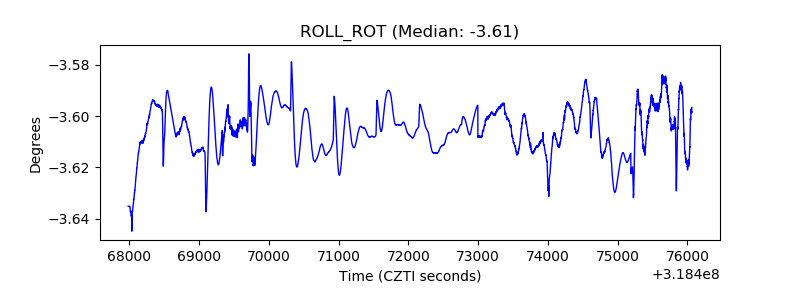 |
| _Roll_DEC | 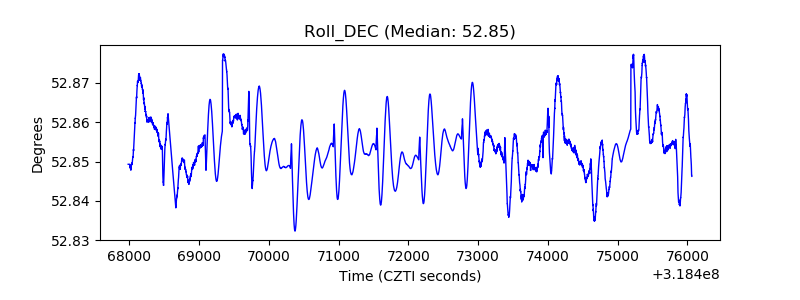 |
| _Roll_RA | 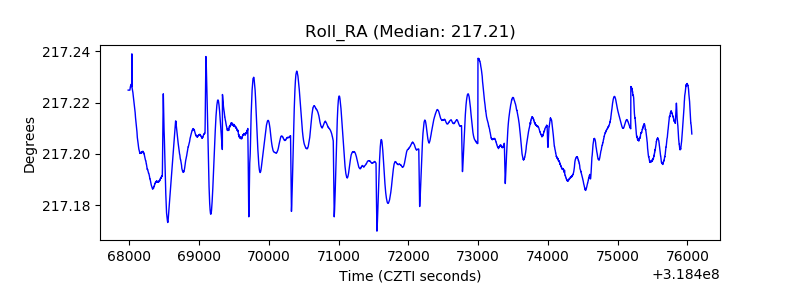 |
| Veto Counter | 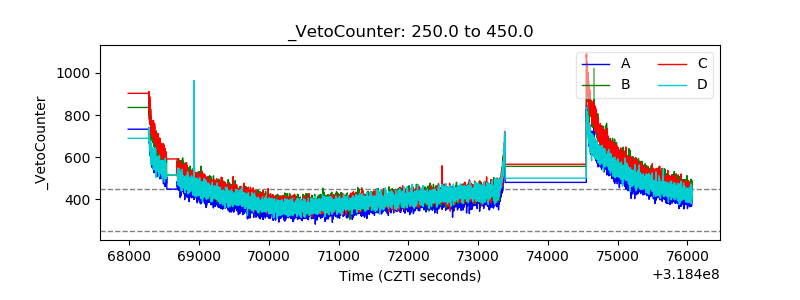 |