| Param | Original file | Final file |
|---|---|---|
| Filename | modeM0/AS1A07_011T01_9000003482_23534cztM0_level2.evt | modeM0/AS1A07_011T01_9000003482_23534cztM0_level2_quad_clean.evt |
| Size (bytes) | 1,441,336,320 | 320,402,880 |
| Size | 1.3 GB | 305.6 MB |
| Events in quadrant A | 9,574,351 | 2,097,866 |
| Events in quadrant B | 10,873,910 | 2,127,464 |
| Events in quadrant C | 9,862,755 | 2,045,293 |
| Events in quadrant D | 11,931,173 | 1,999,346 |
| Mode M9 | |||
|---|---|---|---|
| Quadrant | BADHDUFLAG | Total packets | Discarded packets |
| A | 0 | 28 | 0 |
| B | 0 | 29 | 0 |
| C | 0 | 29 | 0 |
| D | 0 | 29 | 0 |
| Mode SS | |||
|---|---|---|---|
| Quadrant | BADHDUFLAG | Total packets | Discarded packets |
| A | 0 | 424 | 0 |
| B | 0 | 424 | 0 |
| C | 0 | 424 | 0 |
| D | 0 | 424 | 0 |
| Mode M0 | |||
|---|---|---|---|
| Quadrant | BADHDUFLAG | Total packets | Discarded packets |
| A | 0 | 42620 | 4 |
| B | 0 | 46269 | 6 |
| C | 0 | 43240 | 9 |
| D | 0 | 50582 | 6 |
| Quadrant | Total seconds | Saturated seconds | Saturation percentage |
|---|---|---|---|
| A | 20839 | 113 | 0.542253% |
| B | 20838 | 279 | 1.338900% |
| C | 20837 | 238 | 1.142199% |
| D | 20839 | 684 | 3.282307% |
Noise dominated data is calculated using 1-second bins in cleaned event files. If a bin has >2000 counts, and if more than 50% of those come from <1% of pixels, then it is considered to be noise-dominated and hence unusable.
| Quadrant | # 1 sec bins | Bins with >0 counts | Bins with >2000 counts | High rate bins dominated by noise | Noise dominated (total time) | Noise dominated (detector-on time) | Marked lightcurve |
|---|---|---|---|---|---|---|---|
| A | 37954 | 20842 | 3 | 3 | 0.01% | 0.01% | 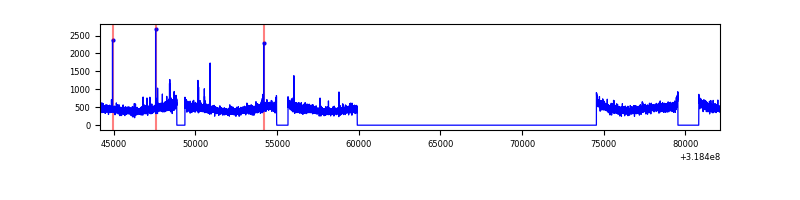 |
| B | 37954 | 20840 | 97 | 97 | 0.26% | 0.47% | 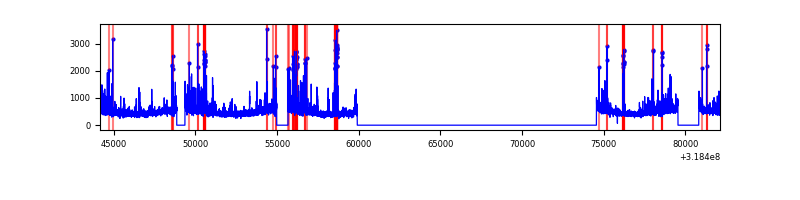 |
| C | 37954 | 20840 | 4 | 4 | 0.01% | 0.02% | 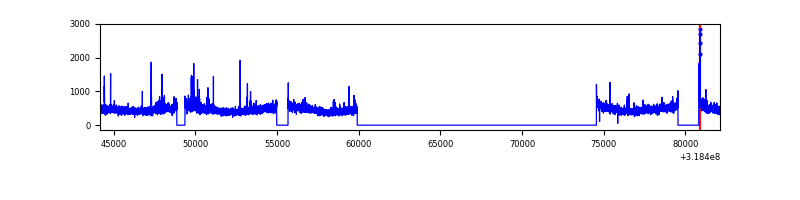 |
| D | 37955 | 20842 | 406 | 406 | 1.07% | 1.95% | 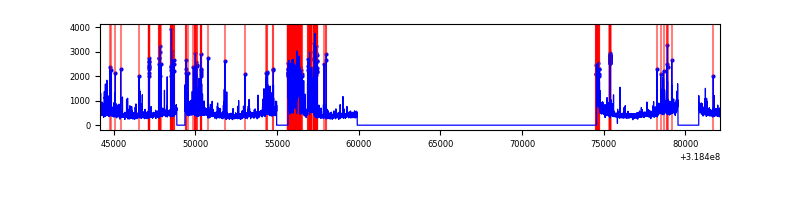 |
Top three noisy pixels from each quadrant. If the there are fewer than three noisy pixels in the level2.evt file, extra rows are filled as -1
| Pixel properties | Quadrant properties | ||||||
|---|---|---|---|---|---|---|---|
| Quadrant | DetID | PixID | Counts | Sigma | Mean | Median | Sigma |
| A | 13 | 254 | 36646 | 69.42 | 2475 | 2420 | 493.0 |
| A | 10 | 253 | 28463 | 52.82 | 2475 | 2420 | 493.0 |
| A | 3 | 137 | 21472 | 38.64 | 2475 | 2420 | 493.0 |
| B | 0 | 189 | 609845 | 1321.48 | 2463 | 2405 | 459.7 |
| B | 3 | 64 | 364281 | 787.26 | 2463 | 2405 | 459.7 |
| B | 0 | 229 | 90171 | 190.93 | 2463 | 2405 | 459.7 |
| C | 14 | 238 | 379902 | 689.17 | 2371 | 2390 | 547.8 |
| C | 7 | 247 | 151676 | 272.53 | 2371 | 2390 | 547.8 |
| C | 0 | 10 | 30408 | 51.15 | 2371 | 2390 | 547.8 |
| D | 9 | 85 | 1629792 | 2842.3 | 2377 | 2308 | 572.6 |
| D | 1 | 52 | 982854 | 1712.46 | 2377 | 2308 | 572.6 |
| D | 12 | 233 | 115615 | 197.88 | 2377 | 2308 | 572.6 |
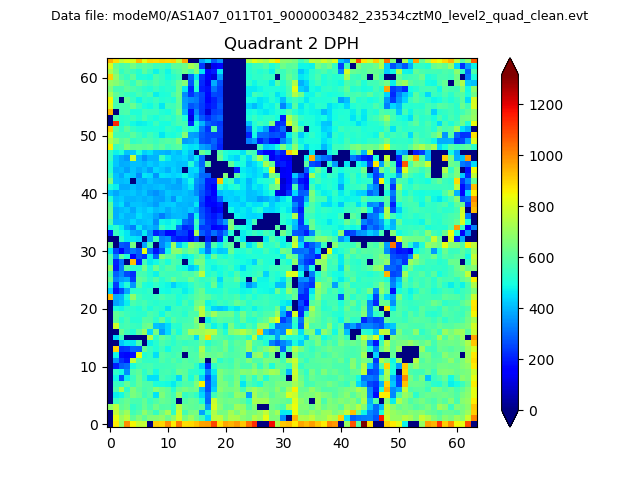
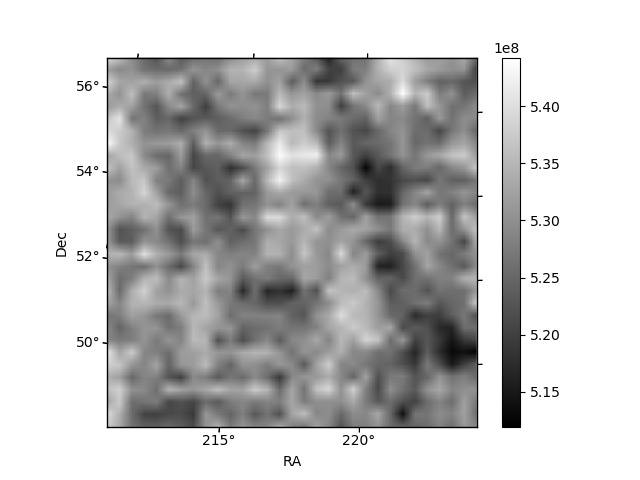
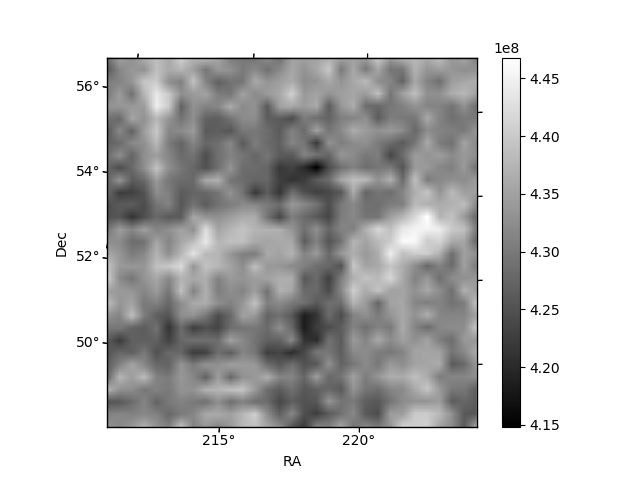
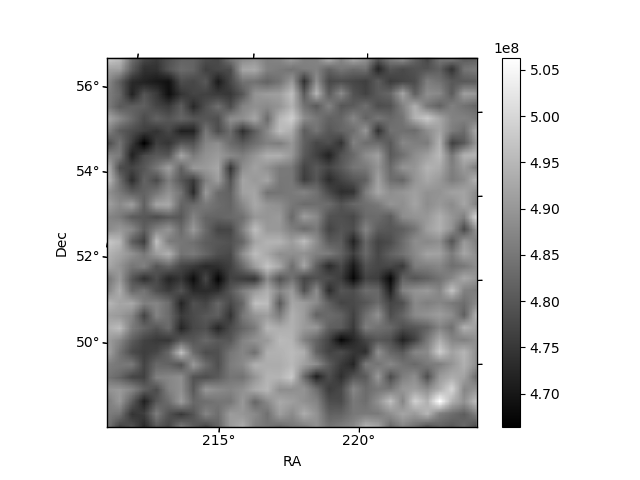
Histogram calculated using DETX and DETY for each event in the final _common_clean file
| Quadrant A | 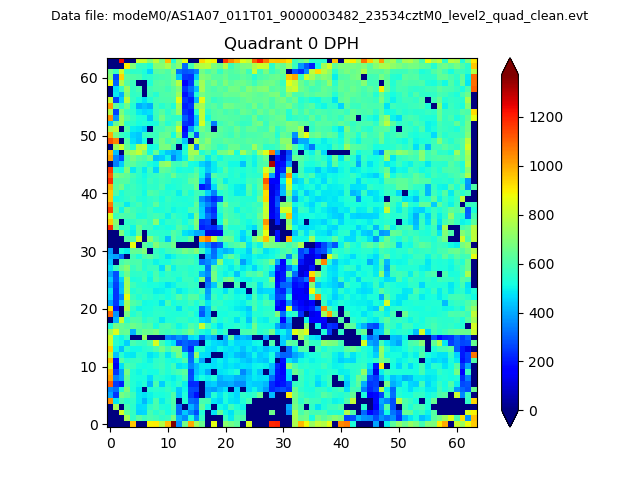 |
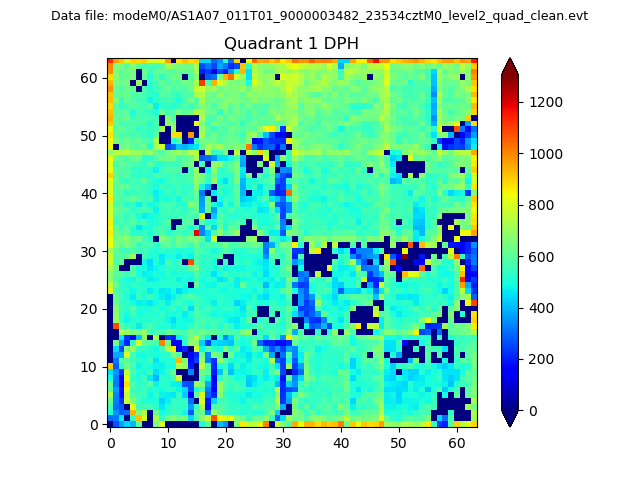 |
Quadrant B |
|---|---|---|---|
| Quadrant D | 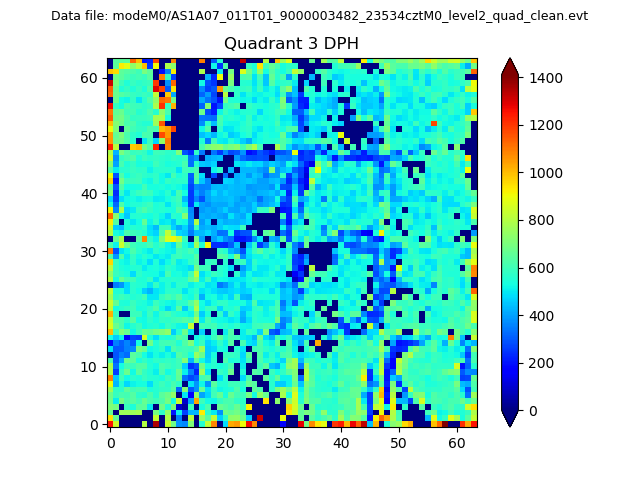 |
 |
Quadrant C |
| Plot type | Count rate plots | Images |
|---|---|---|
| Comparison with Poisson distribution Blue bars denote a histogram of data divided into 1 sec bins. Red curve is a Poisson curve with rate = median count rate of data. |
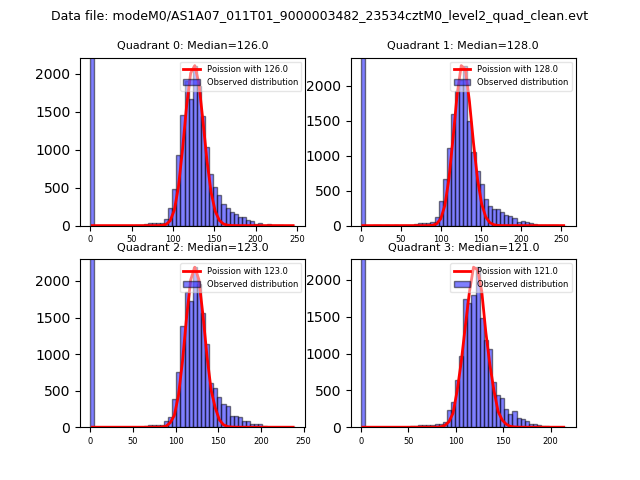 |
 |
| Quadrant-wise count rates Data is divided into 100 sec bins |
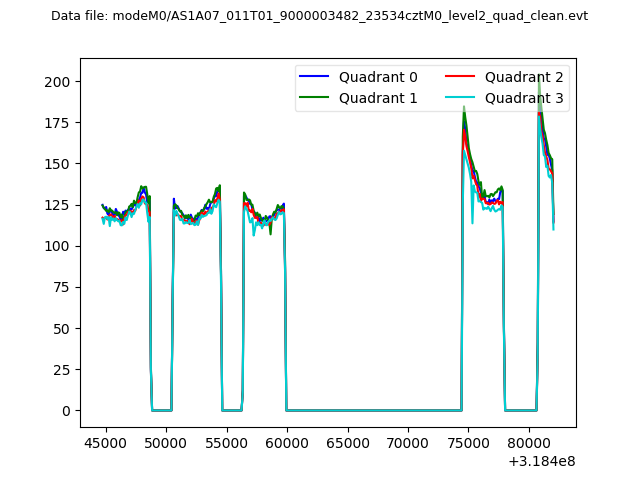 |
|
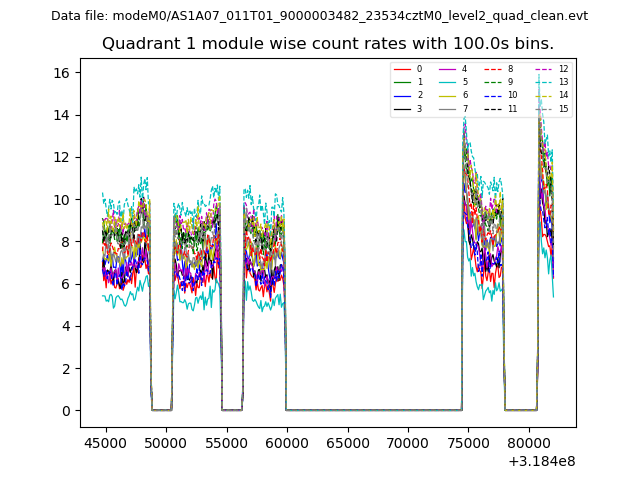
| Module-wise count rates for Quadrant A Data is divided into 100 sec bins |
 |
 |
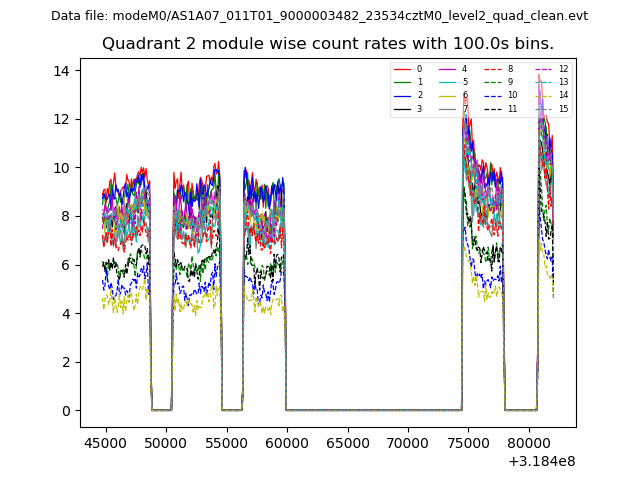
| Module-wise count rates for Quadrant B Data is divided into 100 sec bins |
 |
 |
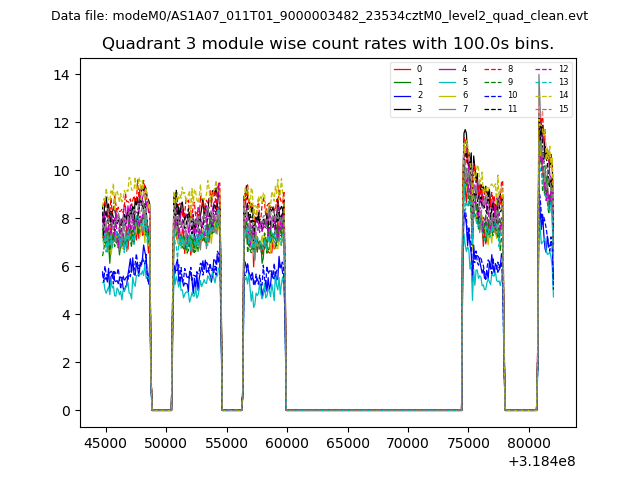
| Module-wise count rates for Quadrant C Data is divided into 100 sec bins |
 |
 |
| Module-wise count rates for Quadrant D Data is divided into 100 sec bins |
 |
 |
| Parameter | Plot |
|---|---|
| CZT HV Monitor | 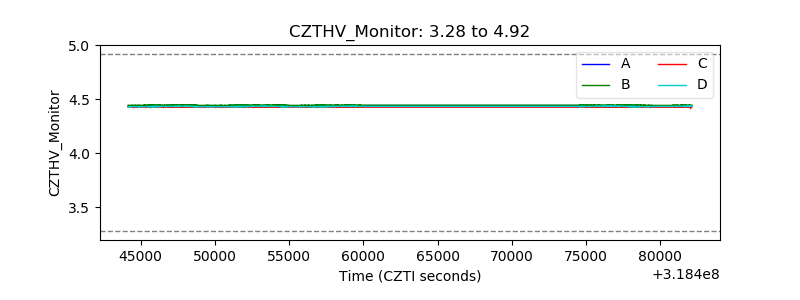 |
| D_VDD | 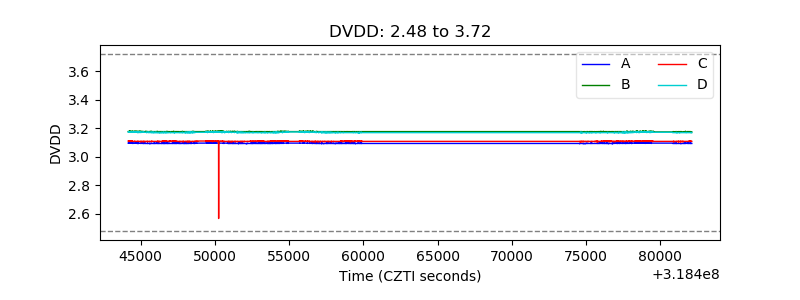 |
| Temperature 1 | 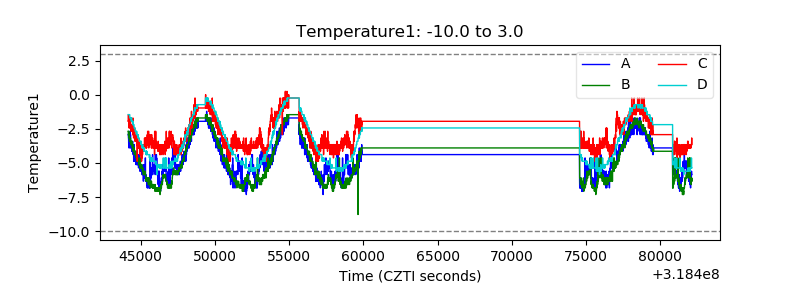 |
| Veto HV Monitor | 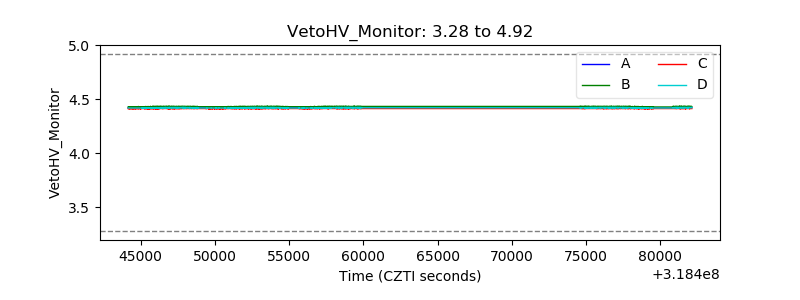 |
| Veto LLD | 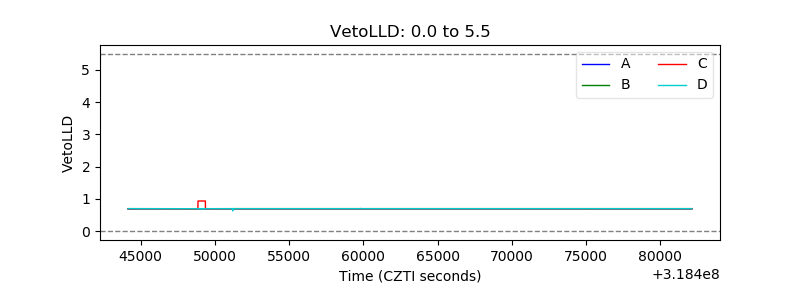 |
| Alpha Counter |  |
| _CPM_Rate | 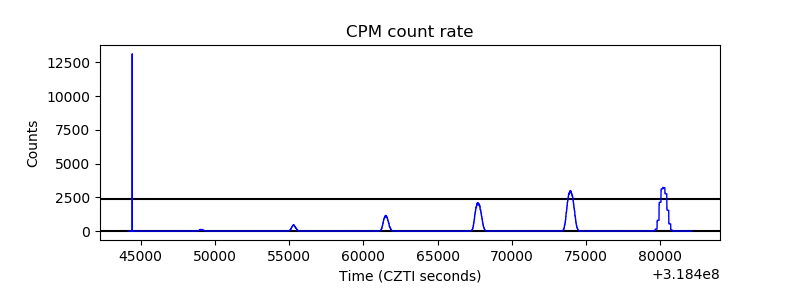 |
| CZT Counter | 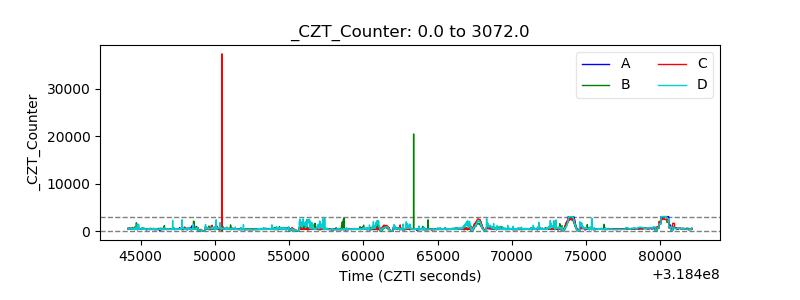 |
| +2.5 Volts monitor |  |
| +5 Volts monitor |  |
| _ROLL_ROT | 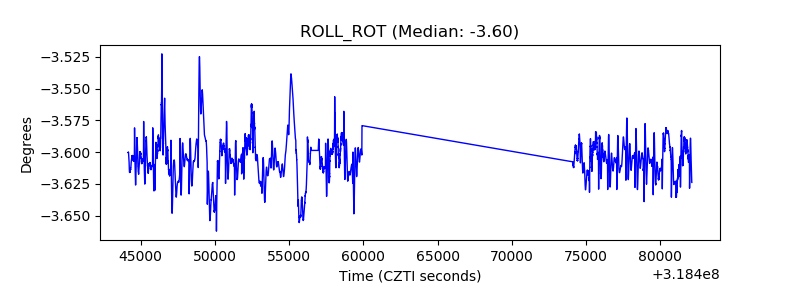 |
| _Roll_DEC | 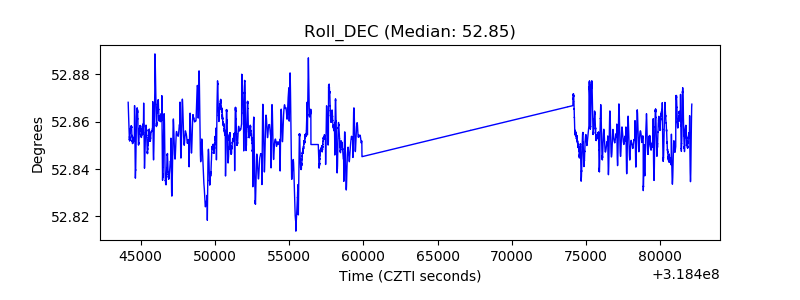 |
| _Roll_RA | 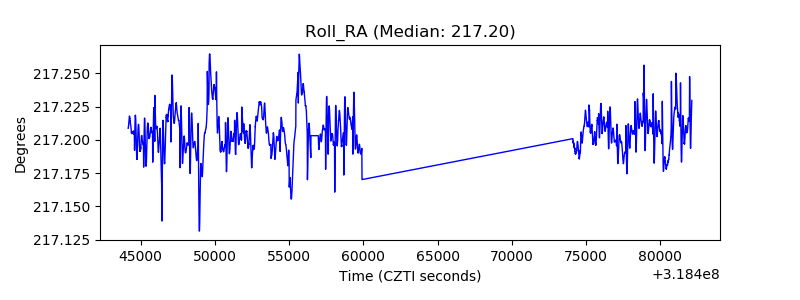 |
| Veto Counter | 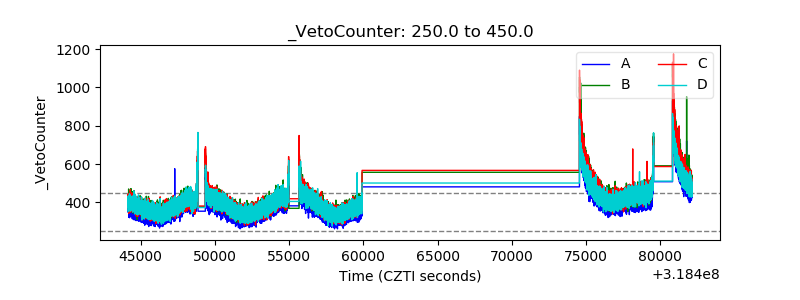 |