| Param | Original file | Final file |
|---|---|---|
| Filename | modeM0/AS1A07_011T01_9000003482_23535cztM0_level2.evt | modeM0/AS1A07_011T01_9000003482_23535cztM0_level2_quad_clean.evt |
| Size (bytes) | 1,498,492,800 | 326,782,080 |
| Size | 1.4 GB | 311.6 MB |
| Events in quadrant A | 10,016,255 | 2,139,472 |
| Events in quadrant B | 11,012,445 | 2,190,445 |
| Events in quadrant C | 10,212,344 | 2,092,616 |
| Events in quadrant D | 12,709,067 | 2,016,665 |
| Mode M9 | |||
|---|---|---|---|
| Quadrant | BADHDUFLAG | Total packets | Discarded packets |
| A | 0 | 47 | 0 |
| B | 0 | 47 | 0 |
| C | 0 | 47 | 0 |
| D | 0 | 47 | 0 |
| Mode SS | |||
|---|---|---|---|
| Quadrant | BADHDUFLAG | Total packets | Discarded packets |
| A | 0 | 434 | 0 |
| B | 0 | 434 | 0 |
| C | 0 | 434 | 0 |
| D | 0 | 434 | 0 |
| Mode M0 | |||
|---|---|---|---|
| Quadrant | BADHDUFLAG | Total packets | Discarded packets |
| A | 0 | 43594 | 4 |
| B | 0 | 46591 | 5 |
| C | 0 | 44152 | 4 |
| D | 0 | 52533 | 4 |
| Quadrant | Total seconds | Saturated seconds | Saturation percentage |
|---|---|---|---|
| A | 21190 | 69 | 0.325625% |
| B | 21190 | 182 | 0.858896% |
| C | 21190 | 227 | 1.071260% |
| D | 21190 | 390 | 1.840491% |
Noise dominated data is calculated using 1-second bins in cleaned event files. If a bin has >2000 counts, and if more than 50% of those come from <1% of pixels, then it is considered to be noise-dominated and hence unusable.
| Quadrant | # 1 sec bins | Bins with >0 counts | Bins with >2000 counts | High rate bins dominated by noise | Noise dominated (total time) | Noise dominated (detector-on time) | Marked lightcurve |
|---|---|---|---|---|---|---|---|
| A | 26020 | 21193 | 9 | 9 | 0.03% | 0.04% | 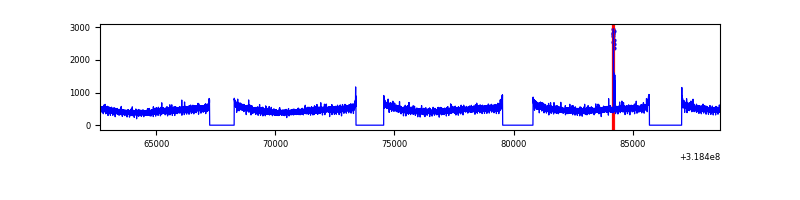 |
| B | 26020 | 21192 | 56 | 56 | 0.22% | 0.26% | 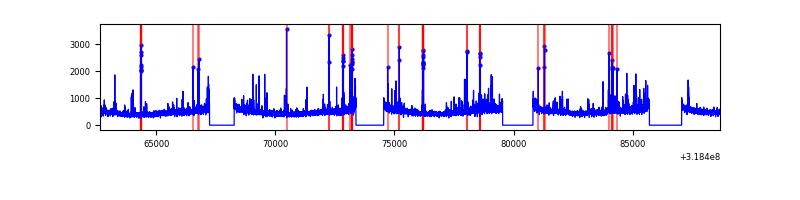 |
| C | 26020 | 21192 | 4 | 4 | 0.02% | 0.02% | 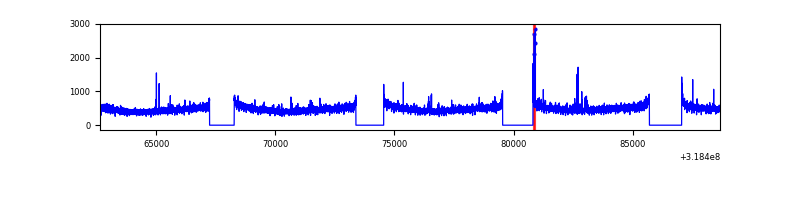 |
| D | 26020 | 21194 | 226 | 226 | 0.87% | 1.07% | 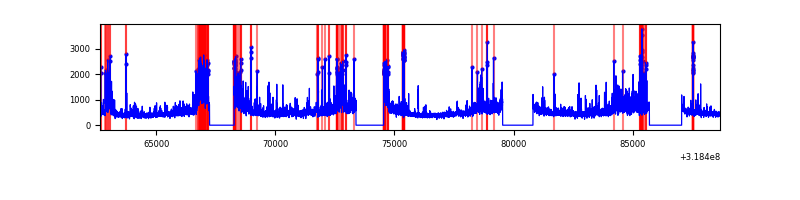 |
Top three noisy pixels from each quadrant. If the there are fewer than three noisy pixels in the level2.evt file, extra rows are filled as -1
| Pixel properties | Quadrant properties | ||||||
|---|---|---|---|---|---|---|---|
| Quadrant | DetID | PixID | Counts | Sigma | Mean | Median | Sigma |
| A | 13 | 254 | 36849 | 67.07 | 2588 | 2540 | 511.5 |
| A | 0 | 31 | 34541 | 62.56 | 2588 | 2540 | 511.5 |
| A | 0 | 226 | 22359 | 38.74 | 2588 | 2540 | 511.5 |
| B | 0 | 189 | 442094 | 920.0 | 2581 | 2519 | 477.8 |
| B | 3 | 64 | 186857 | 385.8 | 2581 | 2519 | 477.8 |
| B | 0 | 229 | 67932 | 136.9 | 2581 | 2519 | 477.8 |
| C | 14 | 238 | 401707 | 703.33 | 2472 | 2492 | 567.6 |
| C | 7 | 247 | 87996 | 150.64 | 2472 | 2492 | 567.6 |
| C | 0 | 10 | 60904 | 102.91 | 2472 | 2492 | 567.6 |
| D | 9 | 85 | 1620052 | 2710.95 | 2477 | 2404 | 596.7 |
| D | 1 | 52 | 1553782 | 2599.89 | 2477 | 2404 | 596.7 |
| D | 2 | 234 | 85241 | 138.82 | 2477 | 2404 | 596.7 |
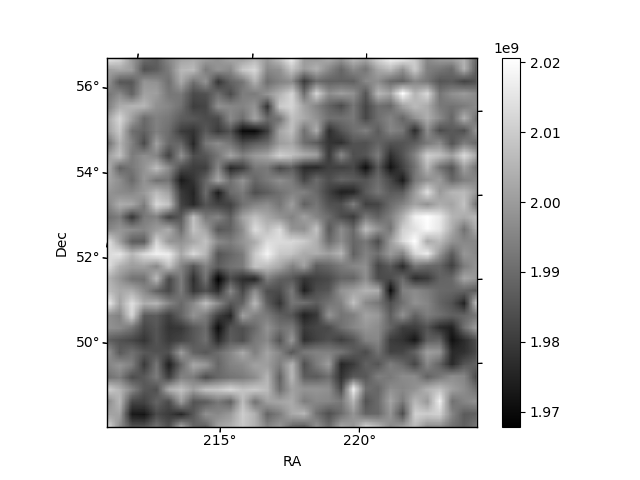
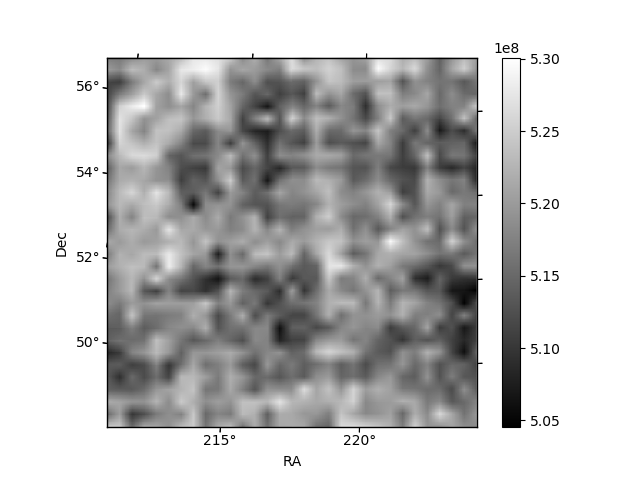
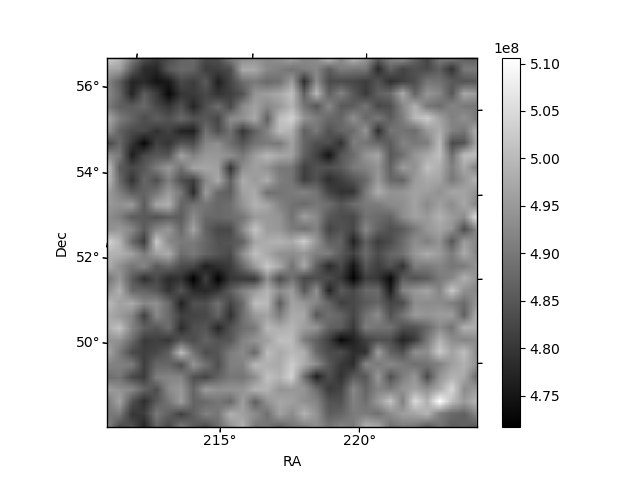
Histogram calculated using DETX and DETY for each event in the final _common_clean file
| Quadrant A | 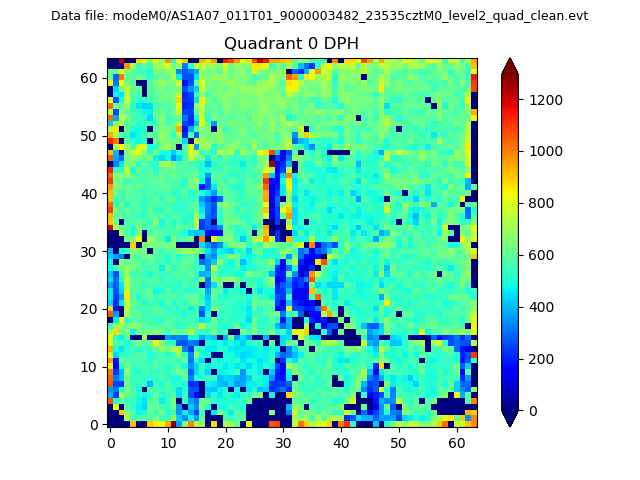 |
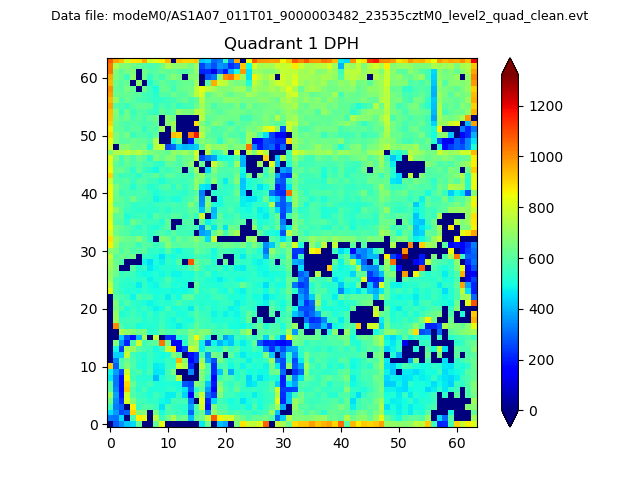 |
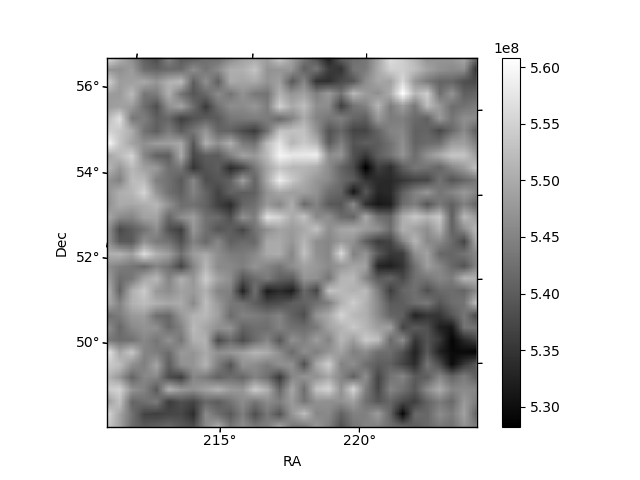
Quadrant B |
|---|---|---|---|
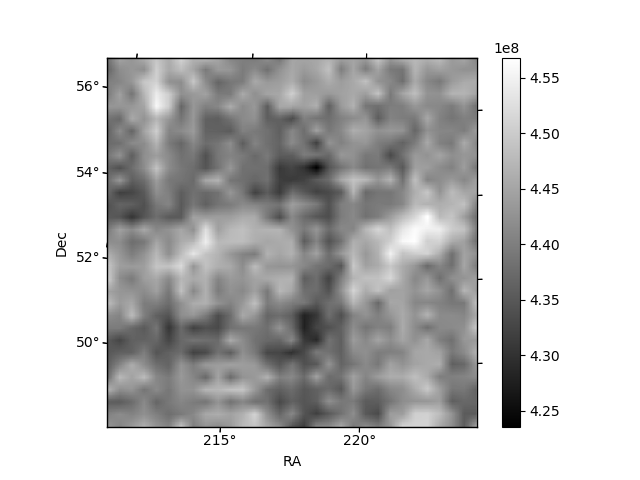
| Quadrant D | 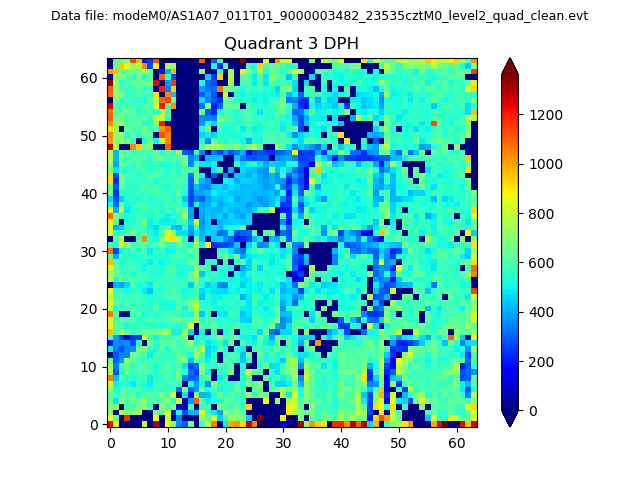 |
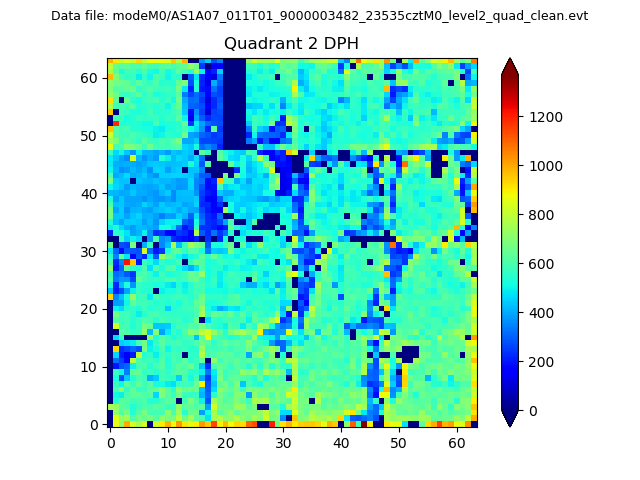 |
Quadrant C |
| Plot type | Count rate plots | Images |
|---|---|---|
| Comparison with Poisson distribution Blue bars denote a histogram of data divided into 1 sec bins. Red curve is a Poisson curve with rate = median count rate of data. |
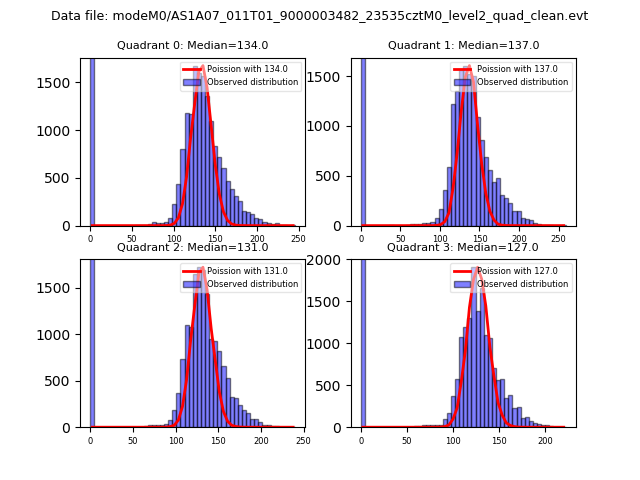 |
 |
| Quadrant-wise count rates Data is divided into 100 sec bins |
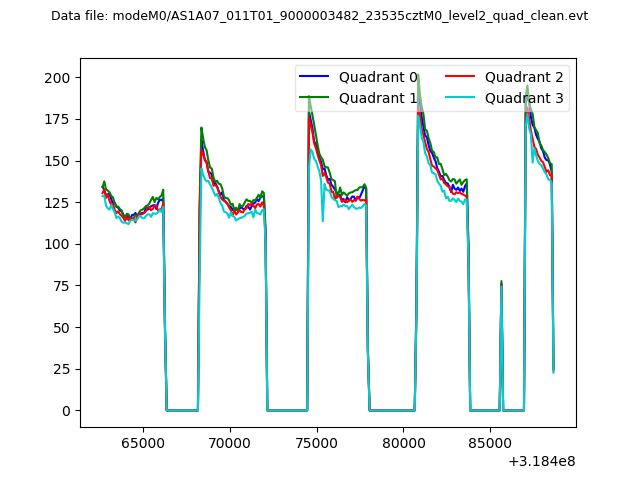 |
|
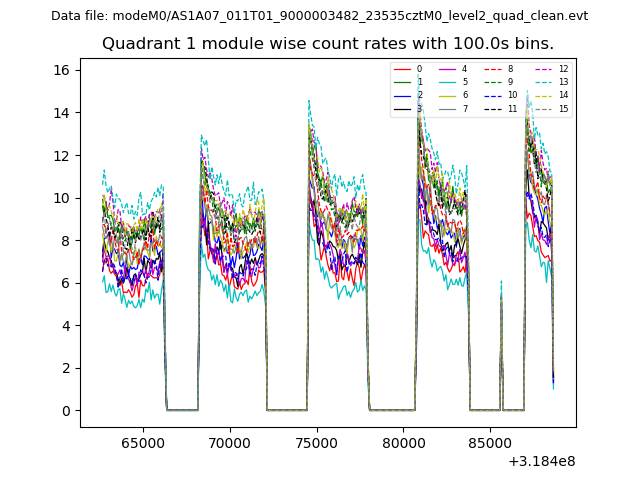
| Module-wise count rates for Quadrant A Data is divided into 100 sec bins |
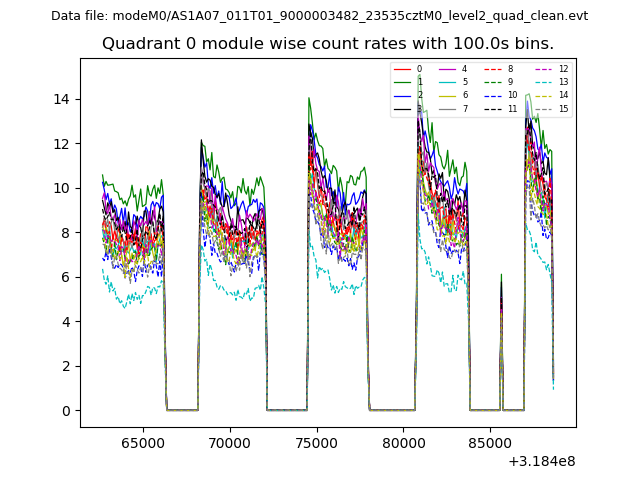 |
 |
| Module-wise count rates for Quadrant B Data is divided into 100 sec bins |
 |
 |
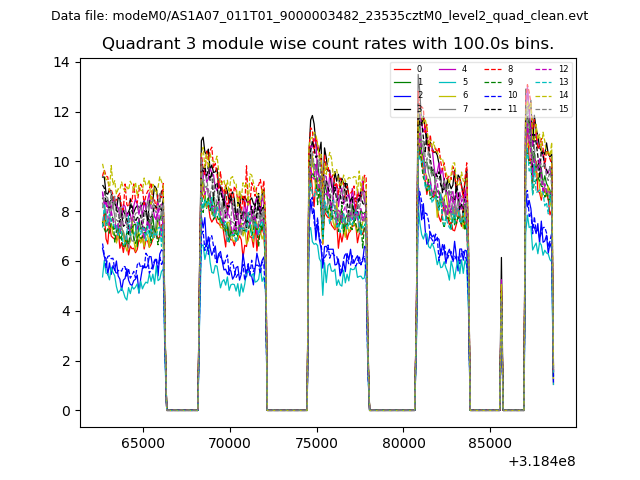
| Module-wise count rates for Quadrant C Data is divided into 100 sec bins |
 |
 |
| Module-wise count rates for Quadrant D Data is divided into 100 sec bins |
 |
 |
| Parameter | Plot |
|---|---|
| CZT HV Monitor |  |
| D_VDD | 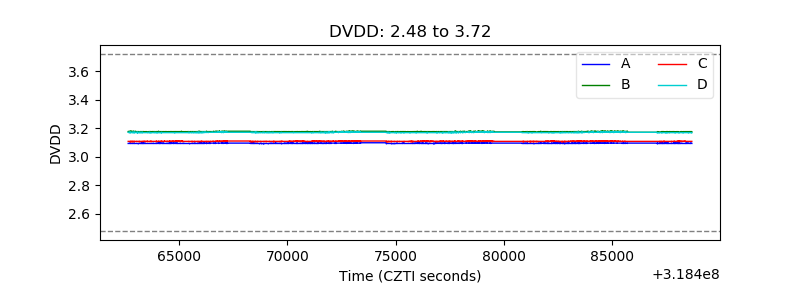 |
| Temperature 1 | 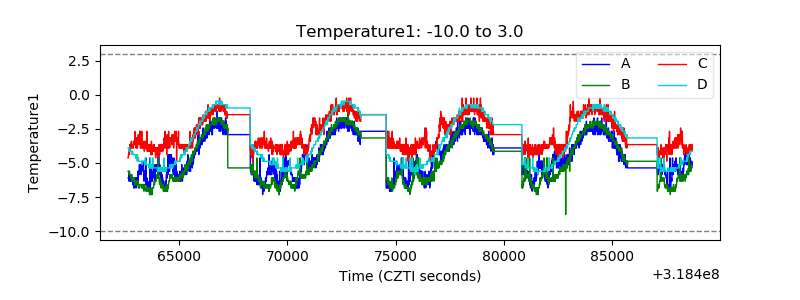 |
| Veto HV Monitor | 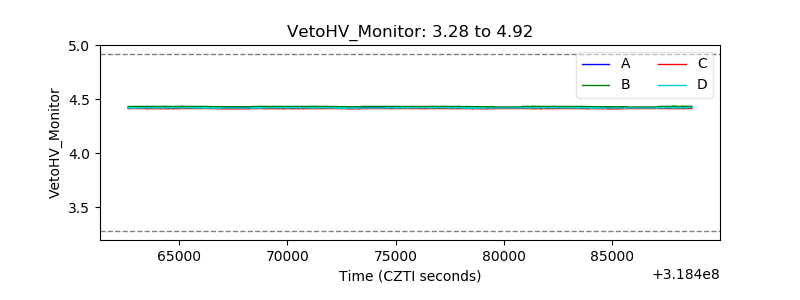 |
| Veto LLD | 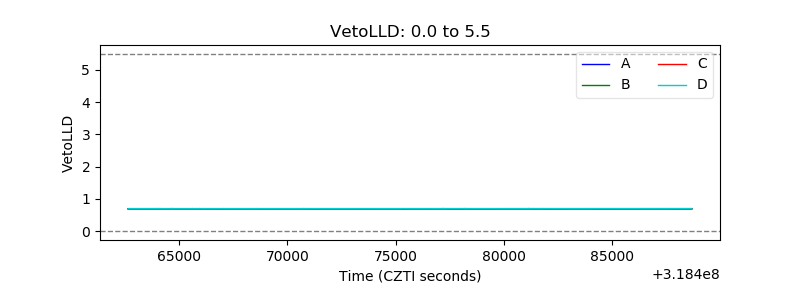 |
| Alpha Counter | 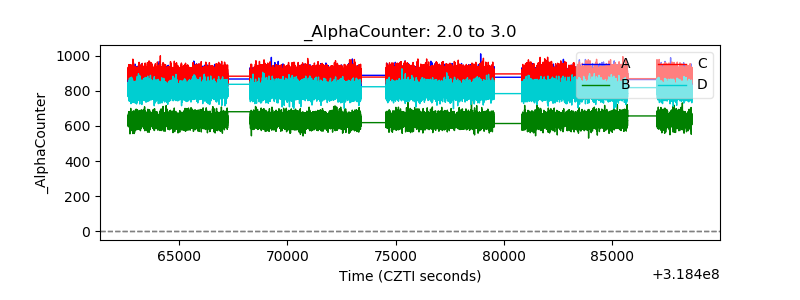 |
| _CPM_Rate | 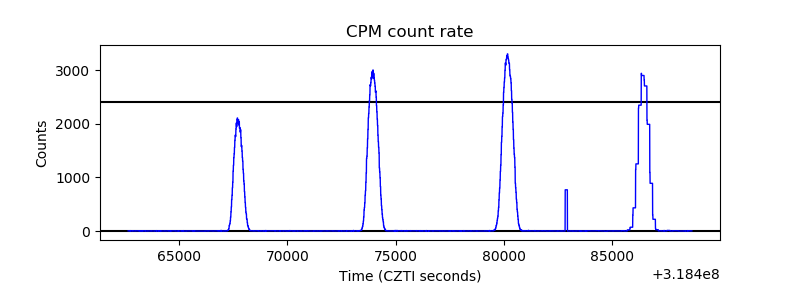 |
| CZT Counter | 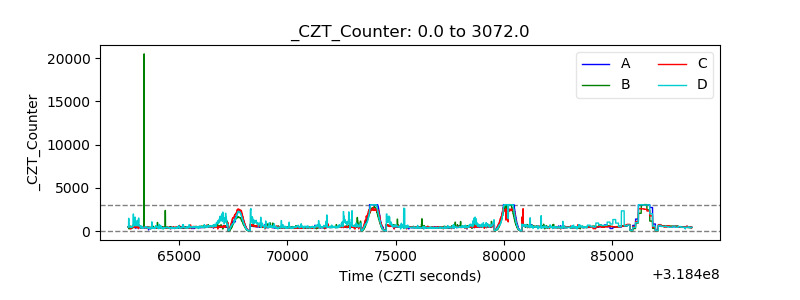 |
| +2.5 Volts monitor |  |
| +5 Volts monitor |  |
| _ROLL_ROT | 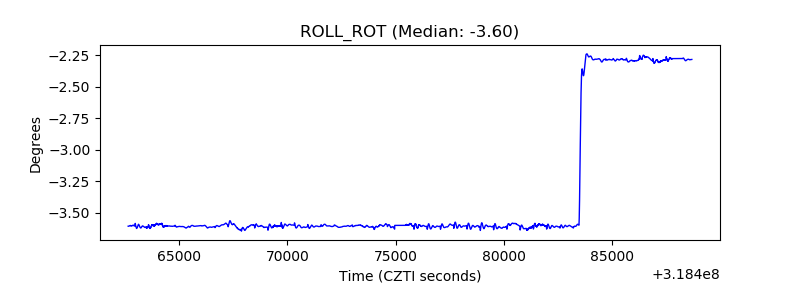 |
| _Roll_DEC | 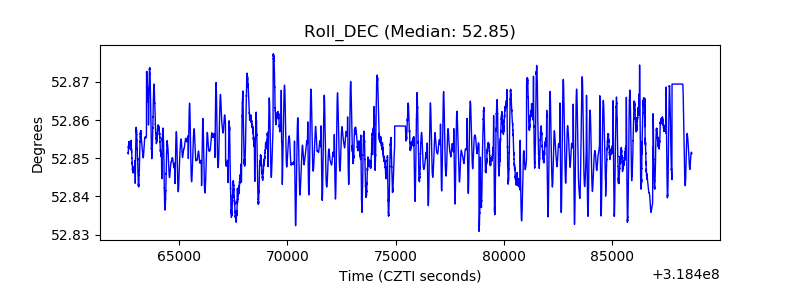 |
| _Roll_RA | 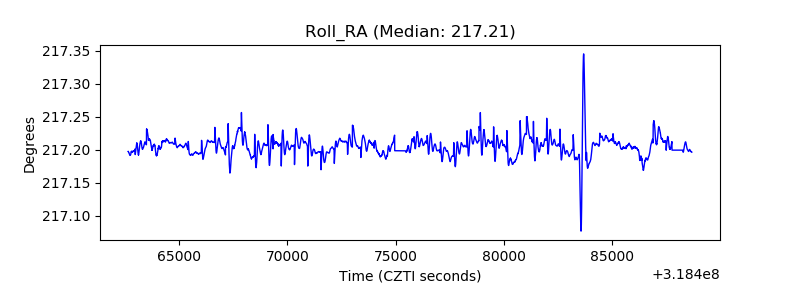 |
| Veto Counter | 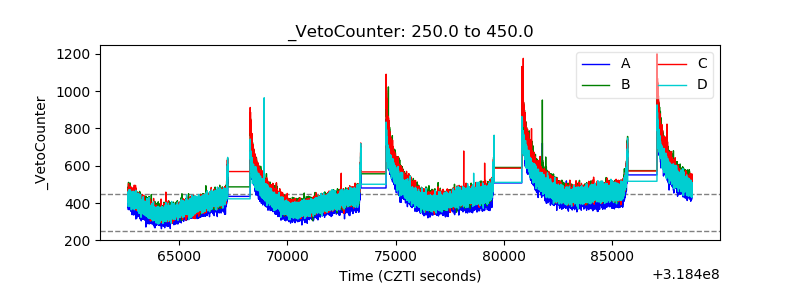 |