| Param | Original file | Final file |
|---|---|---|
| Filename | modeM0/AS1A07_011T01_9000003482_23536cztM0_level2.evt | modeM0/AS1A07_011T01_9000003482_23536cztM0_level2_quad_clean.evt |
| Size (bytes) | 457,669,440 | 106,436,160 |
| Size | 436.5 MB | 101.5 MB |
| Events in quadrant A | 3,229,927 | 712,190 |
| Events in quadrant B | 3,479,695 | 720,854 |
| Events in quadrant C | 3,233,678 | 678,854 |
| Events in quadrant D | 3,482,801 | 665,529 |
| Mode M9 | |||
|---|---|---|---|
| Quadrant | BADHDUFLAG | Total packets | Discarded packets |
| A | 0 | 17 | 0 |
| B | 0 | 17 | 0 |
| C | 0 | 18 | 0 |
| D | 0 | 18 | 0 |
| Mode SS | |||
|---|---|---|---|
| Quadrant | BADHDUFLAG | Total packets | Discarded packets |
| A | 0 | 130 | 0 |
| B | 0 | 130 | 0 |
| C | 0 | 130 | 0 |
| D | 0 | 130 | 0 |
| Mode M0 | |||
|---|---|---|---|
| Quadrant | BADHDUFLAG | Total packets | Discarded packets |
| A | 0 | 13331 | 2 |
| B | 0 | 14159 | 2 |
| C | 0 | 13434 | 2 |
| D | 0 | 14512 | 2 |
| Quadrant | Total seconds | Saturated seconds | Saturation percentage |
|---|---|---|---|
| A | 6395 | 33 | 0.516028% |
| B | 6395 | 72 | 1.125880% |
| C | 6395 | 70 | 1.094605% |
| D | 6395 | 51 | 0.797498% |
Noise dominated data is calculated using 1-second bins in cleaned event files. If a bin has >2000 counts, and if more than 50% of those come from <1% of pixels, then it is considered to be noise-dominated and hence unusable.
| Quadrant | # 1 sec bins | Bins with >0 counts | Bins with >2000 counts | High rate bins dominated by noise | Noise dominated (total time) | Noise dominated (detector-on time) | Marked lightcurve |
|---|---|---|---|---|---|---|---|
| A | 7760 | 6396 | 0 | 0 | 0.00% | 0.00% | 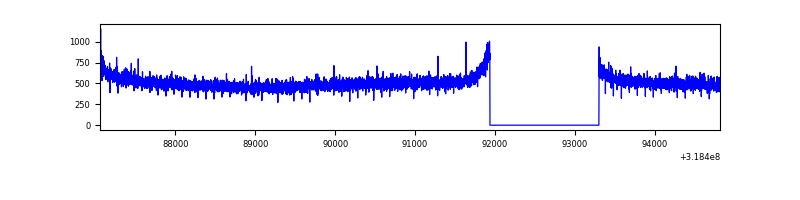 |
| B | 7760 | 6396 | 12 | 12 | 0.15% | 0.19% | 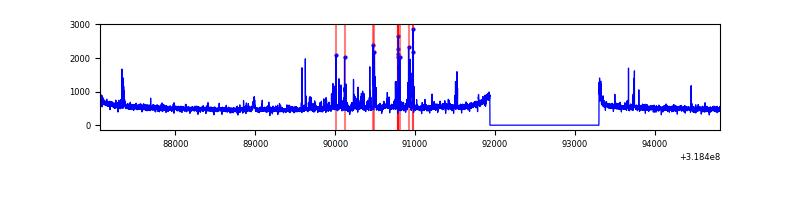 |
| C | 7760 | 6396 | 0 | 0 | 0.00% | 0.00% | 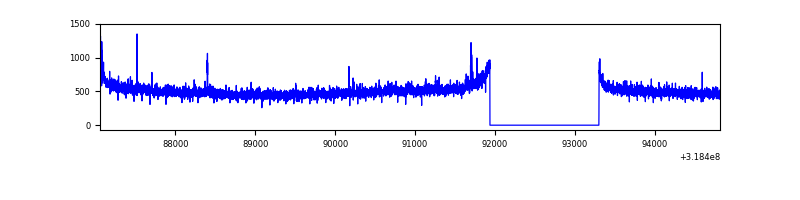 |
| D | 7760 | 6396 | 39 | 39 | 0.50% | 0.61% | 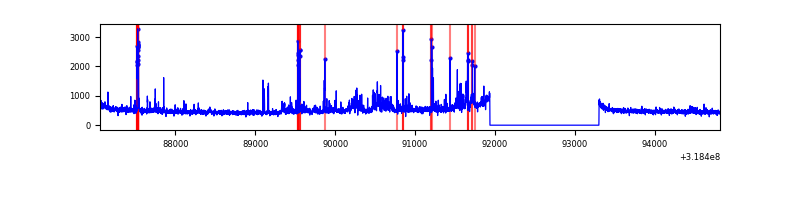 |
Top three noisy pixels from each quadrant. If the there are fewer than three noisy pixels in the level2.evt file, extra rows are filled as -1
| Pixel properties | Quadrant properties | ||||||
|---|---|---|---|---|---|---|---|
| Quadrant | DetID | PixID | Counts | Sigma | Mean | Median | Sigma |
| A | 13 | 254 | 11118 | 62.13 | 837 | 822 | 165.7 |
| A | 0 | 226 | 7276 | 38.95 | 837 | 822 | 165.7 |
| A | 3 | 137 | 6737 | 35.69 | 837 | 822 | 165.7 |
| B | 0 | 189 | 162933 | 1062.0 | 825 | 808 | 152.7 |
| B | 3 | 64 | 24802 | 157.17 | 825 | 808 | 152.7 |
| B | 12 | 111 | 17774 | 111.14 | 825 | 808 | 152.7 |
| C | 14 | 238 | 129356 | 715.0 | 784 | 790 | 179.8 |
| C | 7 | 247 | 30473 | 165.08 | 784 | 790 | 179.8 |
| C | 0 | 10 | 9140 | 46.44 | 784 | 790 | 179.8 |
| D | 1 | 52 | 249099 | 1294.34 | 797 | 774 | 191.9 |
| D | 9 | 85 | 114926 | 594.99 | 797 | 774 | 191.9 |
| D | 7 | 38 | 40659 | 207.89 | 797 | 774 | 191.9 |
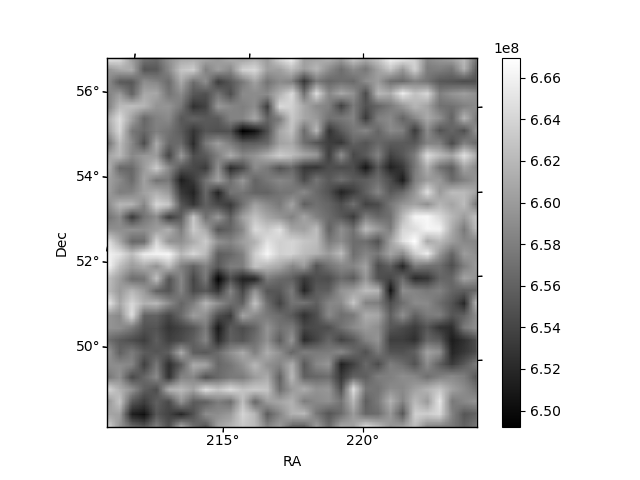
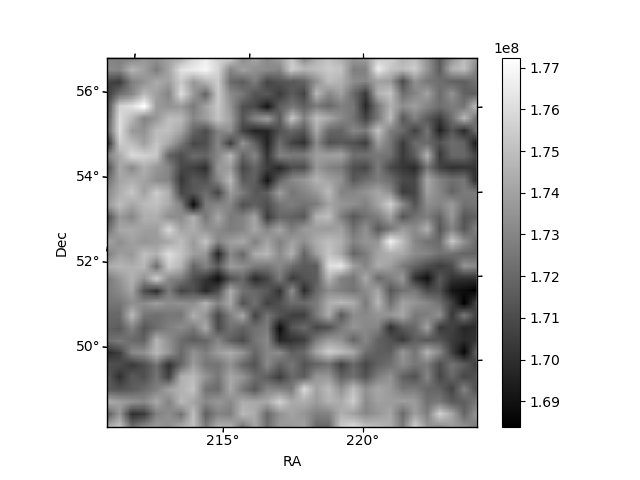
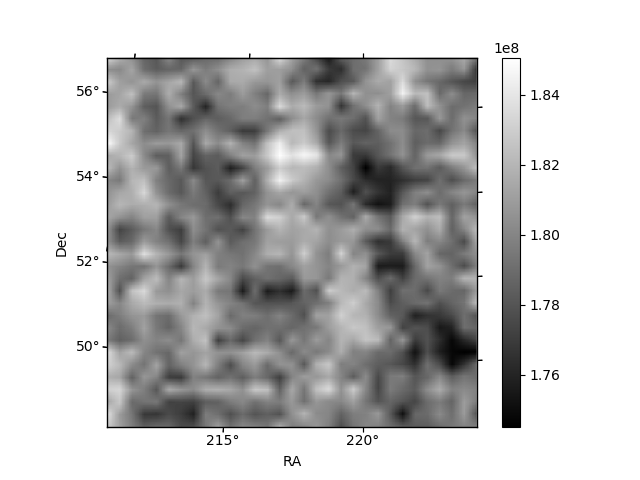
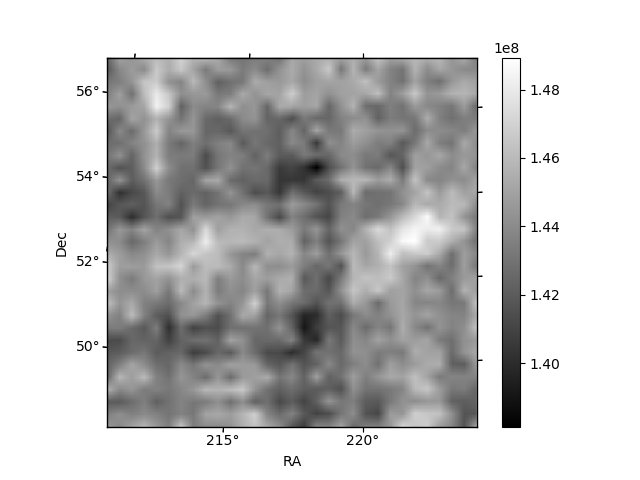
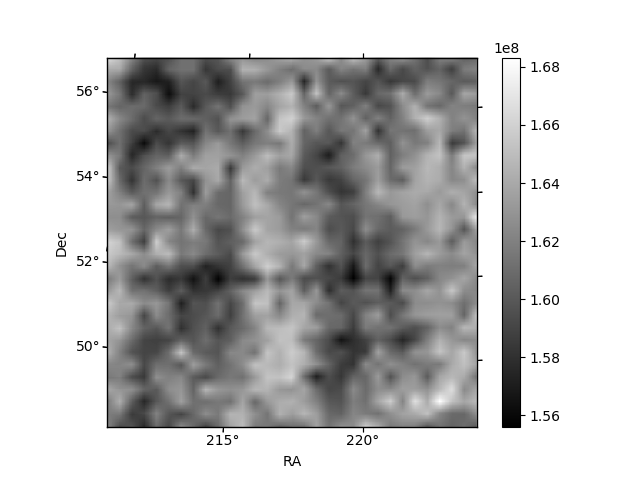
Histogram calculated using DETX and DETY for each event in the final _common_clean file
| Quadrant A | 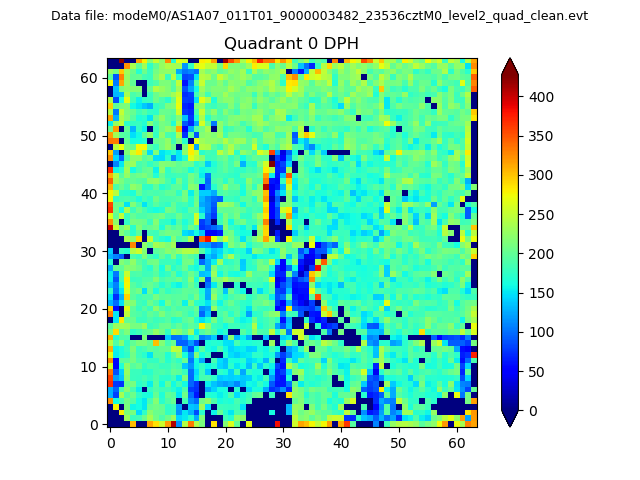 |
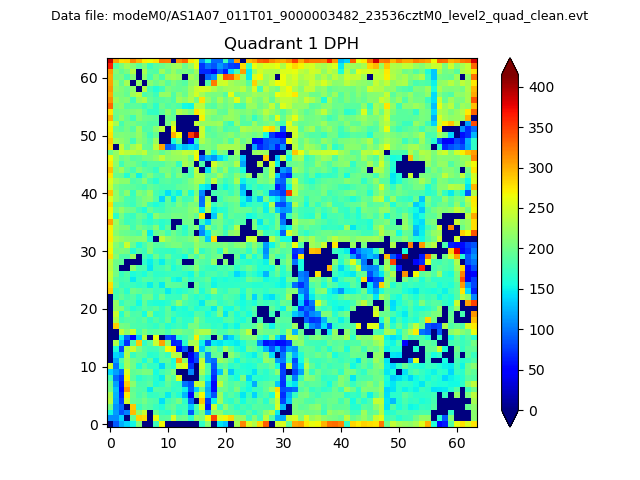 |
Quadrant B |
|---|---|---|---|
| Quadrant D | 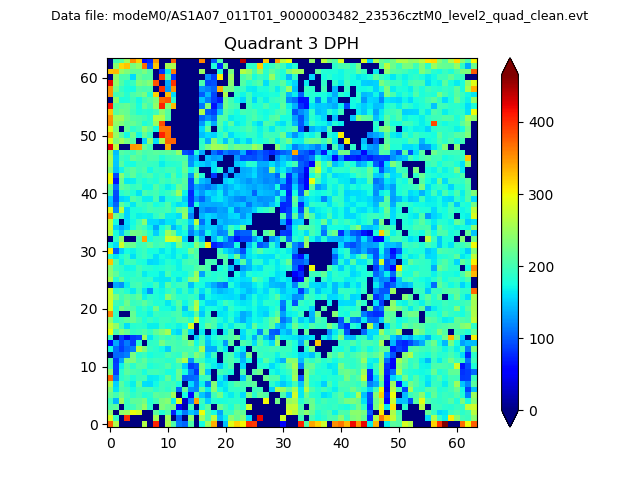 |
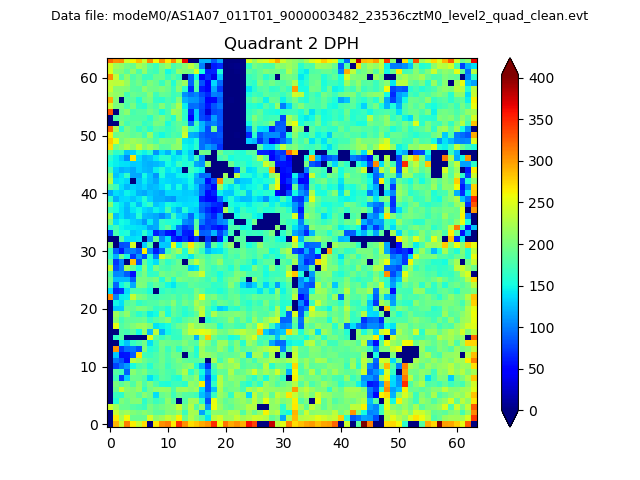 |
Quadrant C |
| Plot type | Count rate plots | Images |
|---|---|---|
| Comparison with Poisson distribution Blue bars denote a histogram of data divided into 1 sec bins. Red curve is a Poisson curve with rate = median count rate of data. |
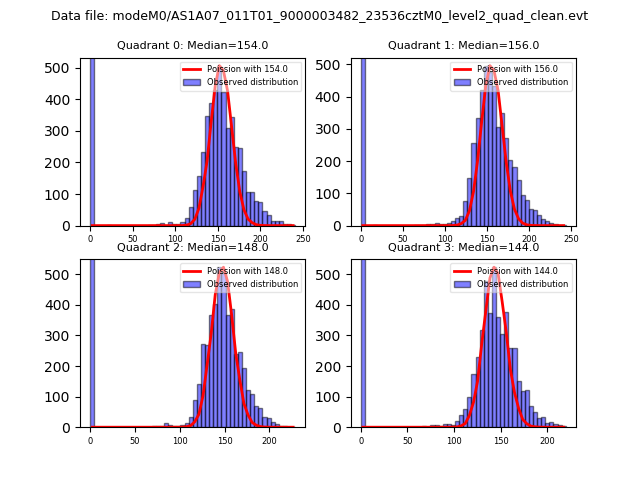 |
 |
| Quadrant-wise count rates Data is divided into 100 sec bins |
 |
|
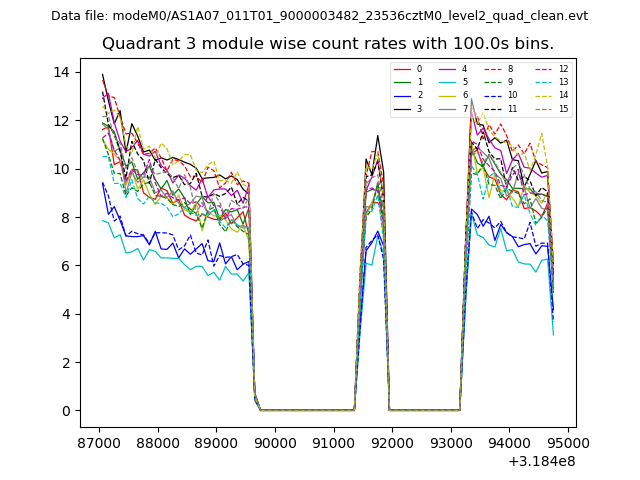
| Module-wise count rates for Quadrant A Data is divided into 100 sec bins |
 |
 |
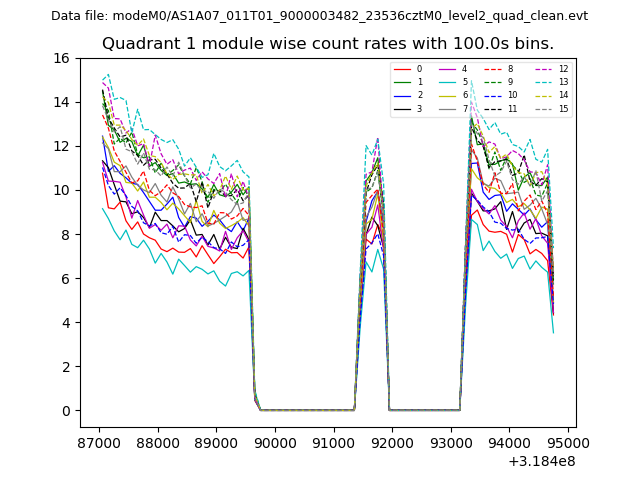
| Module-wise count rates for Quadrant B Data is divided into 100 sec bins |
 |
 |
| Module-wise count rates for Quadrant C Data is divided into 100 sec bins |
 |
 |
| Module-wise count rates for Quadrant D Data is divided into 100 sec bins |
 |
 |
| Parameter | Plot |
|---|---|
| CZT HV Monitor | 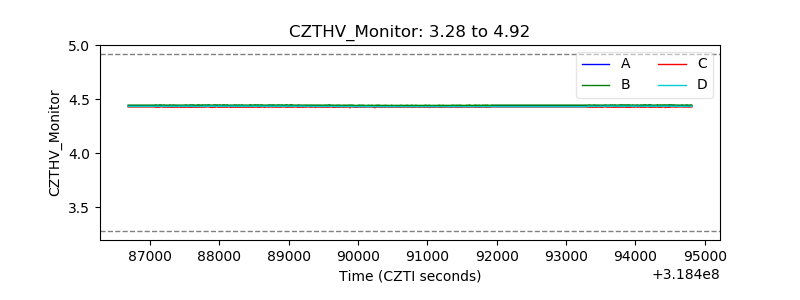 |
| D_VDD | 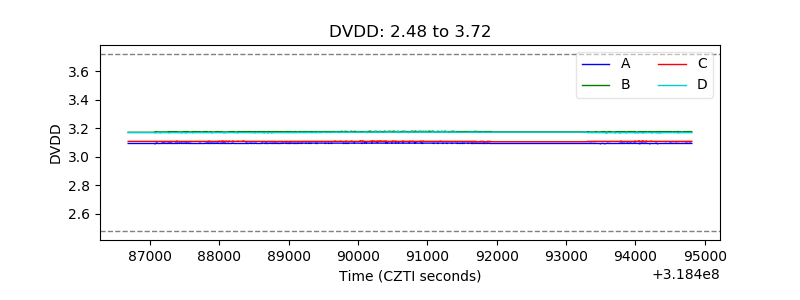 |
| Temperature 1 | 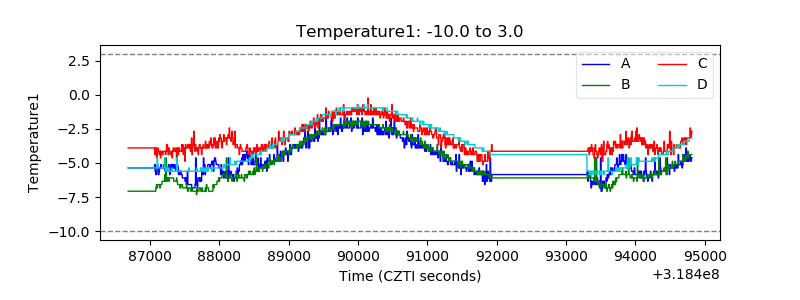 |
| Veto HV Monitor |  |
| Veto LLD | 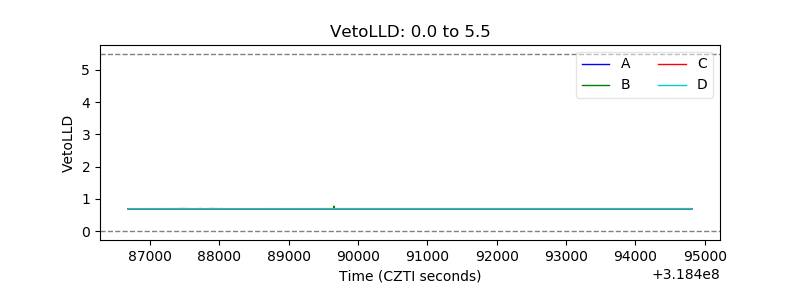 |
| Alpha Counter | 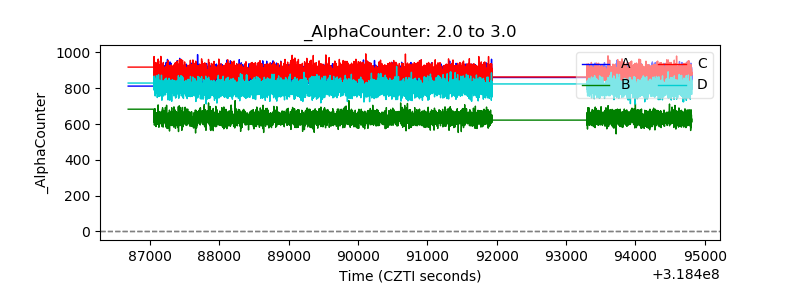 |
| _CPM_Rate | 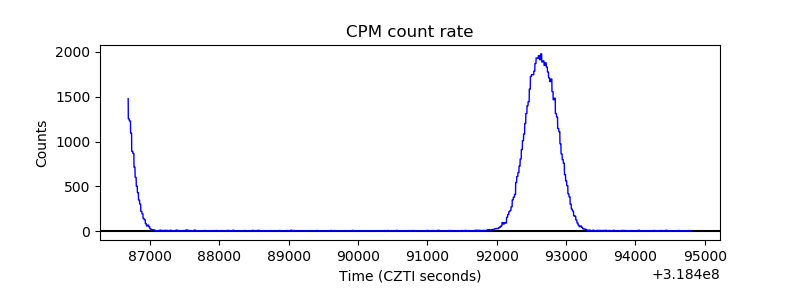 |
| CZT Counter | 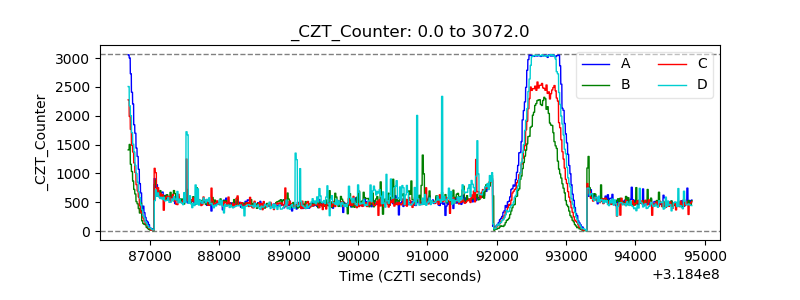 |
| +2.5 Volts monitor |  |
| +5 Volts monitor |  |
| _ROLL_ROT | 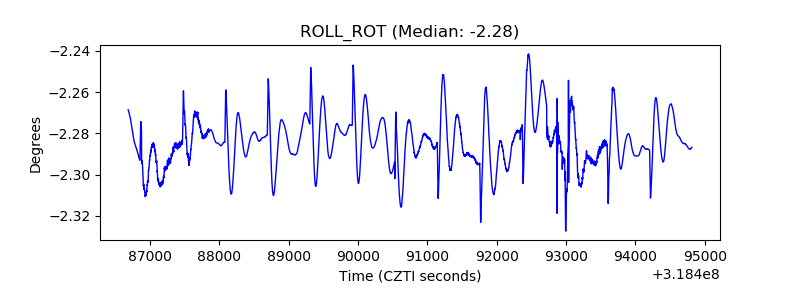 |
| _Roll_DEC | 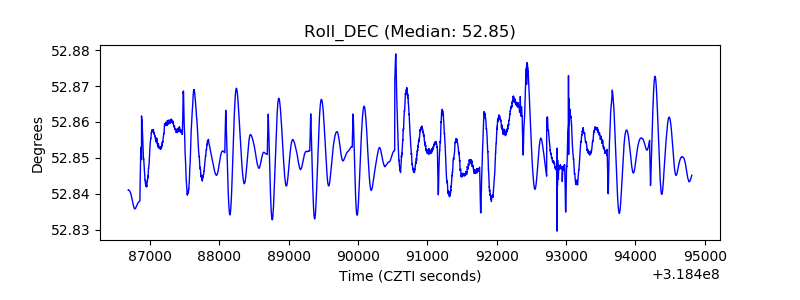 |
| _Roll_RA | 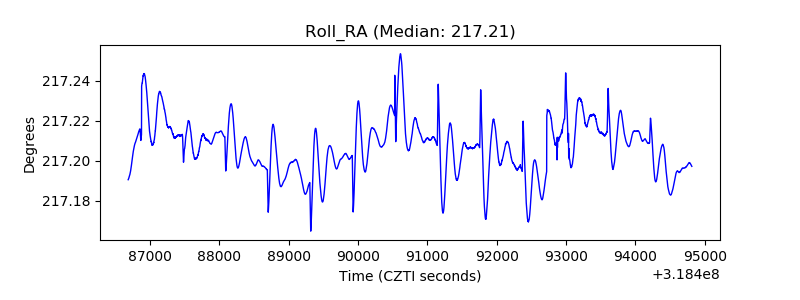 |
| Veto Counter | 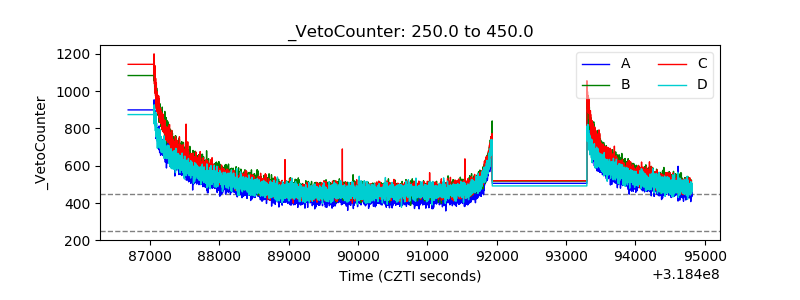 |