| Param | Original file | Final file |
|---|---|---|
| Filename | modeM0/AS1A07_011T01_9000003482_23537cztM0_level2.evt | modeM0/AS1A07_011T01_9000003482_23537cztM0_level2_quad_clean.evt |
| Size (bytes) | 426,862,080 | 86,662,080 |
| Size | 407.1 MB | 82.6 MB |
| Events in quadrant A | 2,834,037 | 570,948 |
| Events in quadrant B | 3,042,965 | 573,902 |
| Events in quadrant C | 2,794,955 | 546,245 |
| Events in quadrant D | 3,866,713 | 533,275 |
| Mode M9 | |||
|---|---|---|---|
| Quadrant | BADHDUFLAG | Total packets | Discarded packets |
| A | 0 | 13 | 0 |
| B | 0 | 13 | 0 |
| C | 0 | 13 | 0 |
| D | 0 | 13 | 0 |
| Mode SS | |||
|---|---|---|---|
| Quadrant | BADHDUFLAG | Total packets | Discarded packets |
| A | 0 | 116 | 0 |
| B | 0 | 116 | 0 |
| C | 0 | 116 | 0 |
| D | 0 | 116 | 0 |
| Mode M0 | |||
|---|---|---|---|
| Quadrant | BADHDUFLAG | Total packets | Discarded packets |
| A | 0 | 11767 | 1 |
| B | 0 | 12426 | 1 |
| C | 0 | 11788 | 1 |
| D | 0 | 15287 | 1 |
| Quadrant | Total seconds | Saturated seconds | Saturation percentage |
|---|---|---|---|
| A | 5722 | 57 | 0.996155% |
| B | 5722 | 93 | 1.625306% |
| C | 5722 | 67 | 1.170919% |
| D | 5723 | 167 | 2.918050% |
Noise dominated data is calculated using 1-second bins in cleaned event files. If a bin has >2000 counts, and if more than 50% of those come from <1% of pixels, then it is considered to be noise-dominated and hence unusable.
| Quadrant | # 1 sec bins | Bins with >0 counts | Bins with >2000 counts | High rate bins dominated by noise | Noise dominated (total time) | Noise dominated (detector-on time) | Marked lightcurve |
|---|---|---|---|---|---|---|---|
| A | 6987 | 5722 | 0 | 0 | 0.00% | 0.00% | 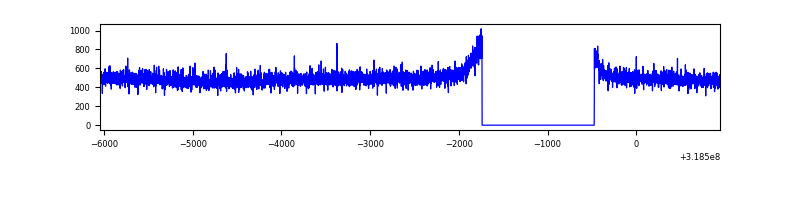 |
| B | 6987 | 5722 | 11 | 11 | 0.16% | 0.19% | 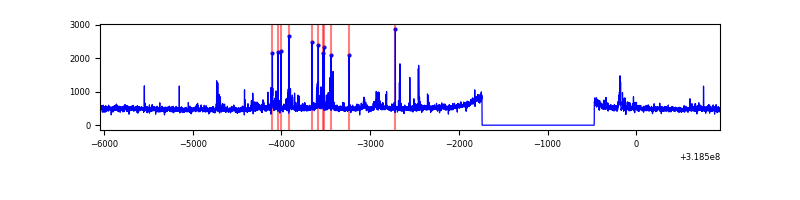 |
| C | 6987 | 5723 | 0 | 0 | 0.00% | 0.00% | 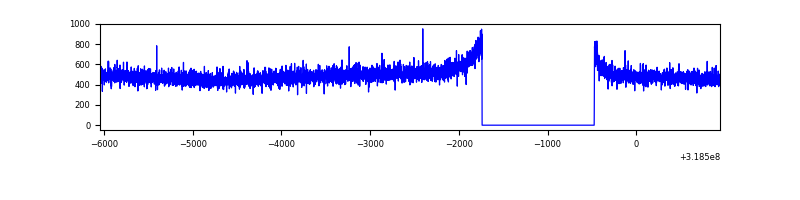 |
| D | 6988 | 5724 | 105 | 105 | 1.50% | 1.83% | 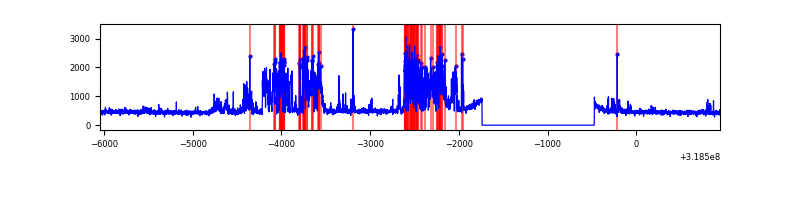 |
Top three noisy pixels from each quadrant. If the there are fewer than three noisy pixels in the level2.evt file, extra rows are filled as -1
| Pixel properties | Quadrant properties | ||||||
|---|---|---|---|---|---|---|---|
| Quadrant | DetID | PixID | Counts | Sigma | Mean | Median | Sigma |
| A | 13 | 254 | 9956 | 62.72 | 735 | 720 | 147.2 |
| A | 0 | 226 | 6334 | 38.13 | 735 | 720 | 147.2 |
| A | 3 | 137 | 5984 | 35.75 | 735 | 720 | 147.2 |
| B | 0 | 189 | 97000 | 711.74 | 719 | 703 | 135.3 |
| B | 3 | 64 | 28221 | 203.39 | 719 | 703 | 135.3 |
| B | 15 | 32 | 27314 | 196.69 | 719 | 703 | 135.3 |
| C | 14 | 238 | 111589 | 700.06 | 687 | 691 | 158.4 |
| C | 7 | 247 | 4940 | 26.82 | 687 | 691 | 158.4 |
| C | 13 | 61 | 4783 | 25.83 | 687 | 691 | 158.4 |
| D | 9 | 85 | 1080352 | 6464.44 | 701 | 681 | 167.0 |
| D | 1 | 52 | 79978 | 474.78 | 701 | 681 | 167.0 |
| D | 12 | 233 | 25613 | 149.28 | 701 | 681 | 167.0 |
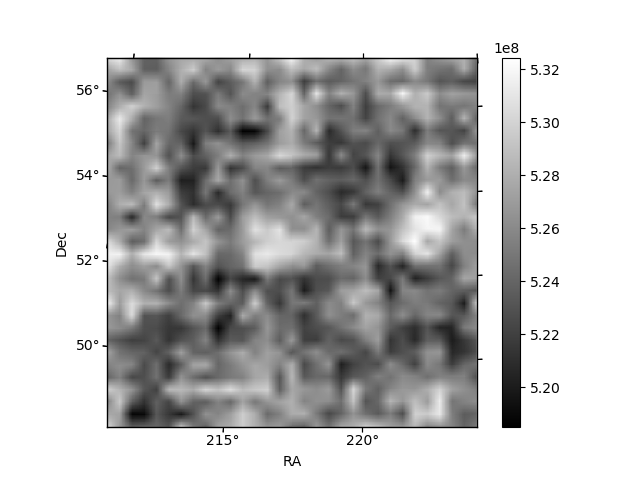
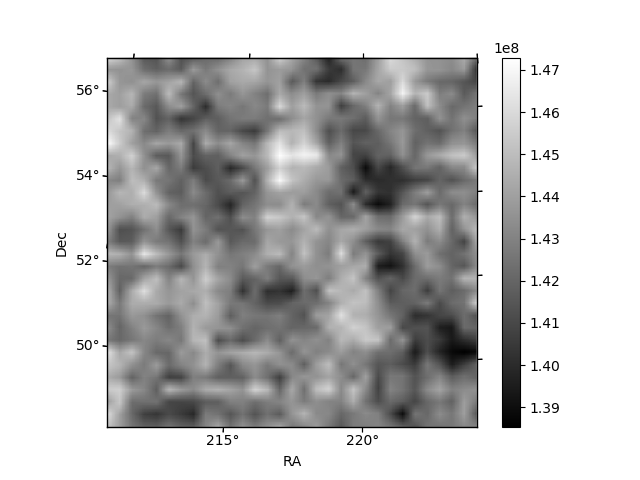
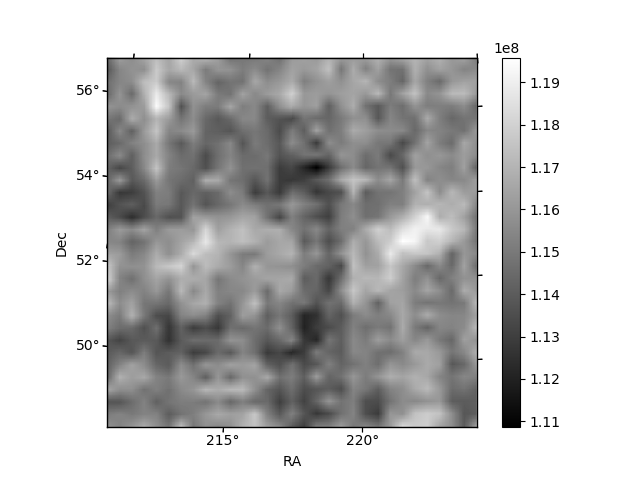
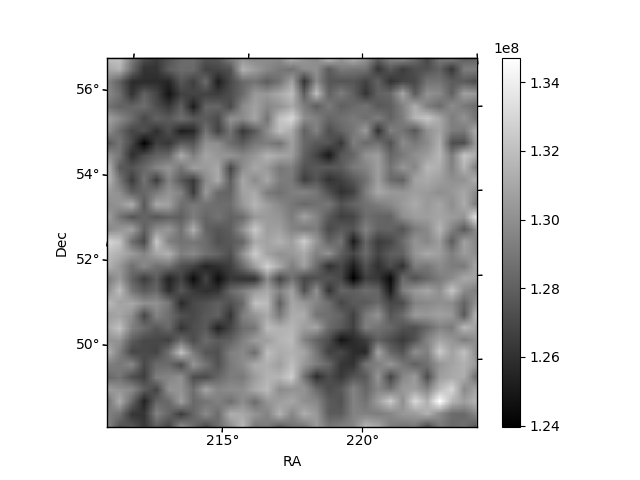
Histogram calculated using DETX and DETY for each event in the final _common_clean file
| Quadrant A | 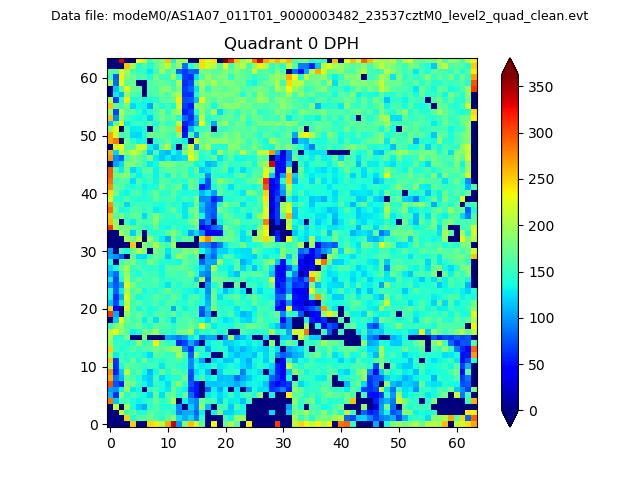 |
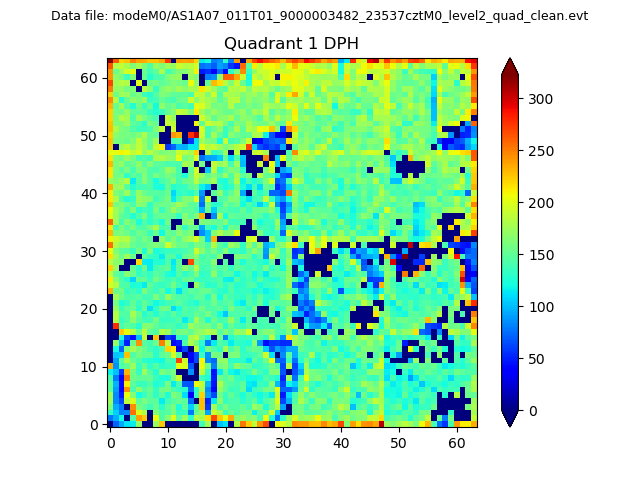 |
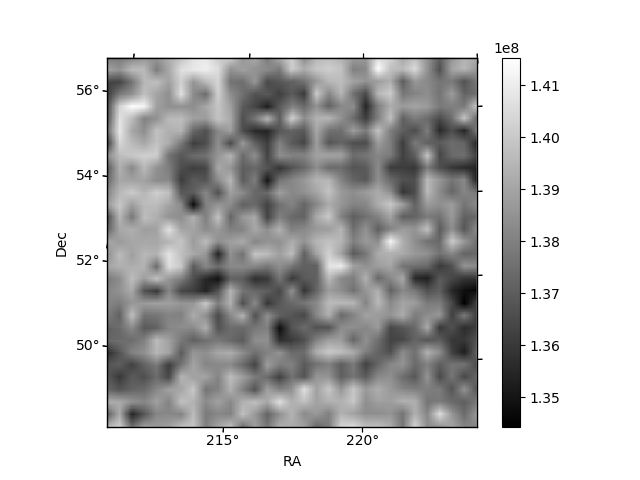
Quadrant B |
|---|---|---|---|
| Quadrant D | 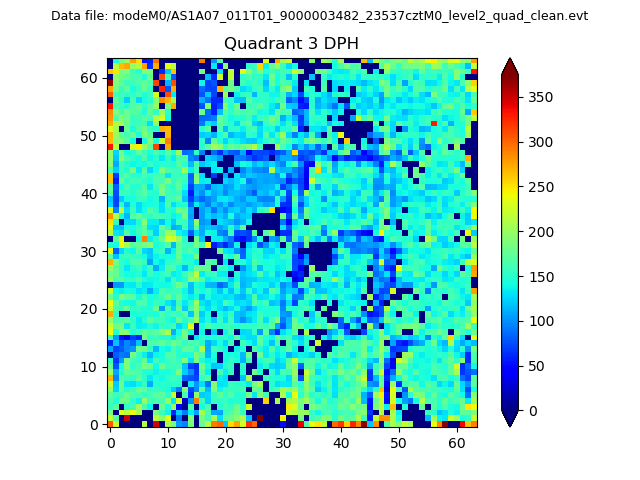 |
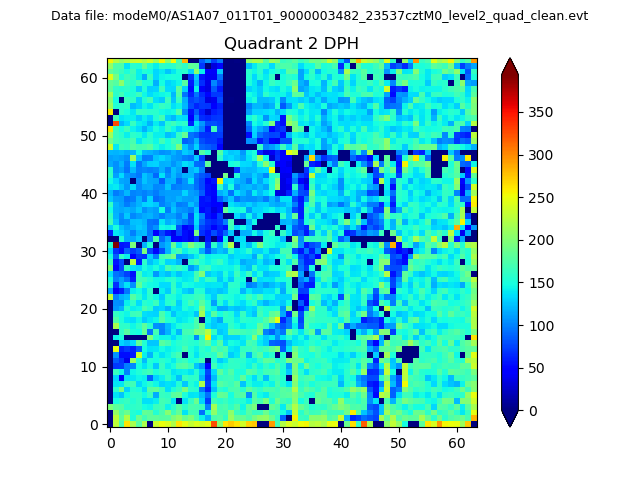 |
Quadrant C |
| Plot type | Count rate plots | Images |
|---|---|---|
| Comparison with Poisson distribution Blue bars denote a histogram of data divided into 1 sec bins. Red curve is a Poisson curve with rate = median count rate of data. |
 |
 |
| Quadrant-wise count rates Data is divided into 100 sec bins |
 |
|
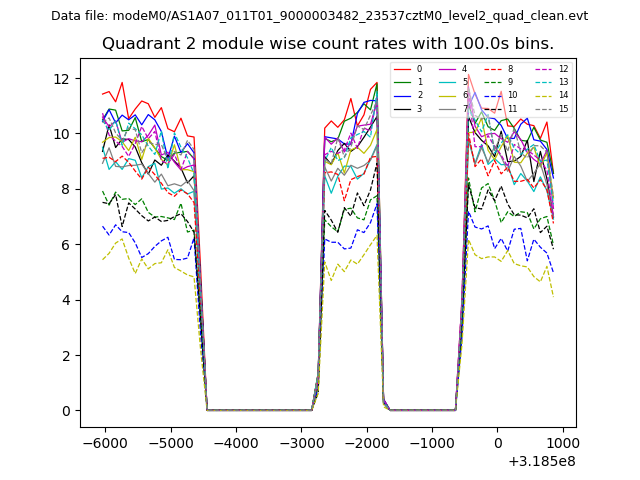
| Module-wise count rates for Quadrant A Data is divided into 100 sec bins |
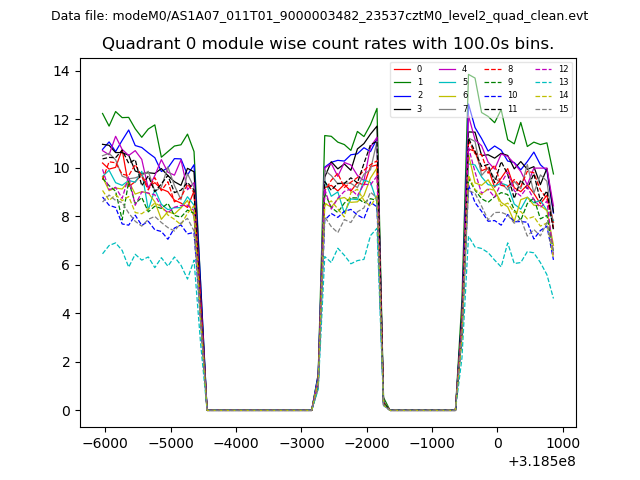 |
 |
| Module-wise count rates for Quadrant B Data is divided into 100 sec bins |
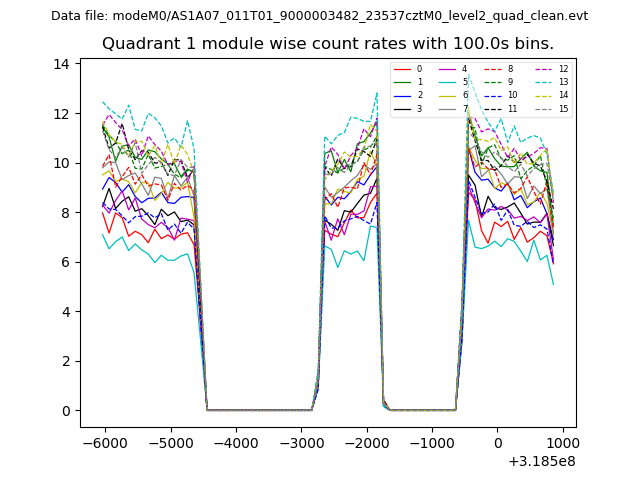 |
 |
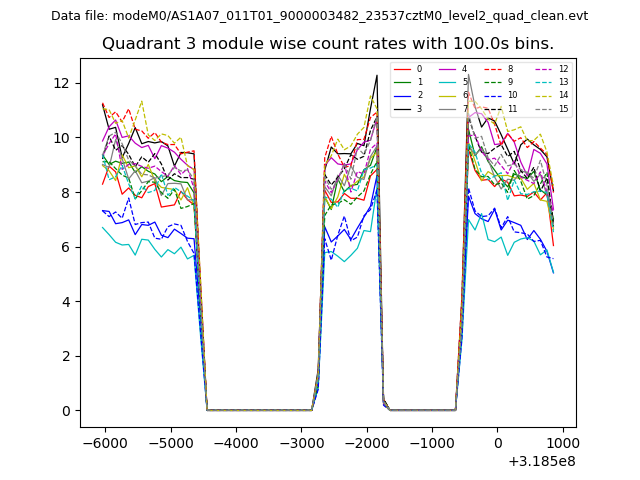
| Module-wise count rates for Quadrant C Data is divided into 100 sec bins |
 |
 |
| Module-wise count rates for Quadrant D Data is divided into 100 sec bins |
 |
 |
| Parameter | Plot |
|---|---|
| CZT HV Monitor |  |
| D_VDD | 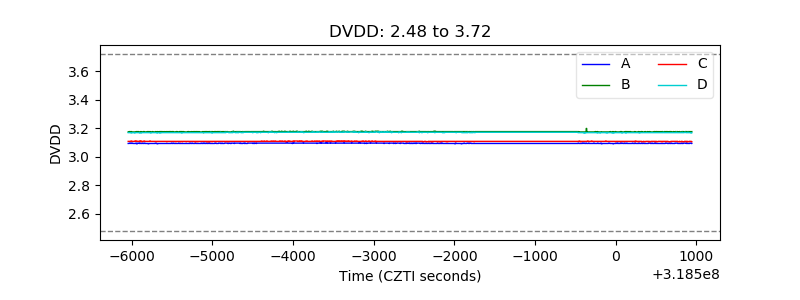 |
| Temperature 1 | 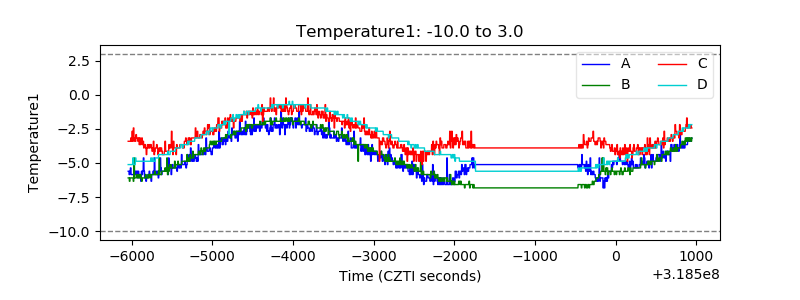 |
| Veto HV Monitor | 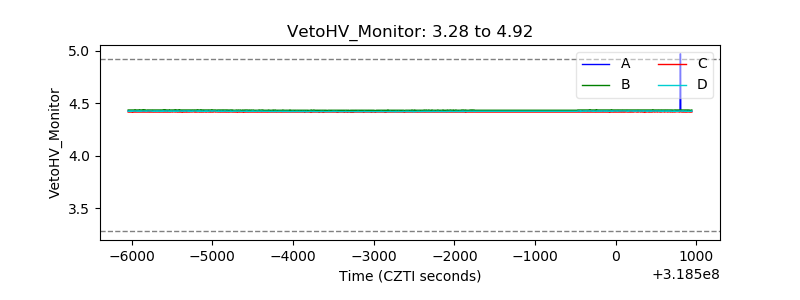 |
| Veto LLD | 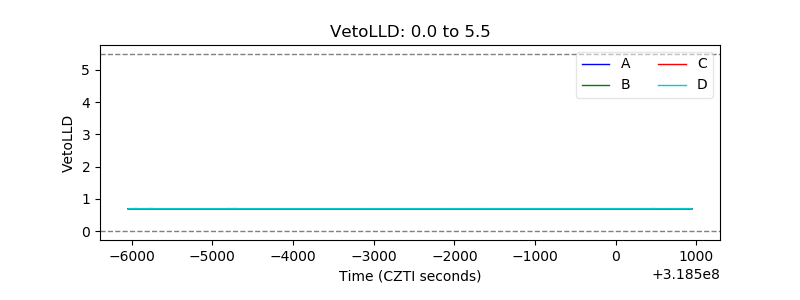 |
| Alpha Counter | 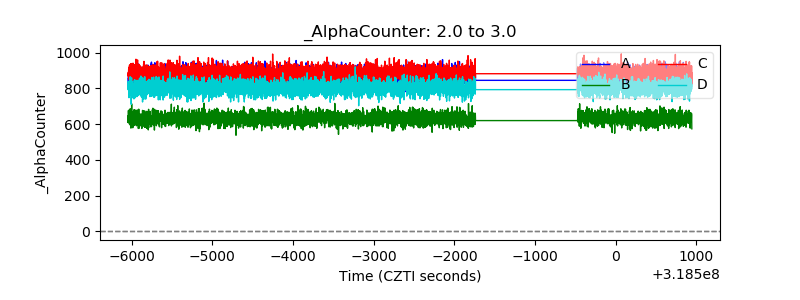 |
| _CPM_Rate | 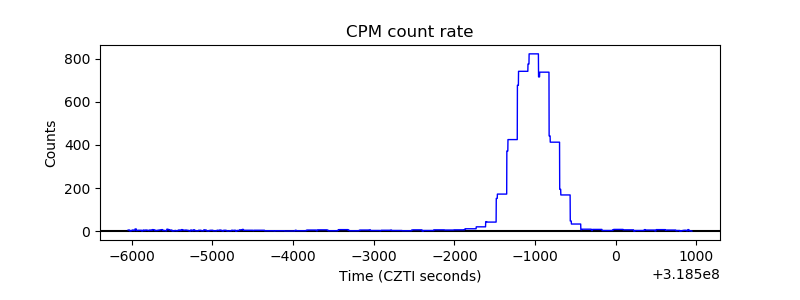 |
| CZT Counter | 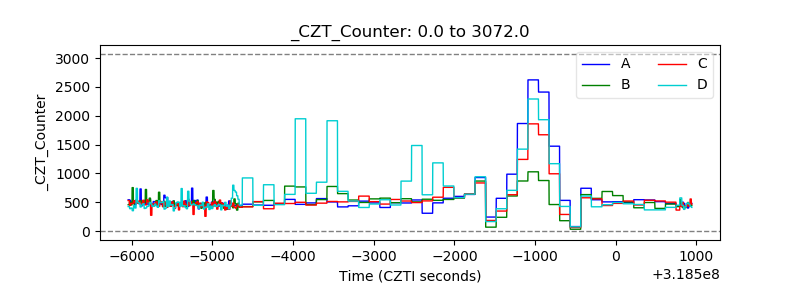 |
| +2.5 Volts monitor | 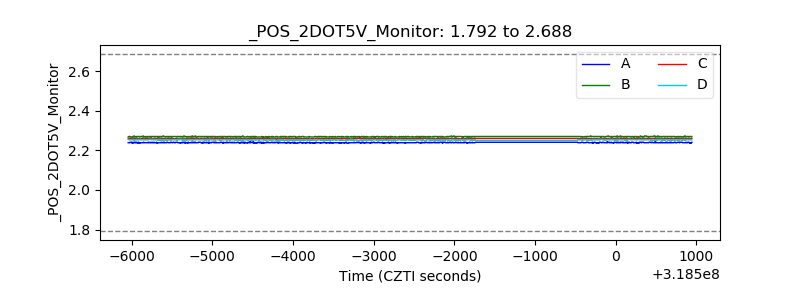 |
| +5 Volts monitor |  |
| _ROLL_ROT | 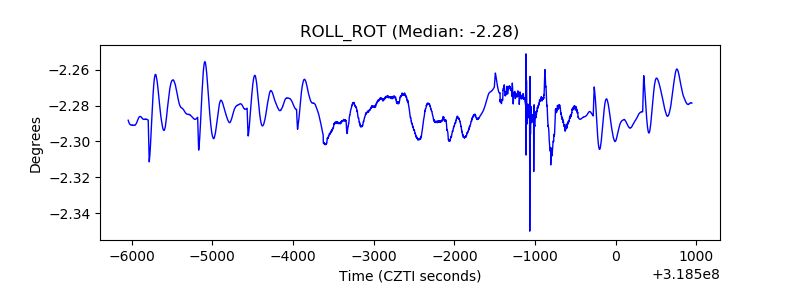 |
| _Roll_DEC | 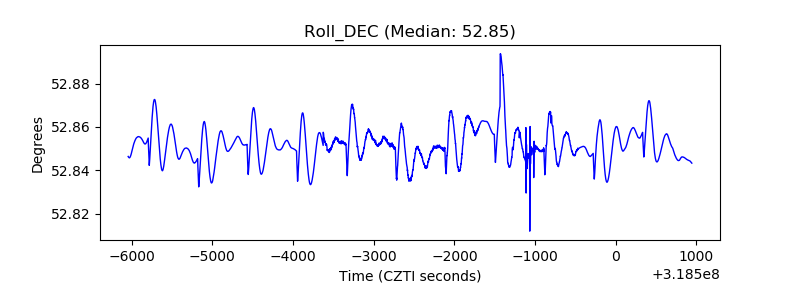 |
| _Roll_RA | 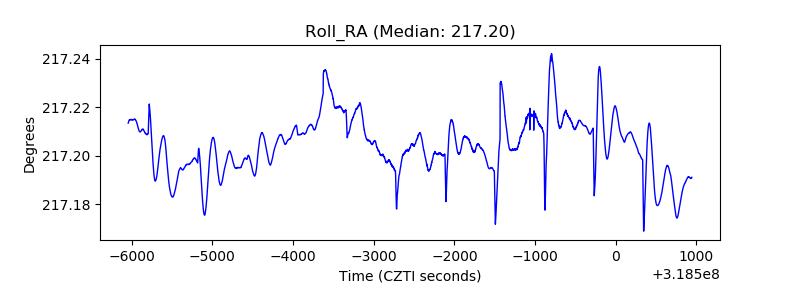 |
| Veto Counter | 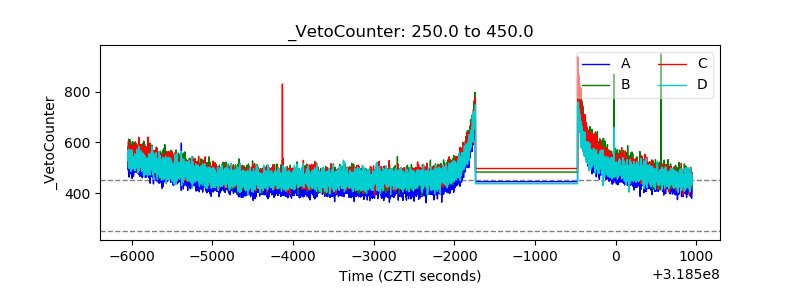 |