| Param | Original file | Final file |
|---|---|---|
| Filename | modeM0/AS1A07_011T01_9000003482_23538cztM0_level2.evt | modeM0/AS1A07_011T01_9000003482_23538cztM0_level2_quad_clean.evt |
| Size (bytes) | 421,611,840 | 89,156,160 |
| Size | 402.1 MB | 85.0 MB |
| Events in quadrant A | 2,907,707 | 581,816 |
| Events in quadrant B | 3,251,102 | 585,877 |
| Events in quadrant C | 2,910,924 | 559,986 |
| Events in quadrant D | 3,285,881 | 548,178 |
| Mode M9 | |||
|---|---|---|---|
| Quadrant | BADHDUFLAG | Total packets | Discarded packets |
| A | 0 | 10 | 0 |
| B | 0 | 10 | 0 |
| C | 0 | 10 | 0 |
| D | 0 | 10 | 0 |
| Mode SS | |||
|---|---|---|---|
| Quadrant | BADHDUFLAG | Total packets | Discarded packets |
| A | 0 | 124 | 0 |
| B | 0 | 124 | 0 |
| C | 0 | 124 | 0 |
| D | 0 | 124 | 0 |
| Mode M0 | |||
|---|---|---|---|
| Quadrant | BADHDUFLAG | Total packets | Discarded packets |
| A | 0 | 12360 | 1 |
| B | 0 | 13320 | 1 |
| C | 0 | 12402 | 1 |
| D | 0 | 13711 | 1 |
| Quadrant | Total seconds | Saturated seconds | Saturation percentage |
|---|---|---|---|
| A | 6070 | 59 | 0.971993% |
| B | 6071 | 94 | 1.548345% |
| C | 6071 | 76 | 1.251853% |
| D | 6071 | 70 | 1.153023% |
Noise dominated data is calculated using 1-second bins in cleaned event files. If a bin has >2000 counts, and if more than 50% of those come from <1% of pixels, then it is considered to be noise-dominated and hence unusable.
| Quadrant | # 1 sec bins | Bins with >0 counts | Bins with >2000 counts | High rate bins dominated by noise | Noise dominated (total time) | Noise dominated (detector-on time) | Marked lightcurve |
|---|---|---|---|---|---|---|---|
| A | 7095 | 6070 | 0 | 0 | 0.00% | 0.00% | 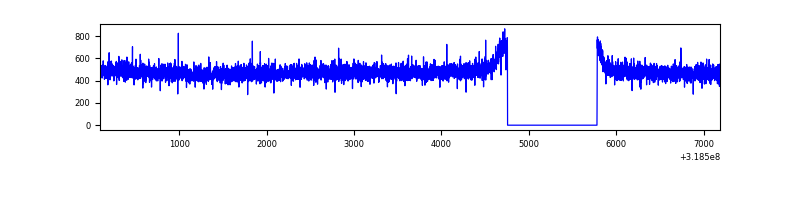 |
| B | 7096 | 6071 | 31 | 31 | 0.44% | 0.51% | 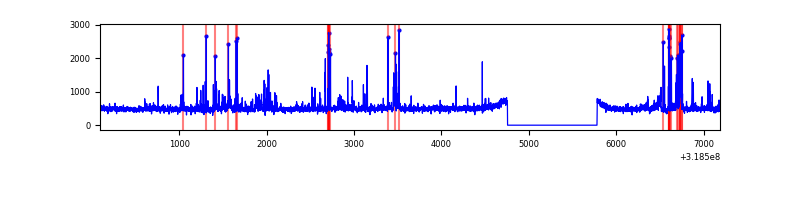 |
| C | 7096 | 6071 | 2 | 2 | 0.03% | 0.03% | 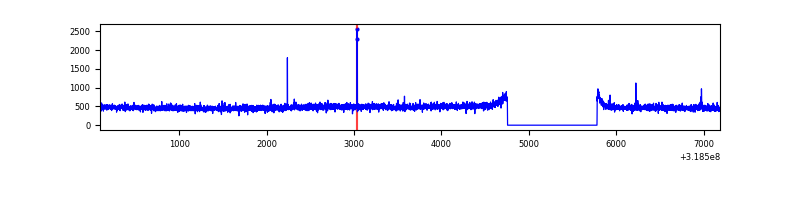 |
| D | 7096 | 6071 | 26 | 26 | 0.37% | 0.43% | 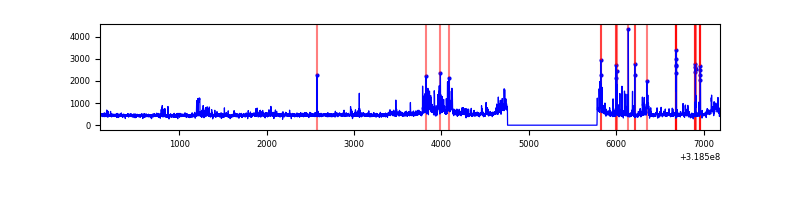 |
Top three noisy pixels from each quadrant. If the there are fewer than three noisy pixels in the level2.evt file, extra rows are filled as -1
| Pixel properties | Quadrant properties | ||||||
|---|---|---|---|---|---|---|---|
| Quadrant | DetID | PixID | Counts | Sigma | Mean | Median | Sigma |
| A | 13 | 254 | 10920 | 67.48 | 752 | 739 | 150.9 |
| A | 0 | 226 | 6622 | 38.99 | 752 | 739 | 150.9 |
| A | 3 | 137 | 6400 | 37.52 | 752 | 739 | 150.9 |
| B | 0 | 189 | 157565 | 1125.25 | 738 | 721 | 139.4 |
| B | 3 | 64 | 128090 | 913.79 | 738 | 721 | 139.4 |
| B | 0 | 230 | 22803 | 158.42 | 738 | 721 | 139.4 |
| C | 14 | 238 | 115269 | 694.81 | 709 | 711 | 164.9 |
| C | 7 | 247 | 15050 | 86.97 | 709 | 711 | 164.9 |
| C | 10 | 9 | 6299 | 33.89 | 709 | 711 | 164.9 |
| D | 1 | 52 | 398773 | 2235.05 | 725 | 701 | 178.1 |
| D | 9 | 85 | 105171 | 586.57 | 725 | 701 | 178.1 |
| D | 2 | 234 | 25431 | 138.85 | 725 | 701 | 178.1 |
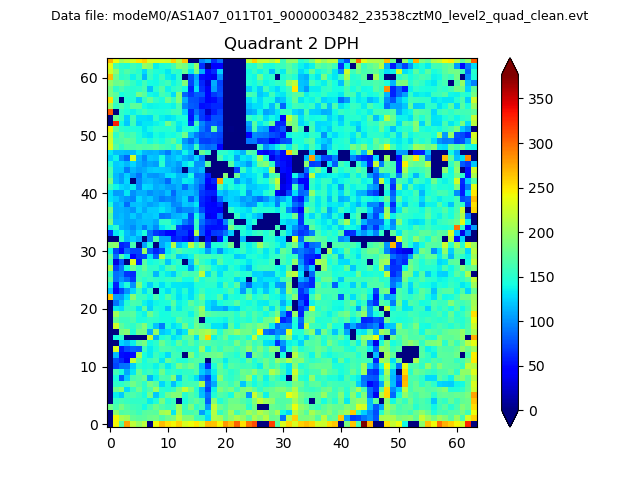
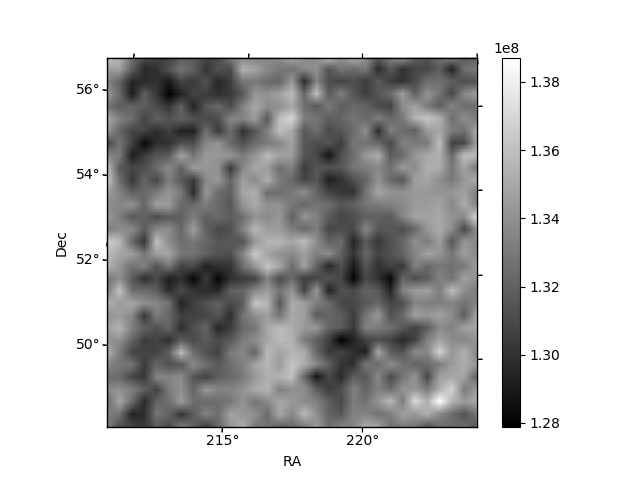
Histogram calculated using DETX and DETY for each event in the final _common_clean file
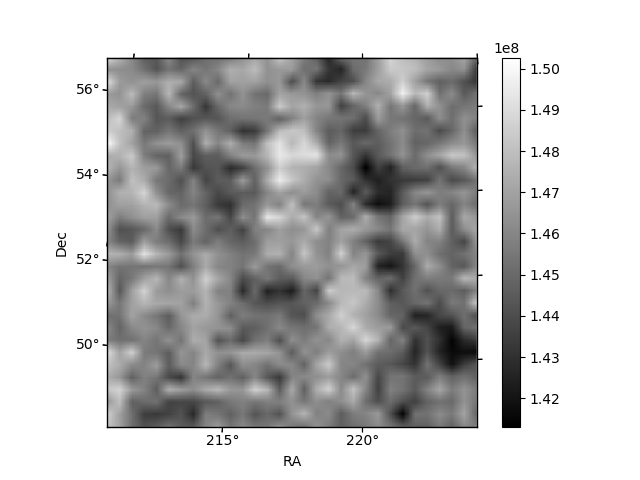
| Quadrant A | 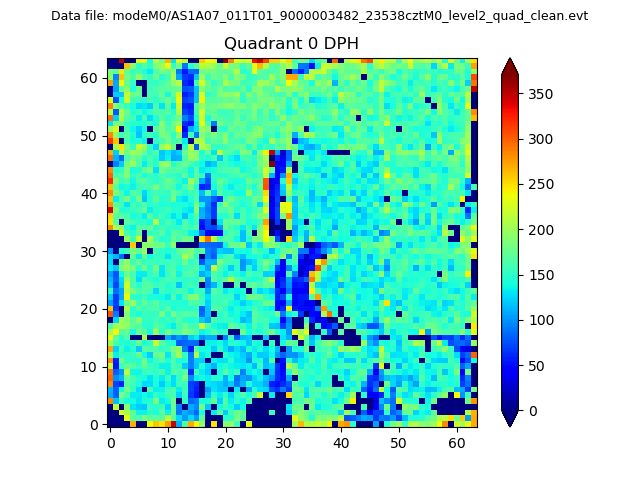 |
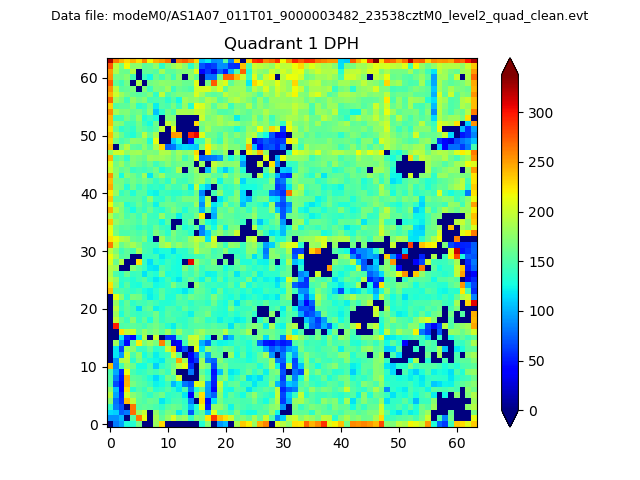 |
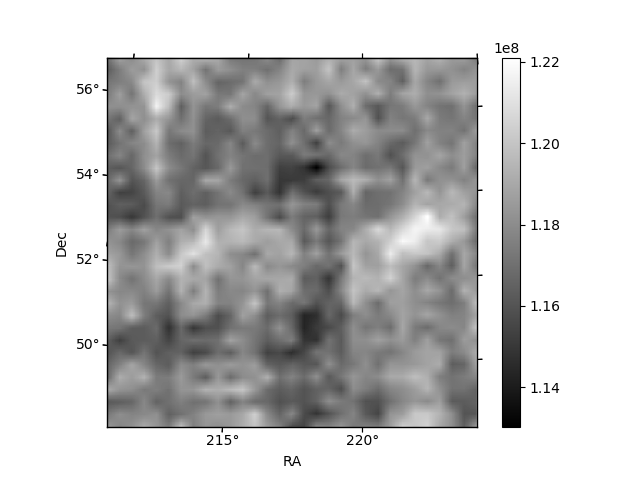
Quadrant B |
|---|---|---|---|
| Quadrant D | 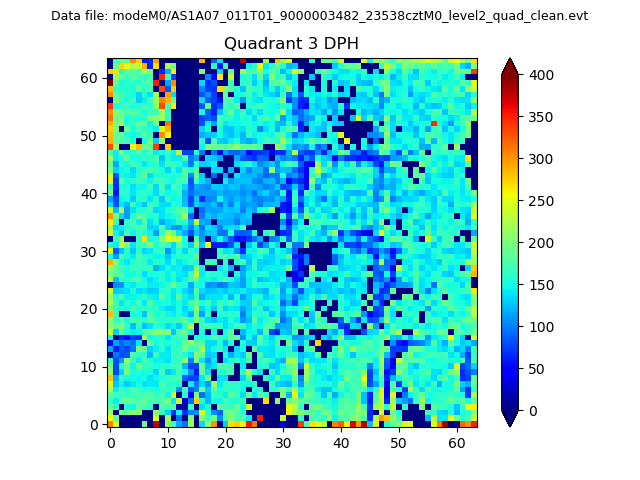 |
 |
Quadrant C |
| Plot type | Count rate plots | Images |
|---|---|---|
| Comparison with Poisson distribution Blue bars denote a histogram of data divided into 1 sec bins. Red curve is a Poisson curve with rate = median count rate of data. |
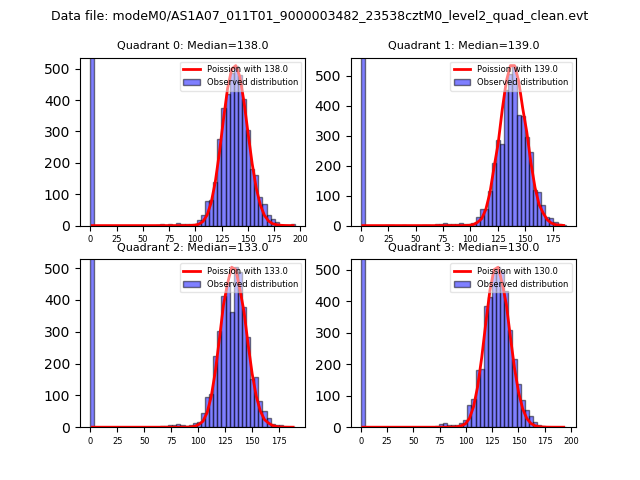 |
 |
| Quadrant-wise count rates Data is divided into 100 sec bins |
 |
|
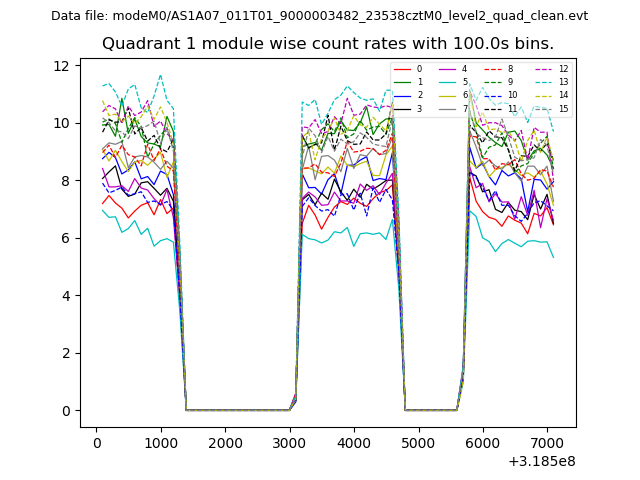
| Module-wise count rates for Quadrant A Data is divided into 100 sec bins |
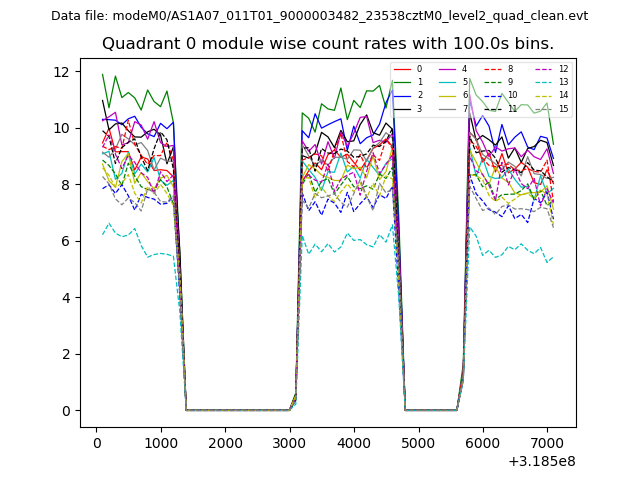 |
 |
| Module-wise count rates for Quadrant B Data is divided into 100 sec bins |
 |
 |
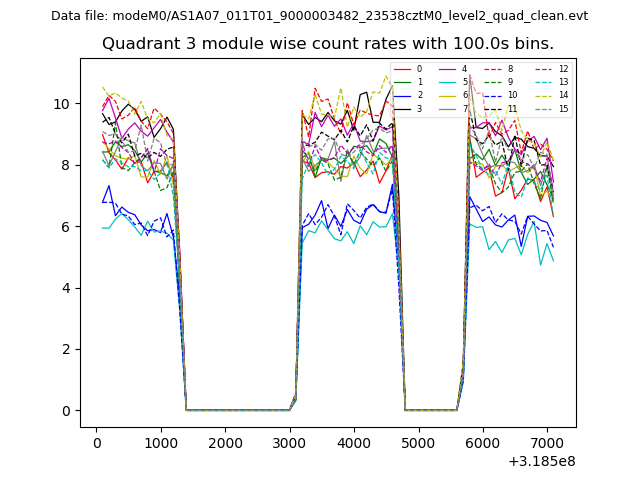
| Module-wise count rates for Quadrant C Data is divided into 100 sec bins |
 |
 |
| Module-wise count rates for Quadrant D Data is divided into 100 sec bins |
 |
 |
| Parameter | Plot |
|---|---|
| CZT HV Monitor |  |
| D_VDD | 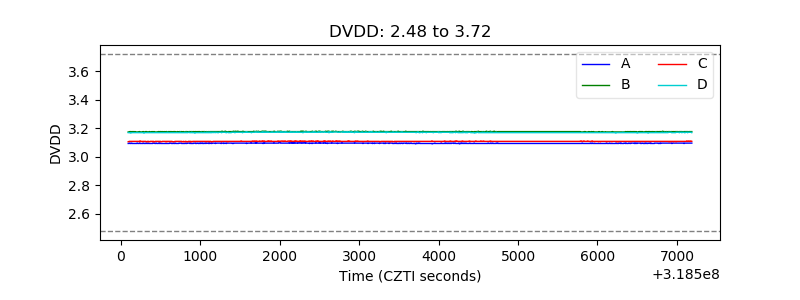 |
| Temperature 1 | 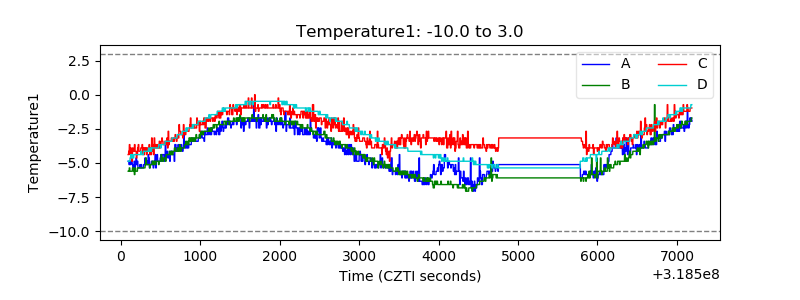 |
| Veto HV Monitor | 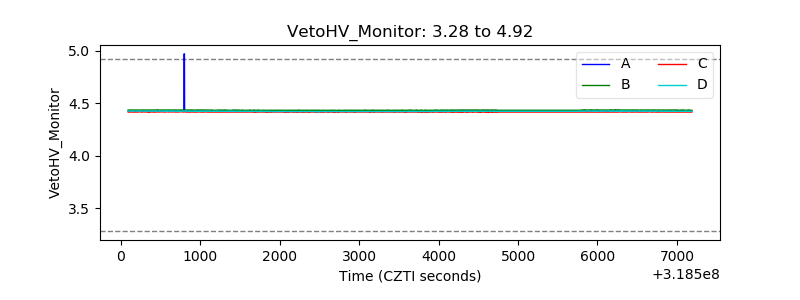 |
| Veto LLD | 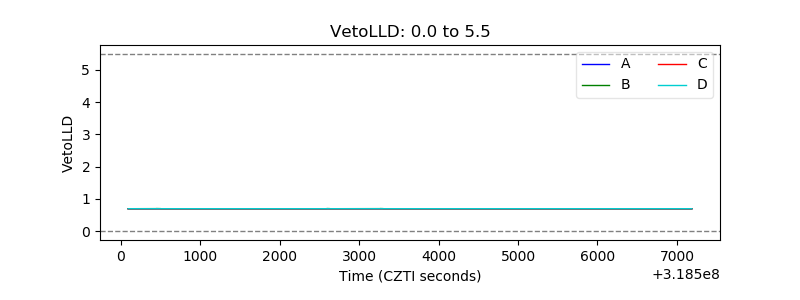 |
| Alpha Counter | 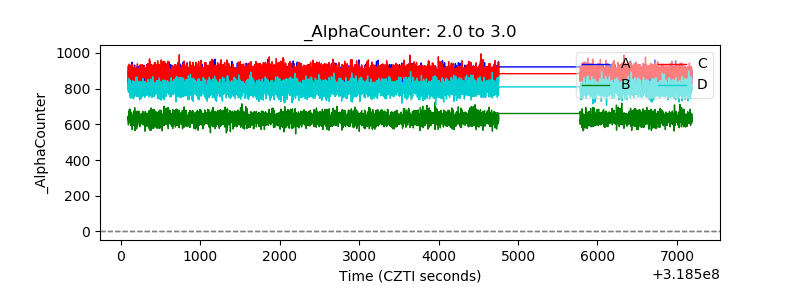 |
| _CPM_Rate | 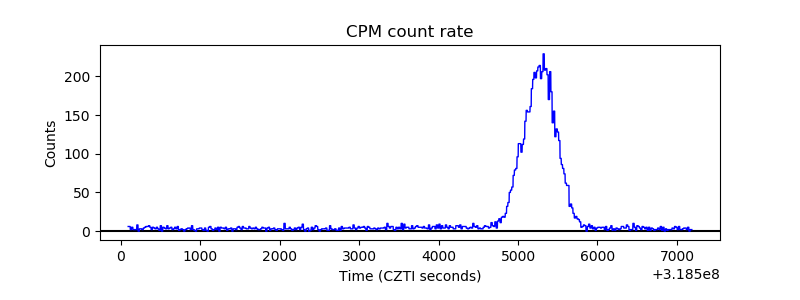 |
| CZT Counter | 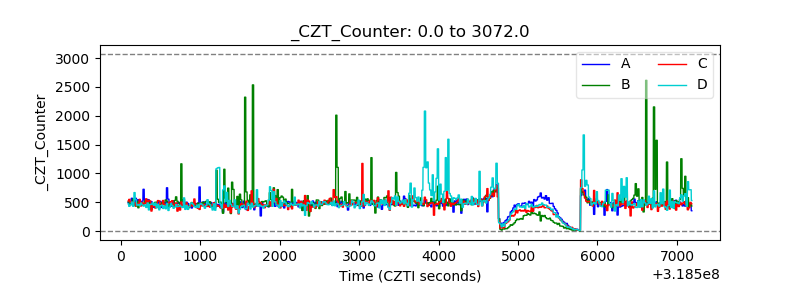 |
| +2.5 Volts monitor |  |
| +5 Volts monitor |  |
| _ROLL_ROT | 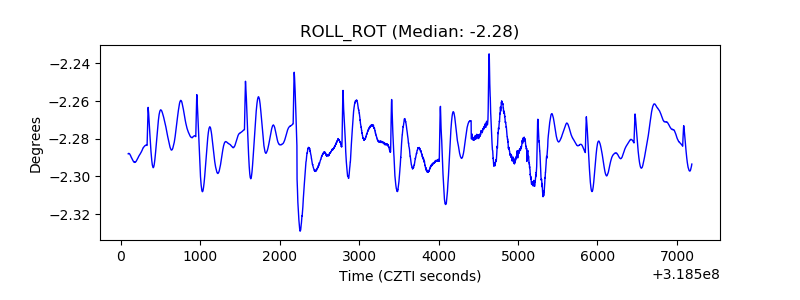 |
| _Roll_DEC | 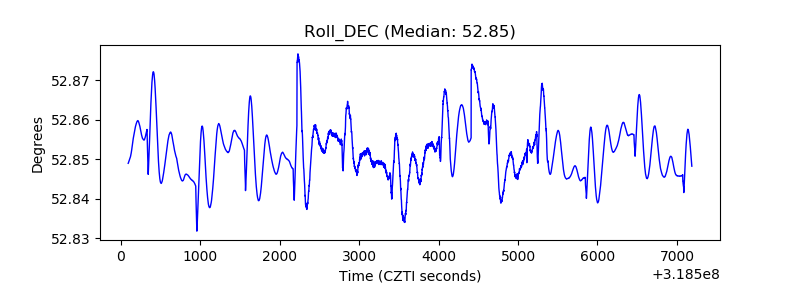 |
| _Roll_RA | 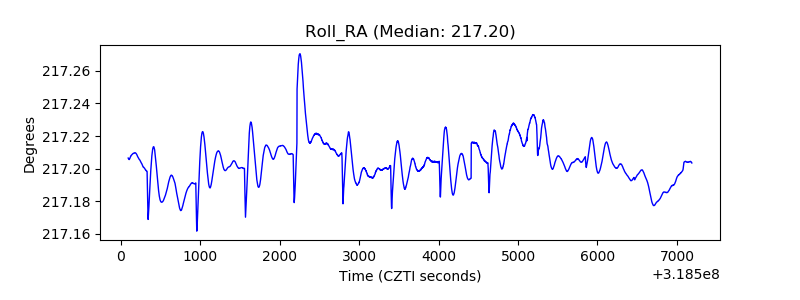 |
| Veto Counter | 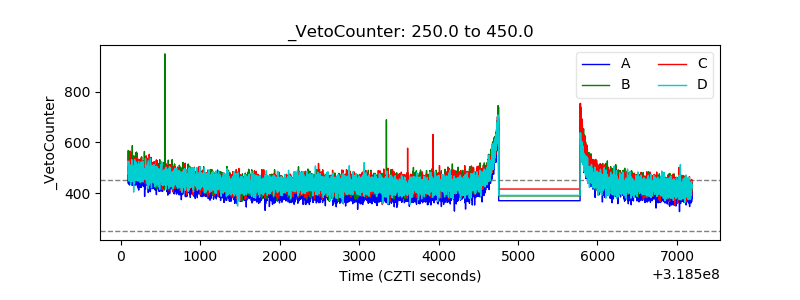 |