| Param | Original file | Final file |
|---|---|---|
| Filename | modeM0/AS1A07_011T01_9000003482_23539cztM0_level2.evt | modeM0/AS1A07_011T01_9000003482_23539cztM0_level2_quad_clean.evt |
| Size (bytes) | 551,013,120 | 97,041,600 |
| Size | 525.5 MB | 92.5 MB |
| Events in quadrant A | 3,283,183 | 625,505 |
| Events in quadrant B | 3,896,745 | 630,756 |
| Events in quadrant C | 3,314,970 | 607,989 |
| Events in quadrant D | 5,721,991 | 591,100 |
| Mode M9 | |||
|---|---|---|---|
| Quadrant | BADHDUFLAG | Total packets | Discarded packets |
| A | 0 | 6 | 0 |
| B | 0 | 6 | 0 |
| C | 0 | 6 | 0 |
| D | 0 | 6 | 0 |
| Mode SS | |||
|---|---|---|---|
| Quadrant | BADHDUFLAG | Total packets | Discarded packets |
| A | 0 | 140 | 0 |
| B | 0 | 140 | 0 |
| C | 0 | 140 | 0 |
| D | 0 | 140 | 0 |
| Mode M0 | |||
|---|---|---|---|
| Quadrant | BADHDUFLAG | Total packets | Discarded packets |
| A | 0 | 14203 | 1 |
| B | 0 | 15944 | 1 |
| C | 0 | 14257 | 1 |
| D | 0 | 21694 | 1 |
| Quadrant | Total seconds | Saturated seconds | Saturation percentage |
|---|---|---|---|
| A | 6938 | 111 | 1.599885% |
| B | 6939 | 199 | 2.867848% |
| C | 6939 | 115 | 1.657299% |
| D | 6939 | 546 | 7.868569% |
Noise dominated data is calculated using 1-second bins in cleaned event files. If a bin has >2000 counts, and if more than 50% of those come from <1% of pixels, then it is considered to be noise-dominated and hence unusable.
| Quadrant | # 1 sec bins | Bins with >0 counts | Bins with >2000 counts | High rate bins dominated by noise | Noise dominated (total time) | Noise dominated (detector-on time) | Marked lightcurve |
|---|---|---|---|---|---|---|---|
| A | 7518 | 6938 | 2 | 2 | 0.03% | 0.03% |  |
| B | 7519 | 6939 | 57 | 57 | 0.76% | 0.82% | 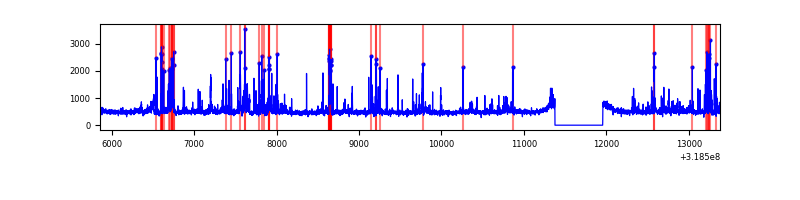 |
| C | 7519 | 6939 | 0 | 0 | 0.00% | 0.00% |  |
| D | 7518 | 6938 | 468 | 468 | 6.23% | 6.75% | 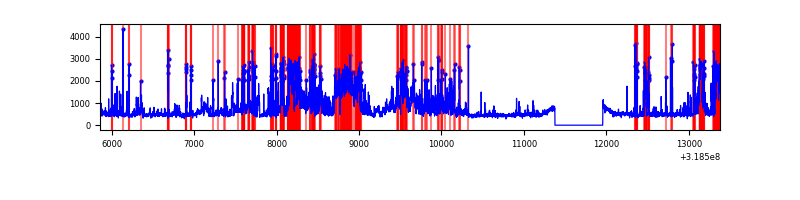 |
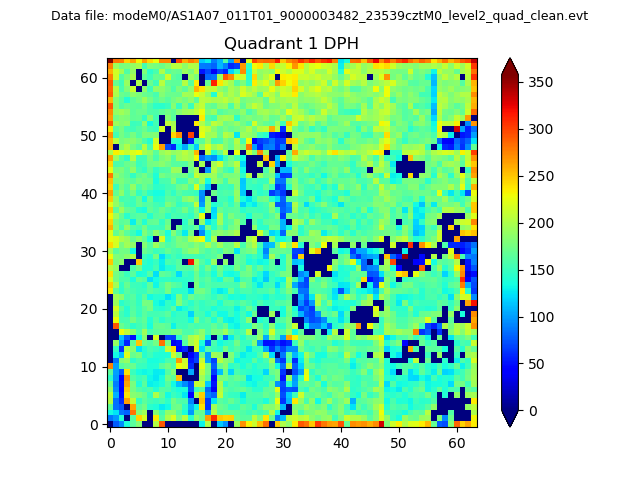
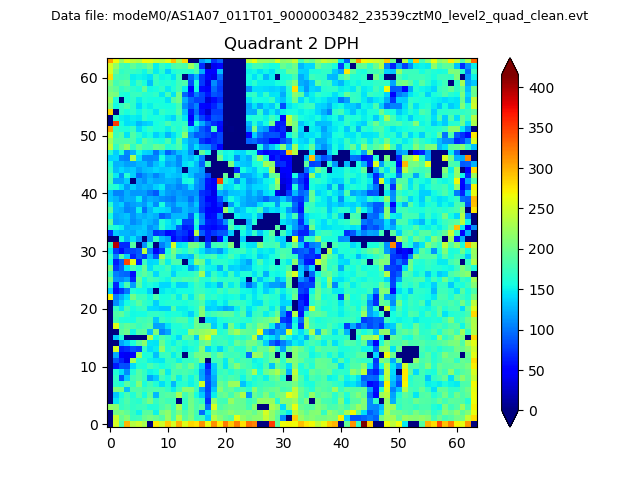
Top three noisy pixels from each quadrant. If the there are fewer than three noisy pixels in the level2.evt file, extra rows are filled as -1
| Pixel properties | Quadrant properties | ||||||
|---|---|---|---|---|---|---|---|
| Quadrant | DetID | PixID | Counts | Sigma | Mean | Median | Sigma |
| A | 4 | 2 | 16444 | 91.2 | 845 | 825 | 171.3 |
| A | 13 | 254 | 12878 | 70.38 | 845 | 825 | 171.3 |
| A | 13 | 252 | 7995 | 41.87 | 845 | 825 | 171.3 |
| B | 0 | 189 | 352005 | 2228.13 | 831 | 813 | 157.6 |
| B | 3 | 64 | 180959 | 1142.93 | 831 | 813 | 157.6 |
| B | 4 | 216 | 28056 | 172.84 | 831 | 813 | 157.6 |
| C | 14 | 238 | 127181 | 679.05 | 798 | 801 | 186.1 |
| C | 9 | 232 | 27176 | 141.72 | 798 | 801 | 186.1 |
| C | 7 | 247 | 25403 | 132.19 | 798 | 801 | 186.1 |
| D | 1 | 52 | 1777642 | 9146.77 | 798 | 773 | 194.3 |
| D | 9 | 85 | 683317 | 3513.52 | 798 | 773 | 194.3 |
| D | 12 | 233 | 141419 | 724.0 | 798 | 773 | 194.3 |
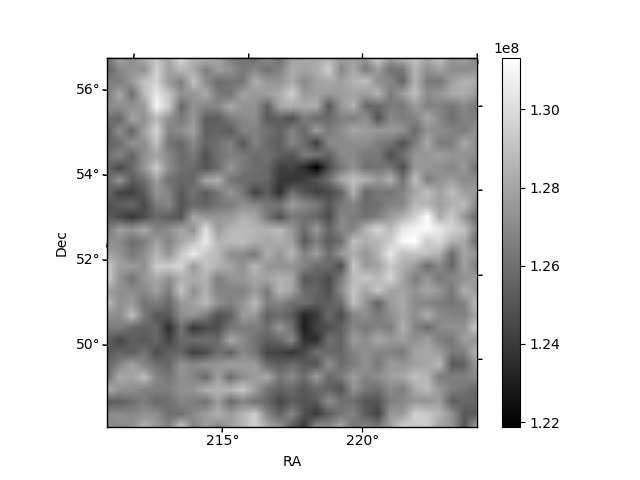
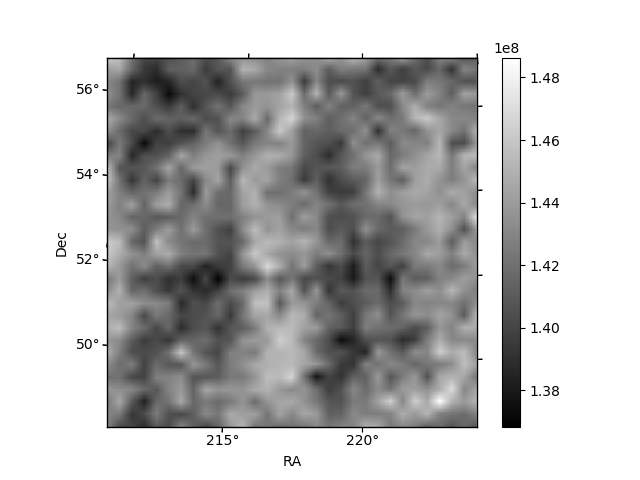
Histogram calculated using DETX and DETY for each event in the final _common_clean file
| Quadrant A | 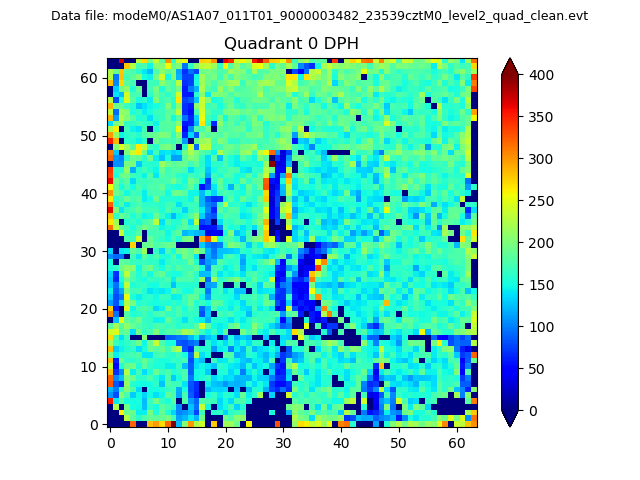 |
 |
Quadrant B |
|---|---|---|---|
| Quadrant D | 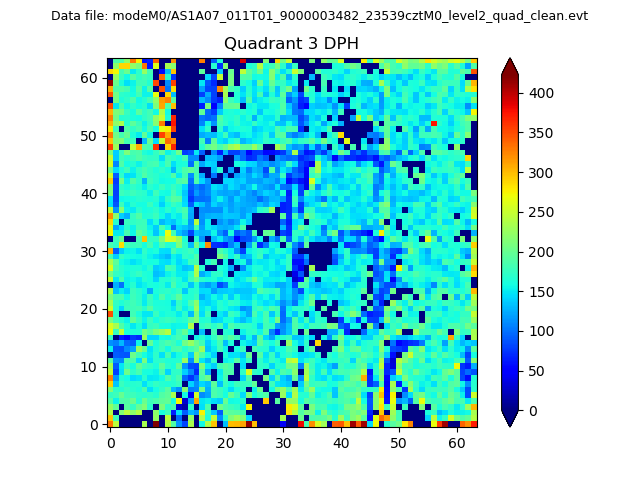 |
 |
Quadrant C |
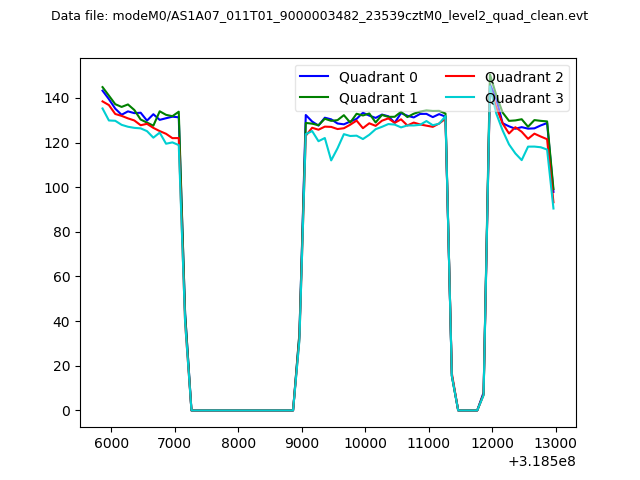
| Plot type | Count rate plots | Images |
|---|---|---|
| Comparison with Poisson distribution Blue bars denote a histogram of data divided into 1 sec bins. Red curve is a Poisson curve with rate = median count rate of data. |
 |
 |
| Quadrant-wise count rates Data is divided into 100 sec bins |
 |
|
| Module-wise count rates for Quadrant A Data is divided into 100 sec bins |
 |
 |
| Module-wise count rates for Quadrant B Data is divided into 100 sec bins |
 |
 |
| Module-wise count rates for Quadrant C Data is divided into 100 sec bins |
 |
 |
| Module-wise count rates for Quadrant D Data is divided into 100 sec bins |
 |
 |
| Parameter | Plot |
|---|---|
| CZT HV Monitor |  |
| D_VDD | 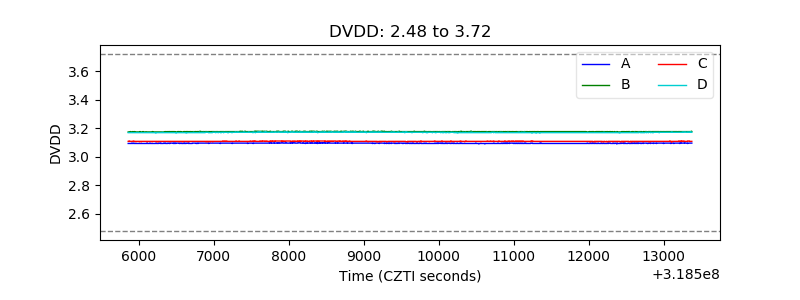 |
| Temperature 1 | 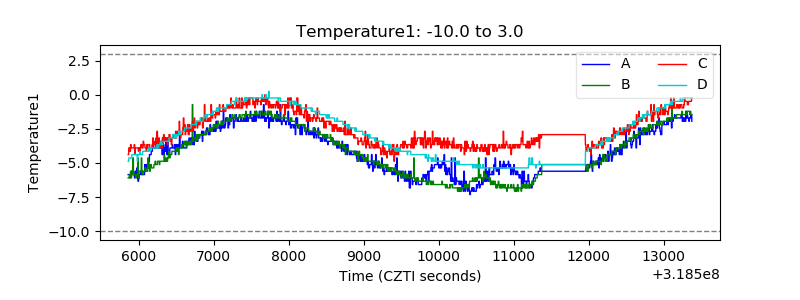 |
| Veto HV Monitor | 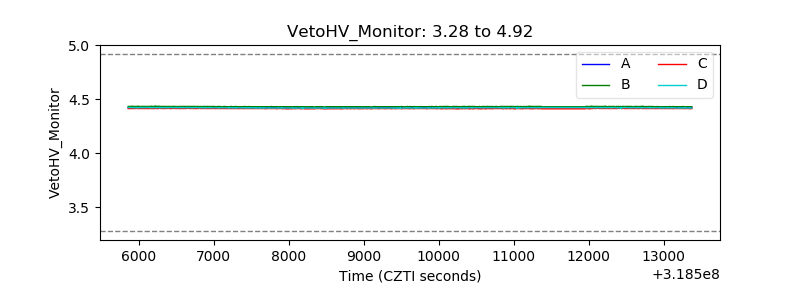 |
| Veto LLD | 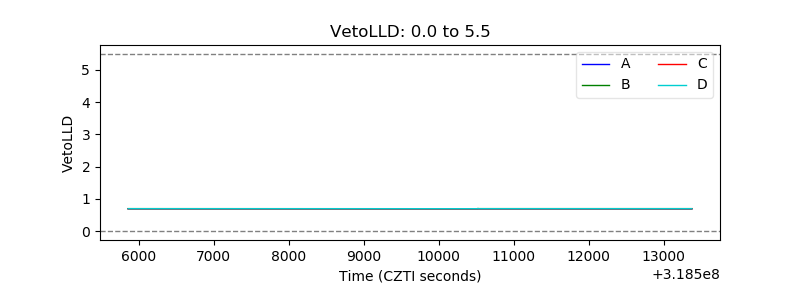 |
| Alpha Counter | 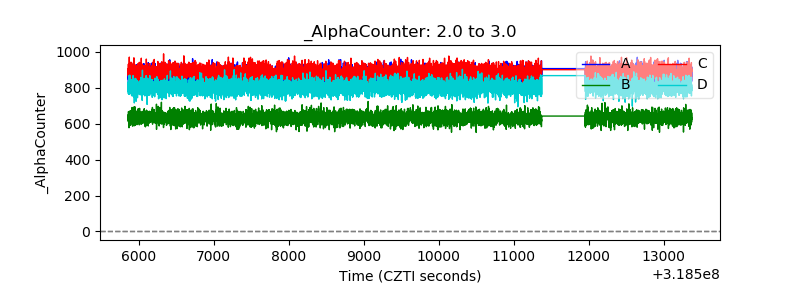 |
| _CPM_Rate | 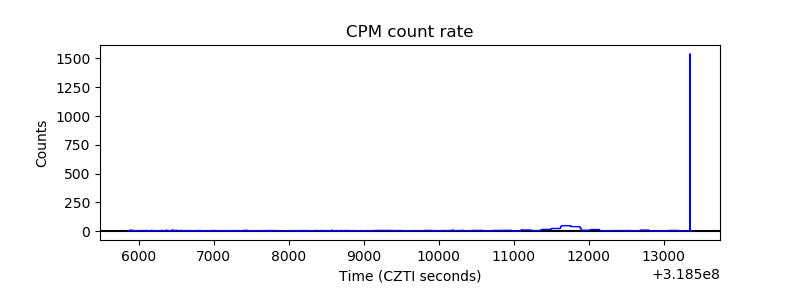 |
| CZT Counter | 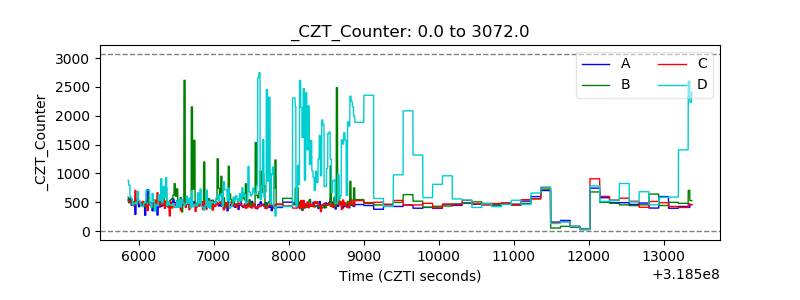 |
| +2.5 Volts monitor |  |
| +5 Volts monitor |  |
| _ROLL_ROT | 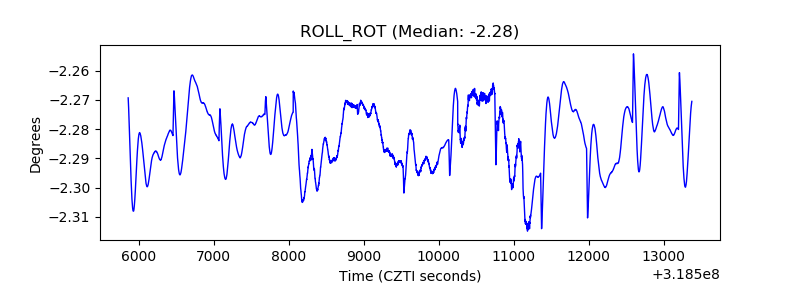 |
| _Roll_DEC |  |
| _Roll_RA | 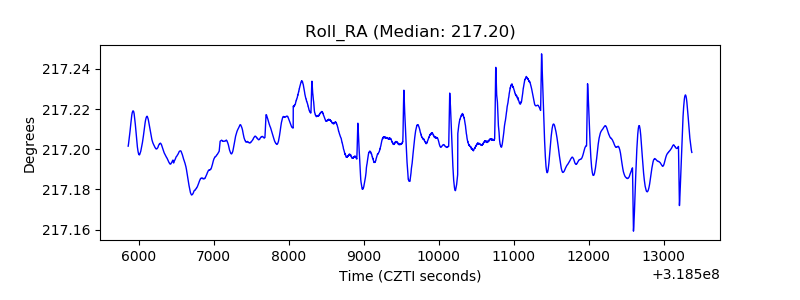 |
| Veto Counter |  |