| Param | Original file | Final file |
|---|---|---|
| Filename | modeM0/AS1A07_011T01_9000003482_23540cztM0_level2.evt | modeM0/AS1A07_011T01_9000003482_23540cztM0_level2_quad_clean.evt |
| Size (bytes) | 645,111,360 | 97,433,280 |
| Size | 615.2 MB | 92.9 MB |
| Events in quadrant A | 3,630,208 | 613,772 |
| Events in quadrant B | 4,159,847 | 620,804 |
| Events in quadrant C | 3,668,006 | 597,552 |
| Events in quadrant D | 7,556,304 | 581,712 |
| Mode M9 | |||
|---|---|---|---|
| Quadrant | BADHDUFLAG | Total packets | Discarded packets |
| A | 0 | 3 | 0 |
| B | 0 | 3 | 0 |
| C | 0 | 3 | 0 |
| D | 0 | 3 | 0 |
| Mode SS | |||
|---|---|---|---|
| Quadrant | BADHDUFLAG | Total packets | Discarded packets |
| A | 0 | 154 | 0 |
| B | 0 | 154 | 0 |
| C | 0 | 154 | 0 |
| D | 0 | 154 | 0 |
| Mode M0 | |||
|---|---|---|---|
| Quadrant | BADHDUFLAG | Total packets | Discarded packets |
| A | 0 | 15837 | 1 |
| B | 0 | 17252 | 1 |
| C | 0 | 15881 | 1 |
| D | 0 | 27655 | 1 |
| Quadrant | Total seconds | Saturated seconds | Saturation percentage |
|---|---|---|---|
| A | 7722 | 145 | 1.877752% |
| B | 7723 | 201 | 2.602616% |
| C | 7722 | 186 | 2.408702% |
| D | 7722 | 1201 | 15.552966% |
Noise dominated data is calculated using 1-second bins in cleaned event files. If a bin has >2000 counts, and if more than 50% of those come from <1% of pixels, then it is considered to be noise-dominated and hence unusable.
| Quadrant | # 1 sec bins | Bins with >0 counts | Bins with >2000 counts | High rate bins dominated by noise | Noise dominated (total time) | Noise dominated (detector-on time) | Marked lightcurve |
|---|---|---|---|---|---|---|---|
| A | 7942 | 7722 | 0 | 0 | 0.00% | 0.00% | 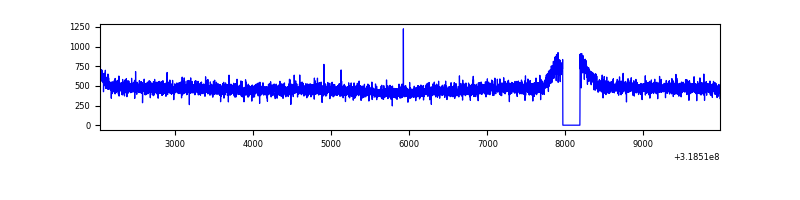 |
| B | 7943 | 7723 | 23 | 23 | 0.29% | 0.30% | 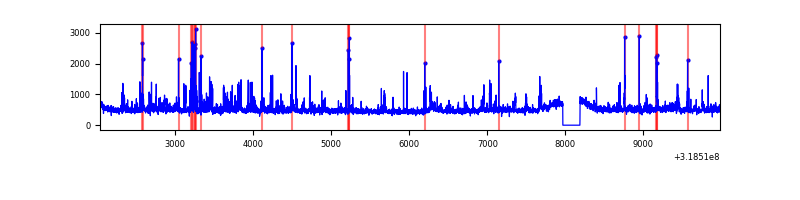 |
| C | 7942 | 7722 | 0 | 0 | 0.00% | 0.00% | 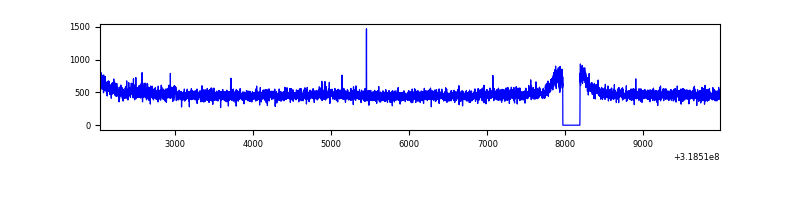 |
| D | 7942 | 7722 | 1005 | 1005 | 12.65% | 13.01% | 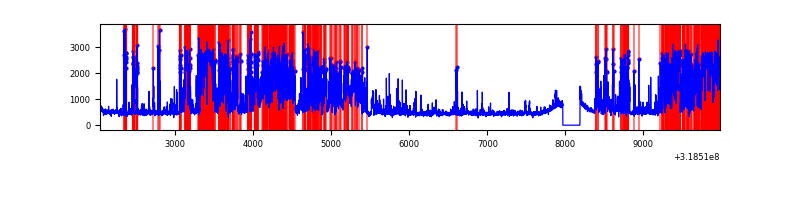 |
Top three noisy pixels from each quadrant. If the there are fewer than three noisy pixels in the level2.evt file, extra rows are filled as -1
| Pixel properties | Quadrant properties | ||||||
|---|---|---|---|---|---|---|---|
| Quadrant | DetID | PixID | Counts | Sigma | Mean | Median | Sigma |
| A | 13 | 254 | 13880 | 68.62 | 939 | 918 | 188.9 |
| A | 3 | 137 | 8506 | 40.17 | 939 | 918 | 188.9 |
| A | 0 | 226 | 8155 | 38.31 | 939 | 918 | 188.9 |
| B | 0 | 189 | 302984 | 1713.52 | 928 | 905 | 176.3 |
| B | 3 | 64 | 53864 | 300.41 | 928 | 905 | 176.3 |
| B | 0 | 229 | 52124 | 290.54 | 928 | 905 | 176.3 |
| C | 14 | 238 | 141165 | 679.18 | 888 | 891 | 206.5 |
| C | 9 | 232 | 25334 | 118.35 | 888 | 891 | 206.5 |
| C | 7 | 247 | 22657 | 105.39 | 888 | 891 | 206.5 |
| D | 1 | 52 | 1898574 | 8981.19 | 864 | 837 | 211.3 |
| D | 12 | 233 | 988479 | 4674.09 | 864 | 837 | 211.3 |
| D | 7 | 38 | 944707 | 4466.94 | 864 | 837 | 211.3 |
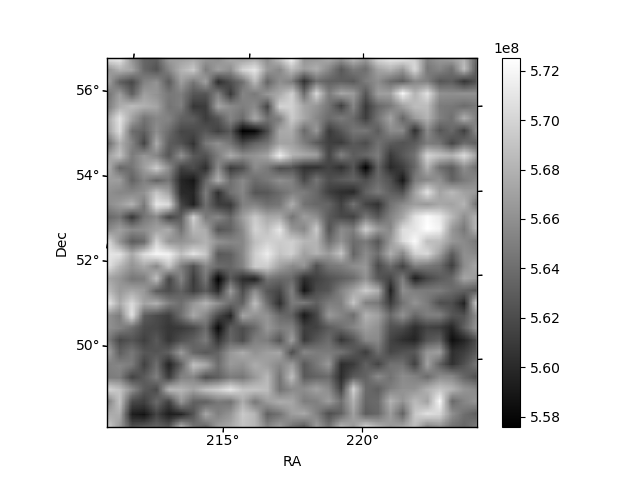
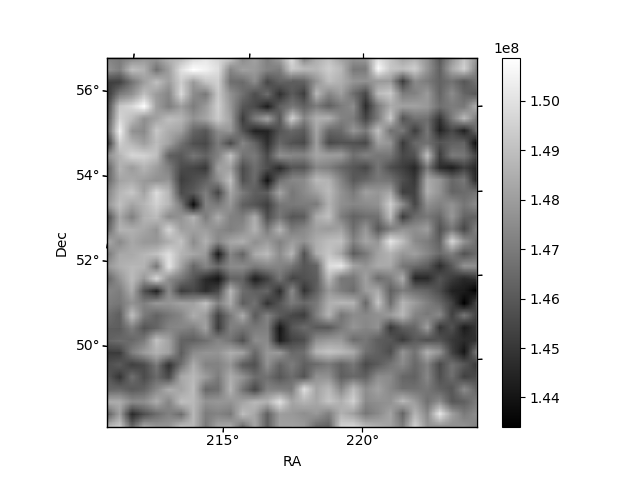
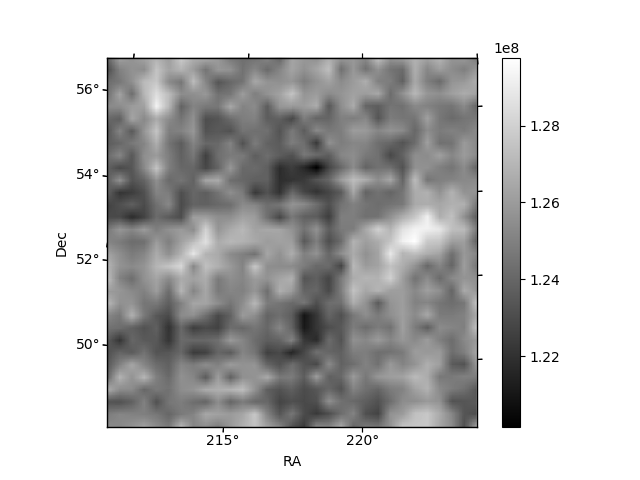
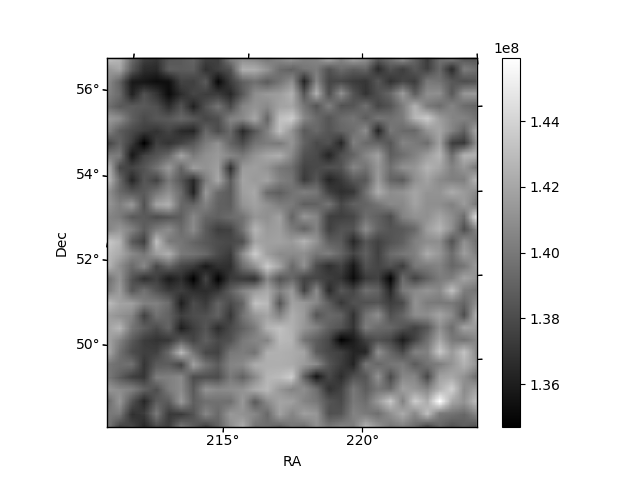
Histogram calculated using DETX and DETY for each event in the final _common_clean file
| Quadrant A | 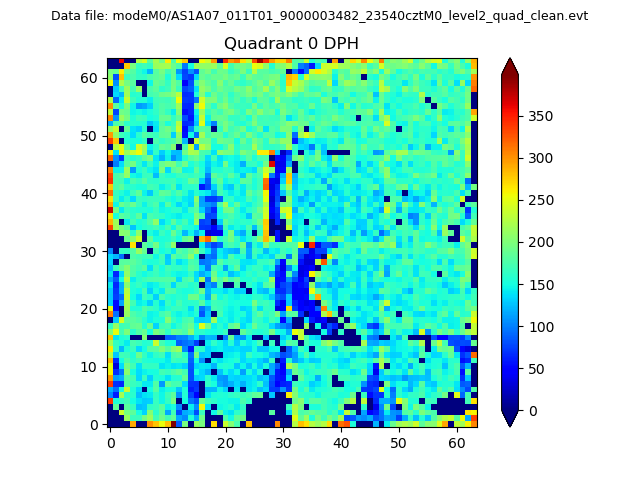 |
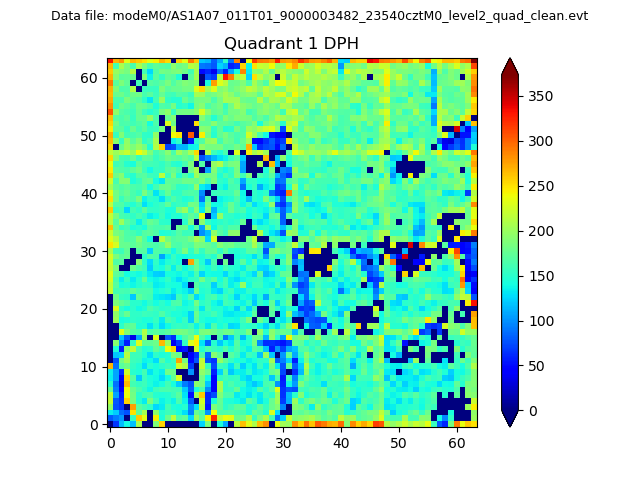 |
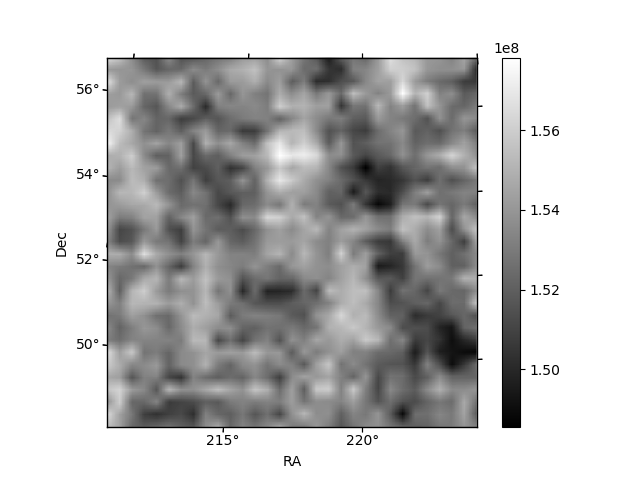
Quadrant B |
|---|---|---|---|
| Quadrant D | 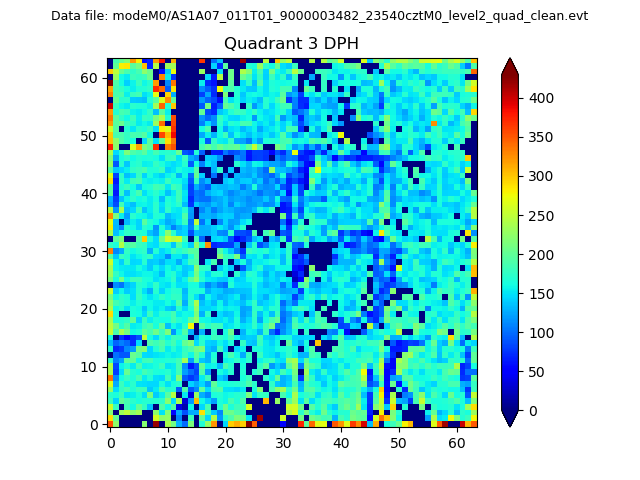 |
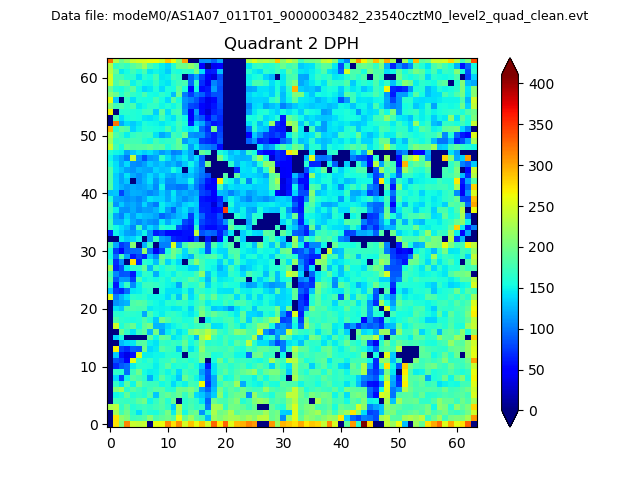 |
Quadrant C |
| Plot type | Count rate plots | Images |
|---|---|---|
| Comparison with Poisson distribution Blue bars denote a histogram of data divided into 1 sec bins. Red curve is a Poisson curve with rate = median count rate of data. |
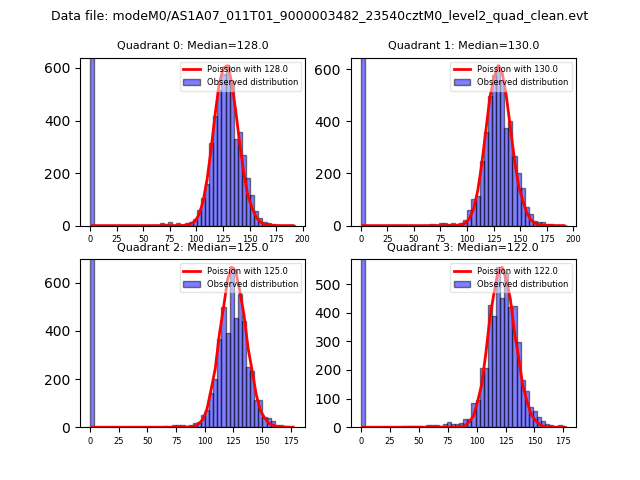 |
 |
| Quadrant-wise count rates Data is divided into 100 sec bins |
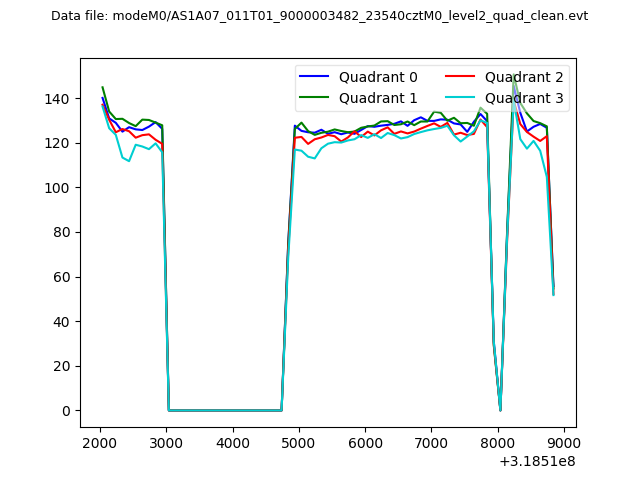 |
|
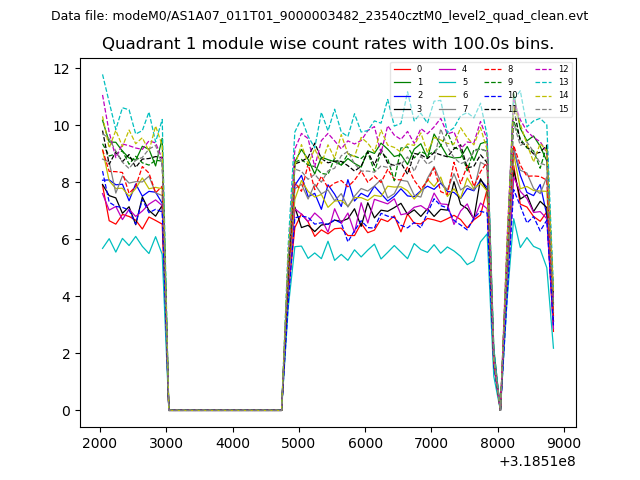
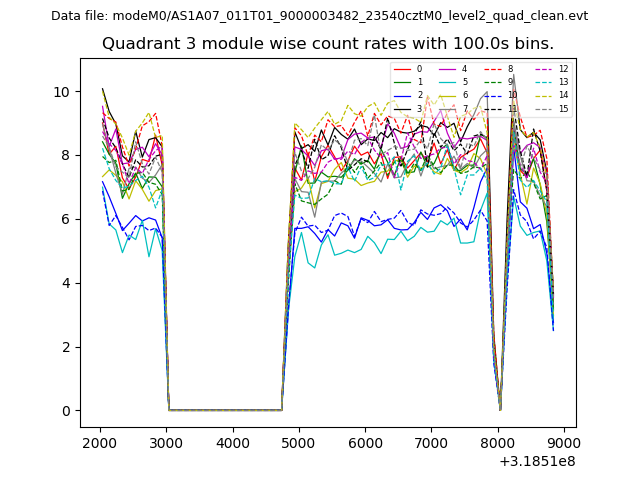
| Module-wise count rates for Quadrant A Data is divided into 100 sec bins |
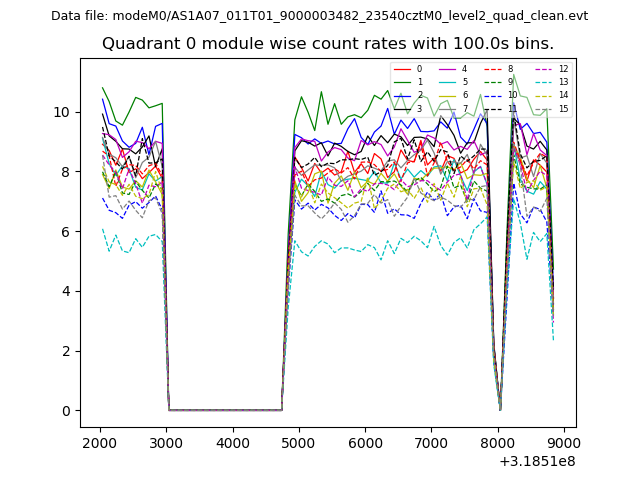 |
 |
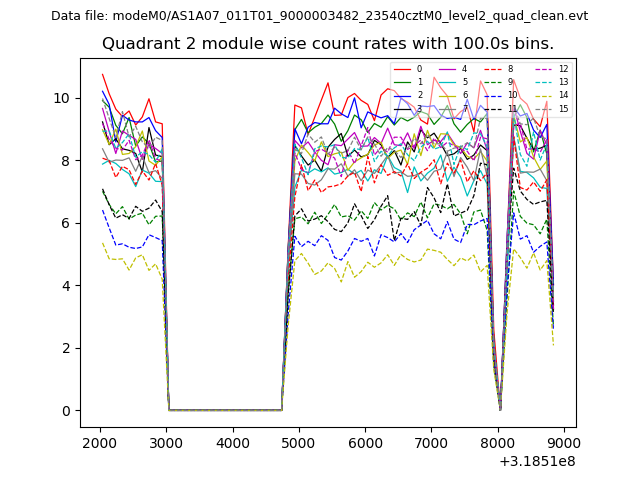
| Module-wise count rates for Quadrant B Data is divided into 100 sec bins |
 |
 |
| Module-wise count rates for Quadrant C Data is divided into 100 sec bins |
 |
 |
| Module-wise count rates for Quadrant D Data is divided into 100 sec bins |
 |
 |
| Parameter | Plot |
|---|---|
| CZT HV Monitor | 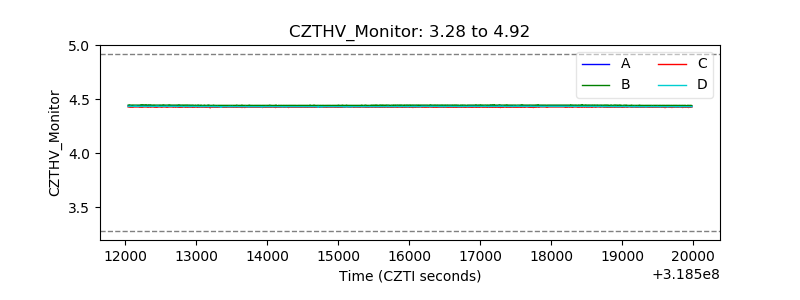 |
| D_VDD | 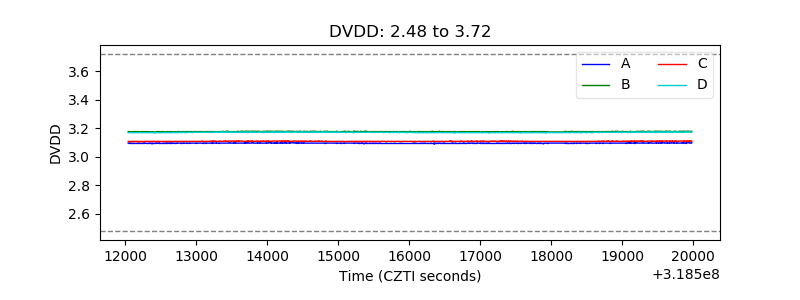 |
| Temperature 1 | 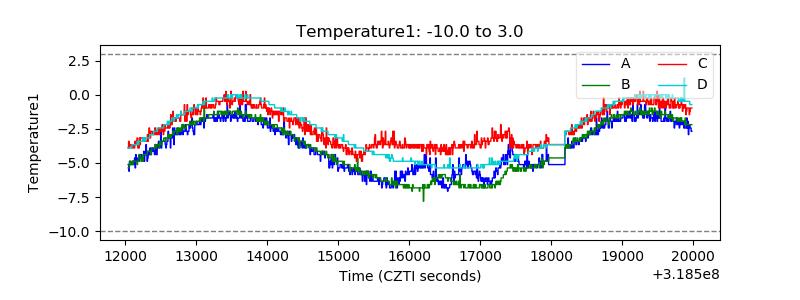 |
| Veto HV Monitor |  |
| Veto LLD | 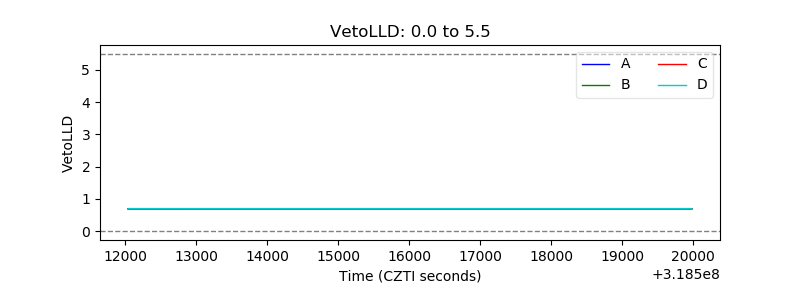 |
| Alpha Counter | 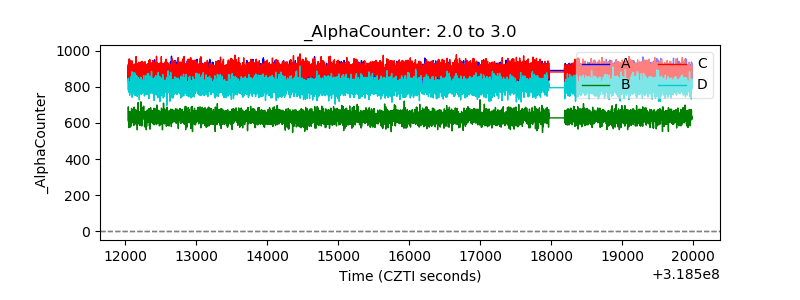 |
| _CPM_Rate | 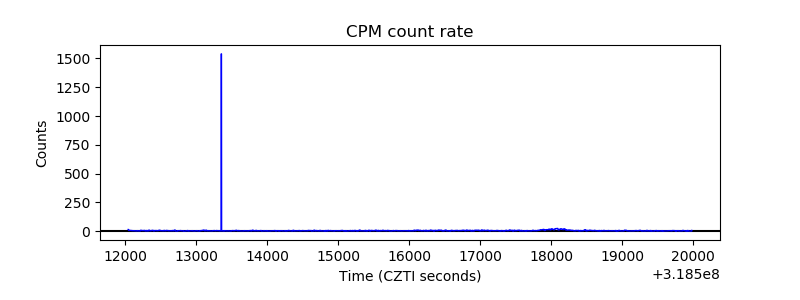 |
| CZT Counter | 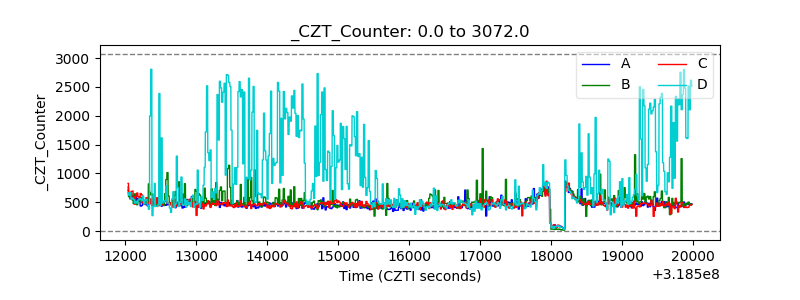 |
| +2.5 Volts monitor |  |
| +5 Volts monitor | 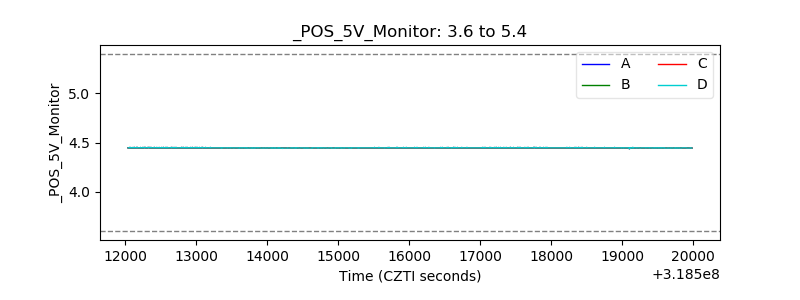 |
| _ROLL_ROT | 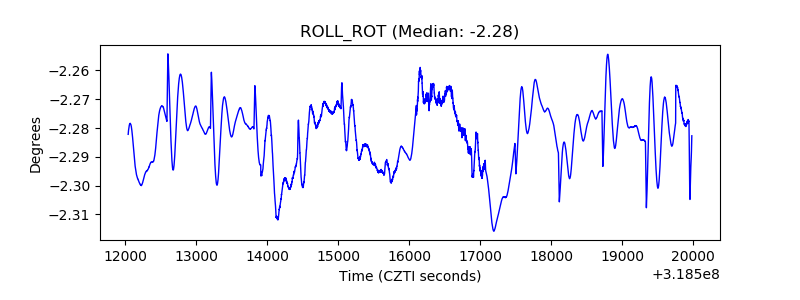 |
| _Roll_DEC | 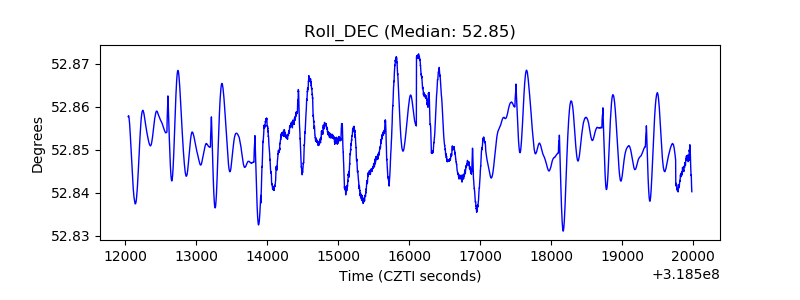 |
| _Roll_RA | 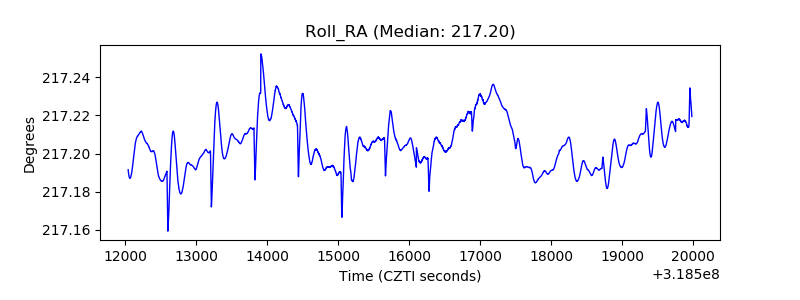 |
| Veto Counter | 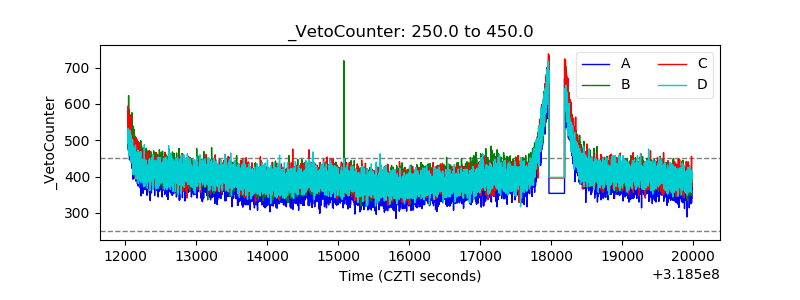 |