| Param | Original file | Final file |
|---|---|---|
| Filename | modeM0/AS1A07_011T01_9000003482_23541cztM0_level2.evt | modeM0/AS1A07_011T01_9000003482_23541cztM0_level2_quad_clean.evt |
| Size (bytes) | 587,355,840 | 90,564,480 |
| Size | 560.1 MB | 86.4 MB |
| Events in quadrant A | 3,592,658 | 562,943 |
| Events in quadrant B | 4,093,784 | 566,022 |
| Events in quadrant C | 3,630,982 | 546,154 |
| Events in quadrant D | 5,953,745 | 537,025 |
| Mode M9 | |||
|---|---|---|---|
| Quadrant | BADHDUFLAG | Total packets | Discarded packets |
| A | 0 | 3 | 0 |
| B | 0 | 4 | 0 |
| C | 0 | 4 | 0 |
| D | 0 | 4 | 0 |
| Mode SS | |||
|---|---|---|---|
| Quadrant | BADHDUFLAG | Total packets | Discarded packets |
| A | 0 | 154 | 0 |
| B | 0 | 154 | 0 |
| C | 0 | 154 | 0 |
| D | 0 | 154 | 0 |
| Mode M0 | |||
|---|---|---|---|
| Quadrant | BADHDUFLAG | Total packets | Discarded packets |
| A | 0 | 15678 | 2 |
| B | 0 | 16940 | 2 |
| C | 0 | 15691 | 2 |
| D | 0 | 23002 | 4 |
| Quadrant | Total seconds | Saturated seconds | Saturation percentage |
|---|---|---|---|
| A | 7622 | 112 | 1.469431% |
| B | 7622 | 185 | 2.427184% |
| C | 7622 | 176 | 2.309105% |
| D | 7621 | 700 | 9.185146% |
Noise dominated data is calculated using 1-second bins in cleaned event files. If a bin has >2000 counts, and if more than 50% of those come from <1% of pixels, then it is considered to be noise-dominated and hence unusable.
| Quadrant | # 1 sec bins | Bins with >0 counts | Bins with >2000 counts | High rate bins dominated by noise | Noise dominated (total time) | Noise dominated (detector-on time) | Marked lightcurve |
|---|---|---|---|---|---|---|---|
| A | 7907 | 7622 | 0 | 0 | 0.00% | 0.00% | 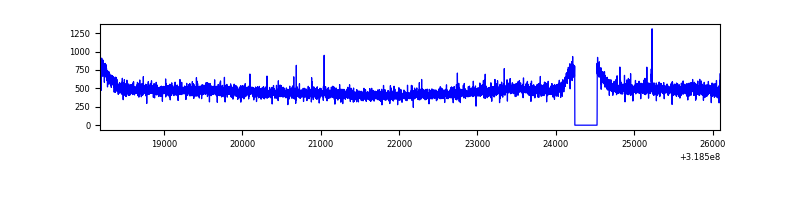 |
| B | 7907 | 7622 | 33 | 33 | 0.42% | 0.43% | 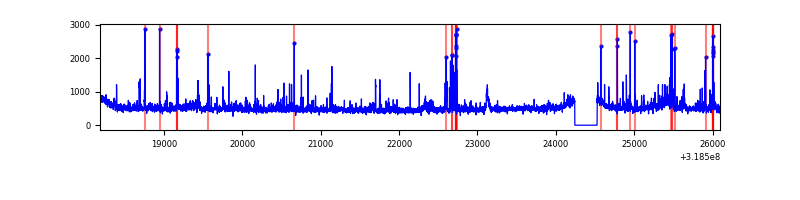 |
| C | 7907 | 7622 | 1 | 1 | 0.01% | 0.01% | 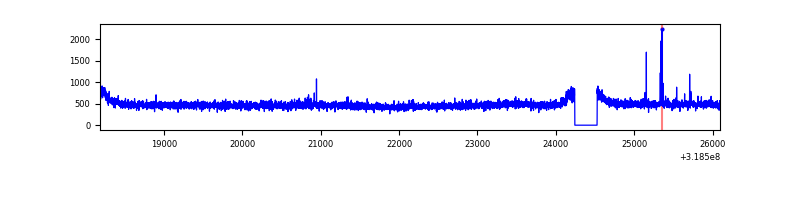 |
| D | 7906 | 7622 | 573 | 573 | 7.25% | 7.52% | 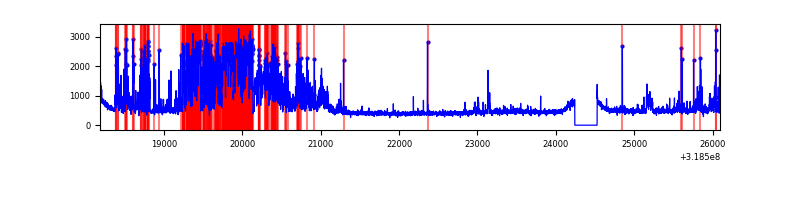 |
Top three noisy pixels from each quadrant. If the there are fewer than three noisy pixels in the level2.evt file, extra rows are filled as -1
| Pixel properties | Quadrant properties | ||||||
|---|---|---|---|---|---|---|---|
| Quadrant | DetID | PixID | Counts | Sigma | Mean | Median | Sigma |
| A | 13 | 254 | 13738 | 68.81 | 930 | 909 | 186.4 |
| A | 3 | 137 | 8340 | 39.86 | 930 | 909 | 186.4 |
| A | 0 | 226 | 8066 | 38.39 | 930 | 909 | 186.4 |
| B | 0 | 189 | 182437 | 1038.04 | 918 | 894 | 174.9 |
| B | 0 | 229 | 106385 | 603.18 | 918 | 894 | 174.9 |
| B | 3 | 64 | 97134 | 550.29 | 918 | 894 | 174.9 |
| C | 14 | 238 | 140288 | 680.77 | 881 | 884 | 204.8 |
| C | 10 | 9 | 16713 | 77.3 | 881 | 884 | 204.8 |
| C | 9 | 232 | 10241 | 45.69 | 881 | 884 | 204.8 |
| D | 12 | 233 | 1218998 | 5650.89 | 875 | 847 | 215.6 |
| D | 7 | 38 | 814643 | 3775.12 | 875 | 847 | 215.6 |
| D | 1 | 52 | 513088 | 2376.24 | 875 | 847 | 215.6 |
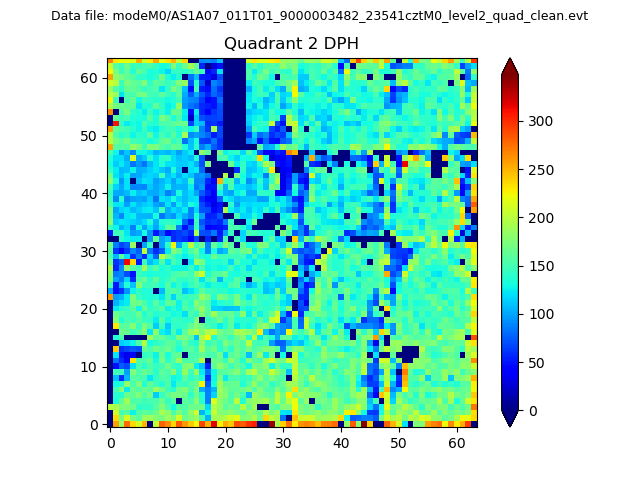
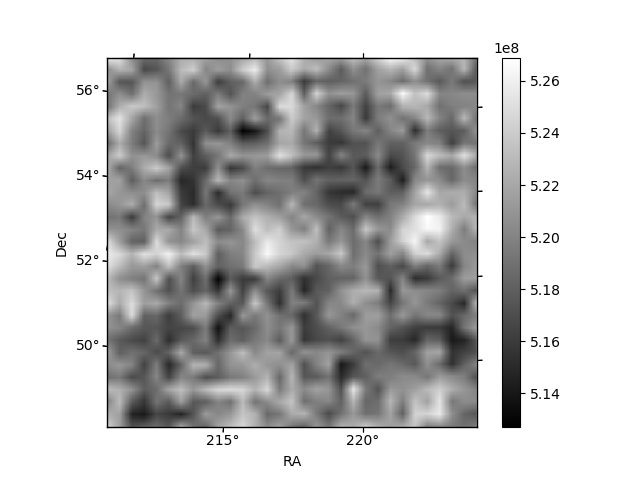
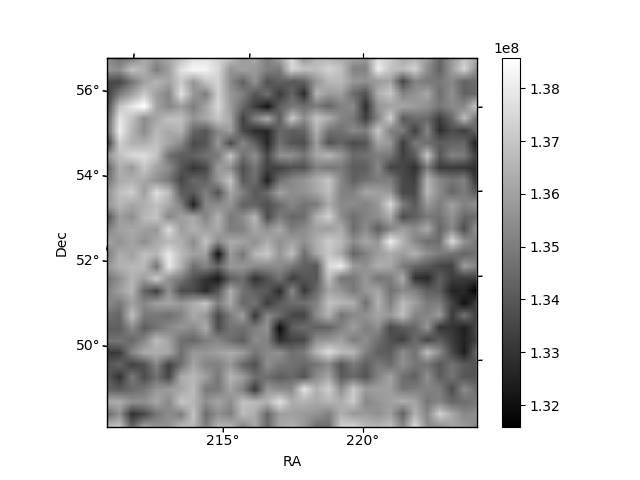
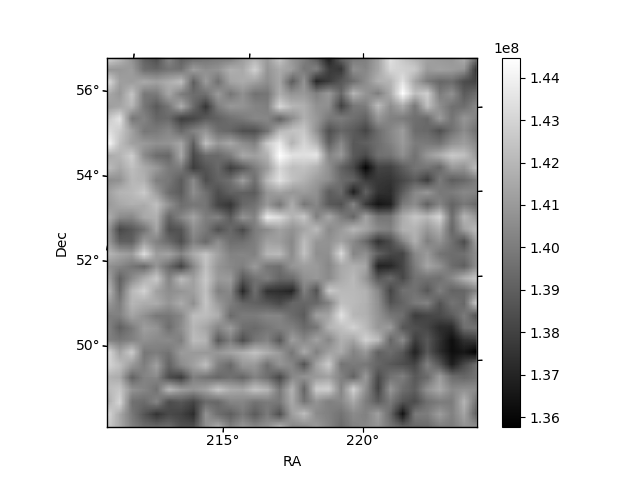
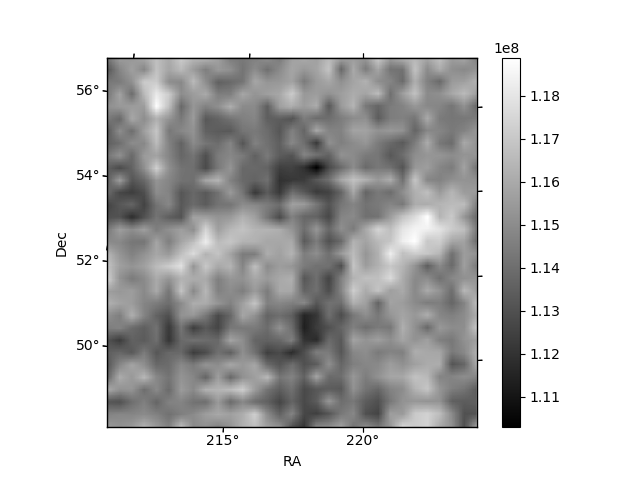
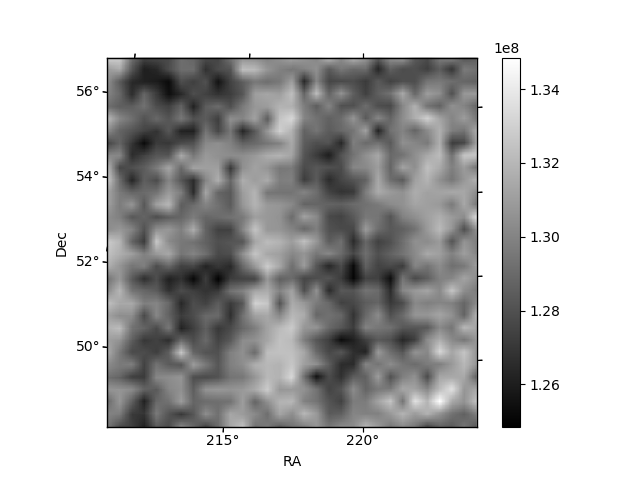
Histogram calculated using DETX and DETY for each event in the final _common_clean file
| Quadrant A | 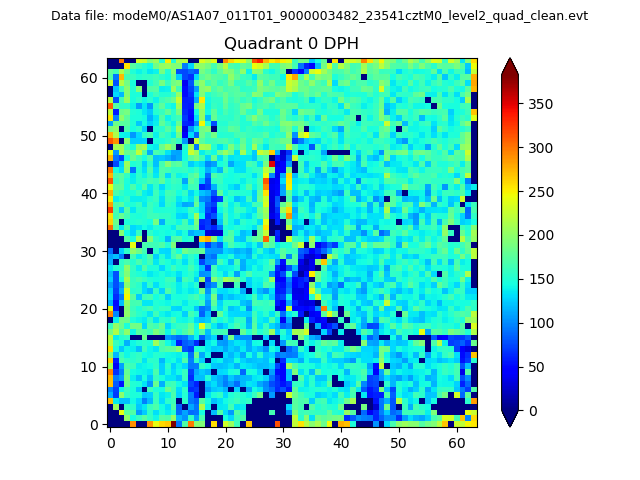 |
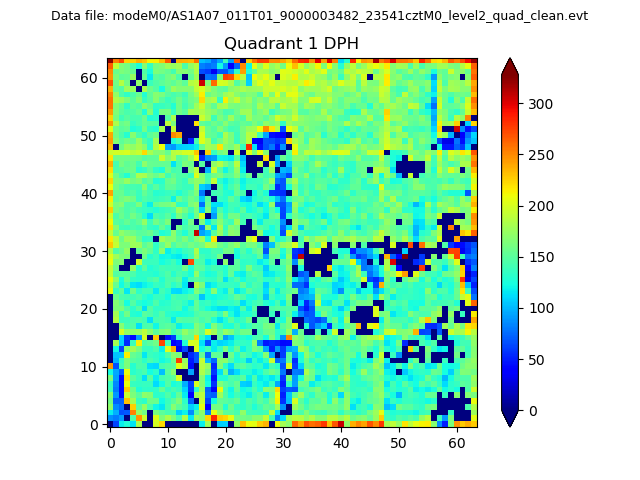 |
Quadrant B |
|---|---|---|---|
| Quadrant D | 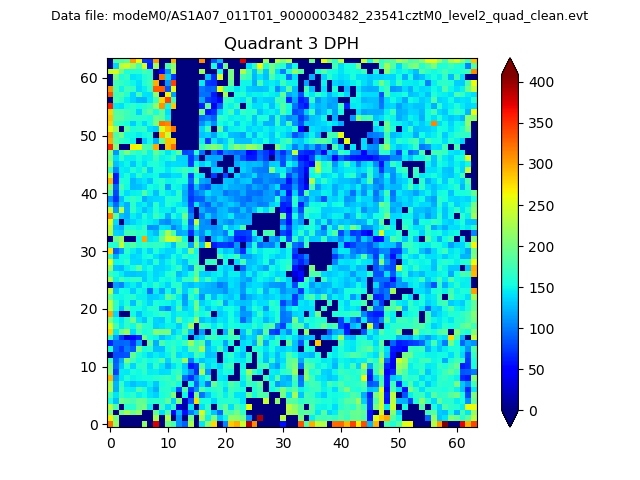 |
 |
Quadrant C |
| Plot type | Count rate plots | Images |
|---|---|---|
| Comparison with Poisson distribution Blue bars denote a histogram of data divided into 1 sec bins. Red curve is a Poisson curve with rate = median count rate of data. |
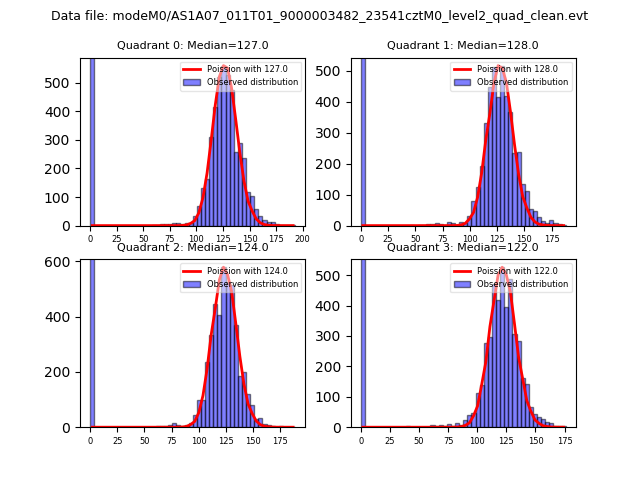 |
 |
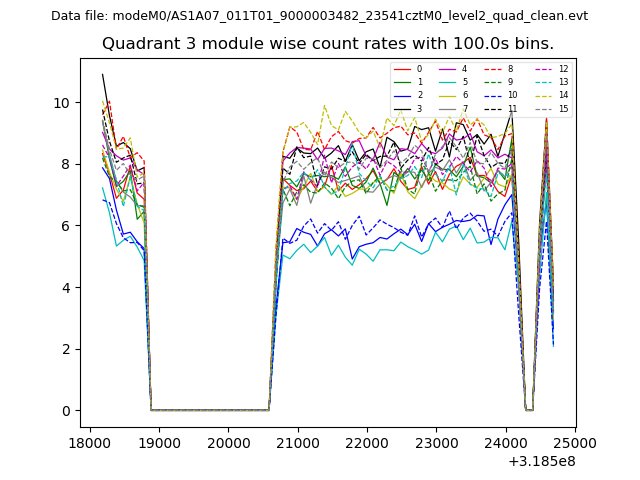
| Quadrant-wise count rates Data is divided into 100 sec bins |
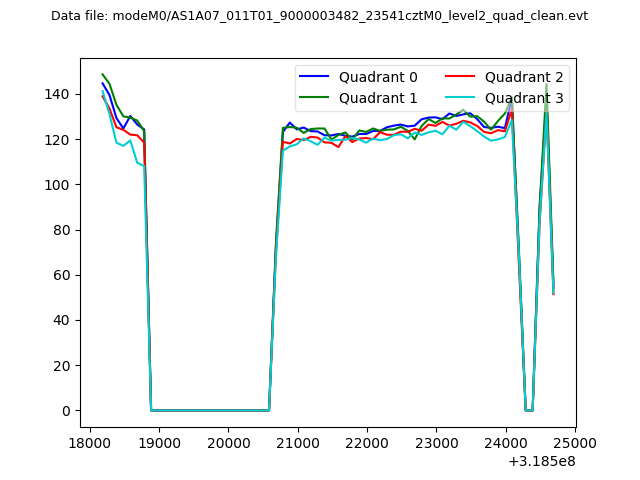 |
|
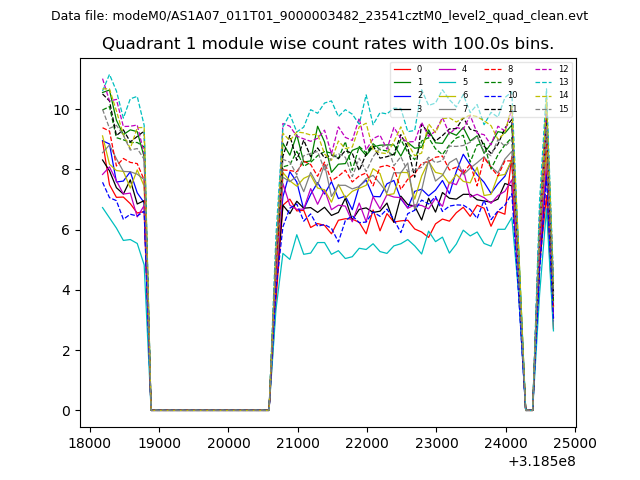
| Module-wise count rates for Quadrant A Data is divided into 100 sec bins |
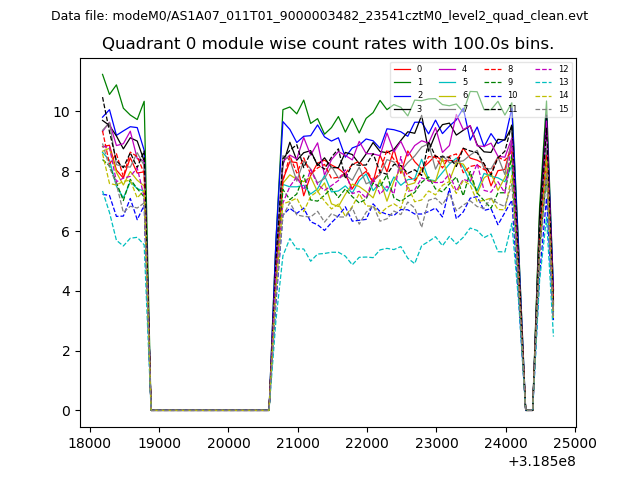 |
 |
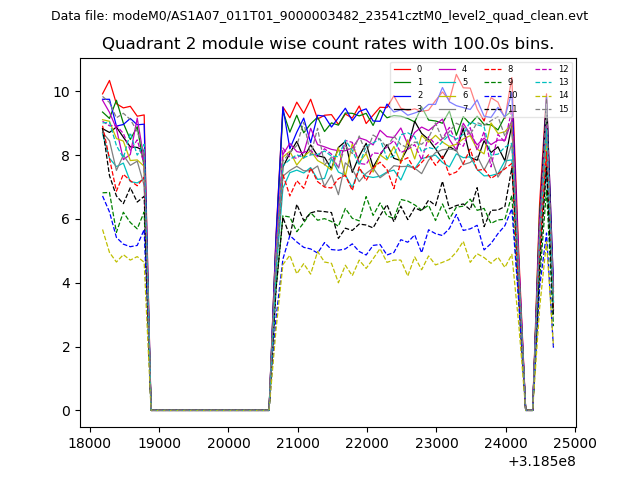
| Module-wise count rates for Quadrant B Data is divided into 100 sec bins |
 |
 |
| Module-wise count rates for Quadrant C Data is divided into 100 sec bins |
 |
 |
| Module-wise count rates for Quadrant D Data is divided into 100 sec bins |
 |
 |
| Parameter | Plot |
|---|---|
| CZT HV Monitor | 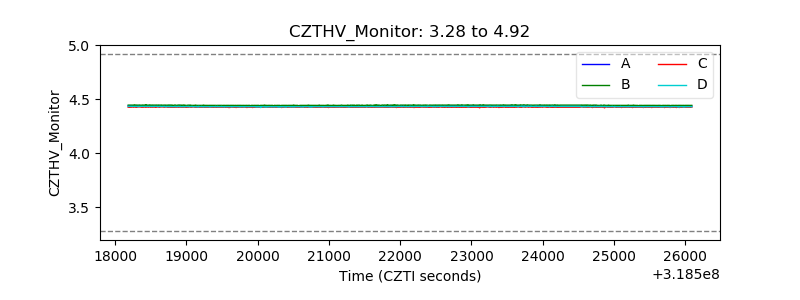 |
| D_VDD | 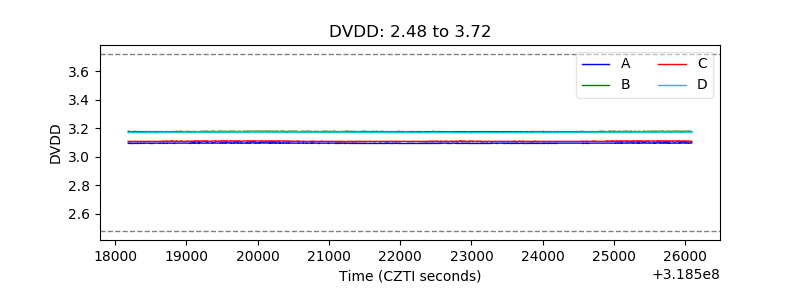 |
| Temperature 1 | 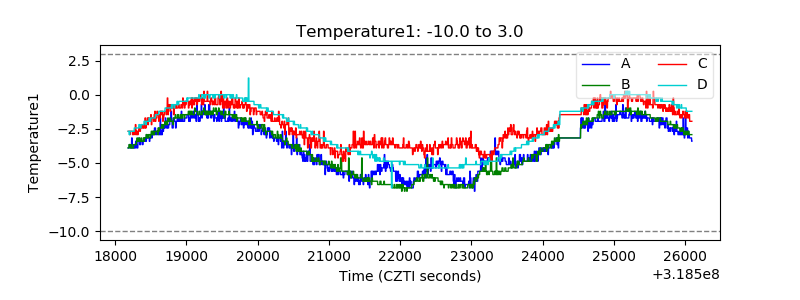 |
| Veto HV Monitor | 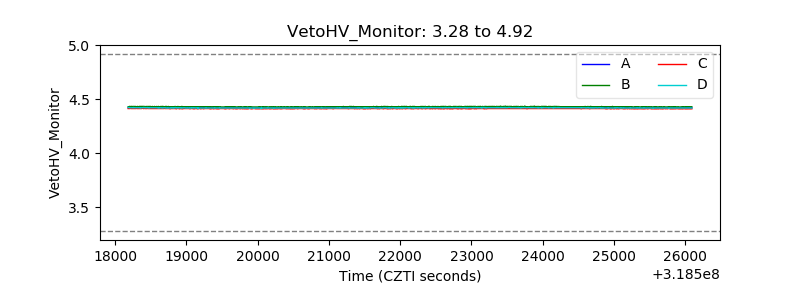 |
| Veto LLD | 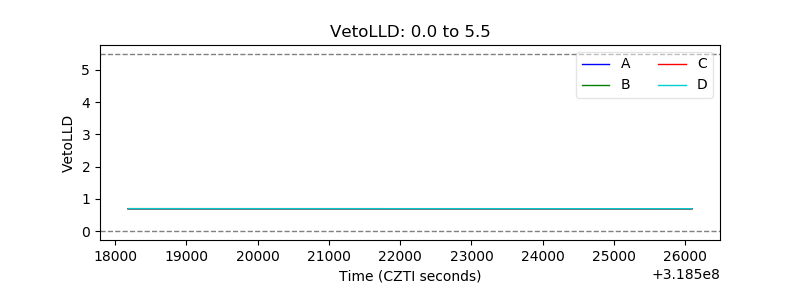 |
| Alpha Counter |  |
| _CPM_Rate | 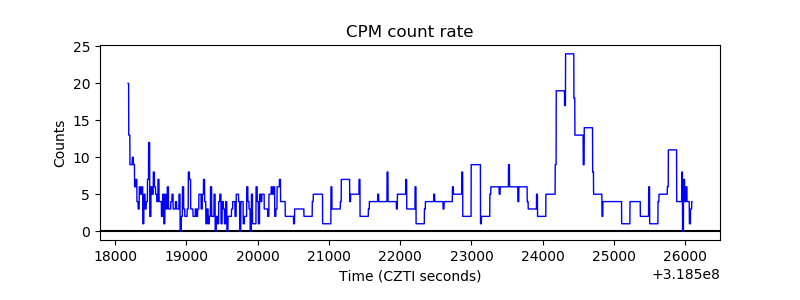 |
| CZT Counter | 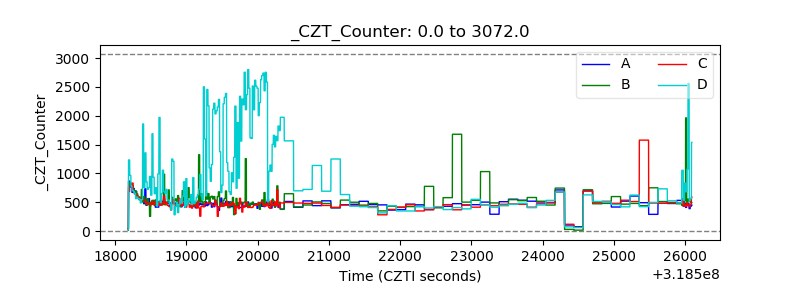 |
| +2.5 Volts monitor | 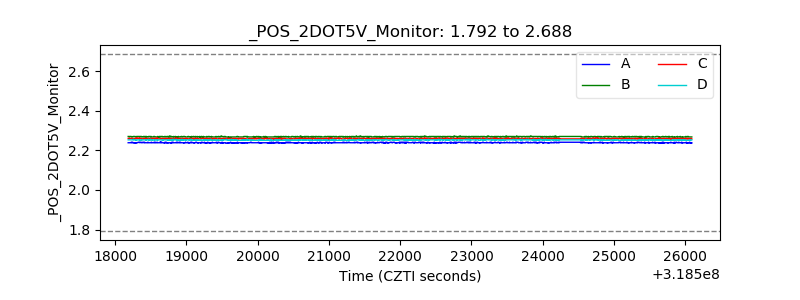 |
| +5 Volts monitor |  |
| _ROLL_ROT | 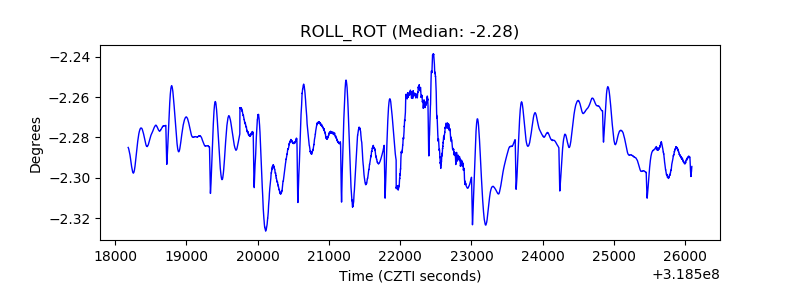 |
| _Roll_DEC | 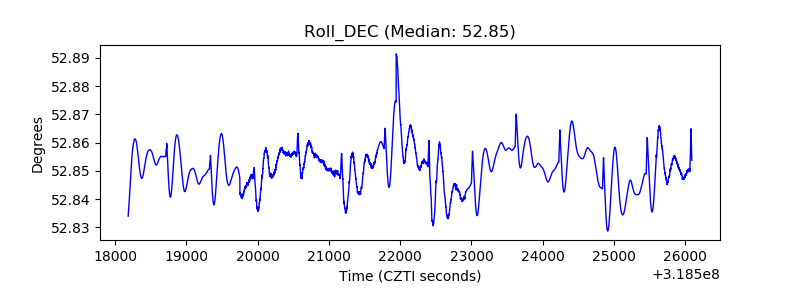 |
| _Roll_RA | 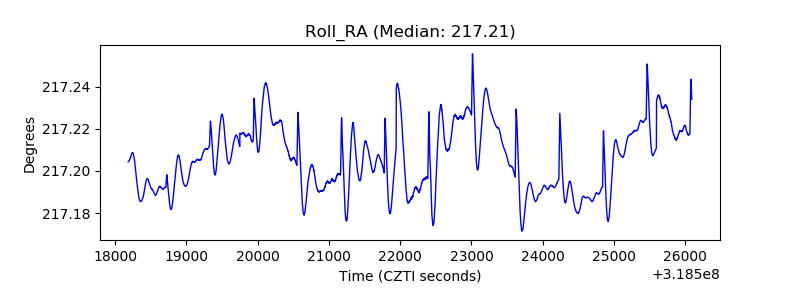 |
| Veto Counter | 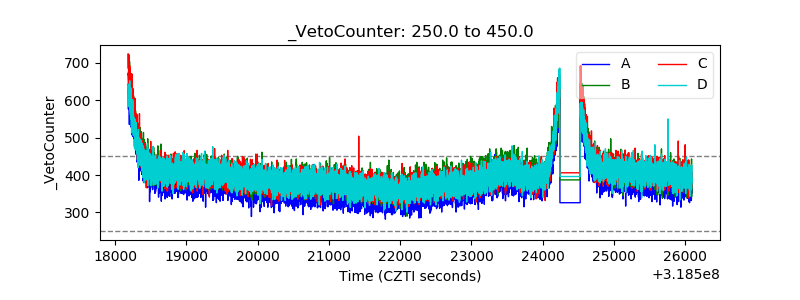 |