| Param | Original file | Final file |
|---|---|---|
| Filename | modeM0/AS1A07_011T01_9000003482_23544cztM0_level2.evt | modeM0/AS1A07_011T01_9000003482_23544cztM0_level2_quad_clean.evt |
| Size (bytes) | 1,292,261,760 | 230,541,120 |
| Size | 1.2 GB | 219.9 MB |
| Events in quadrant A | 8,104,488 | 1,477,600 |
| Events in quadrant B | 9,322,241 | 1,488,858 |
| Events in quadrant C | 8,280,857 | 1,445,011 |
| Events in quadrant D | 12,243,325 | 1,361,998 |
| Mode M9 | |||
|---|---|---|---|
| Quadrant | BADHDUFLAG | Total packets | Discarded packets |
| A | 0 | 19 | 0 |
| B | 0 | 20 | 1 |
| C | 0 | 20 | 1 |
| D | 0 | 19 | 0 |
| Mode SS | |||
|---|---|---|---|
| Quadrant | BADHDUFLAG | Total packets | Discarded packets |
| A | 0 | 368 | 8 |
| B | 0 | 367 | 5 |
| C | 0 | 369 | 11 |
| D | 0 | 366 | 4 |
| Mode M0 | |||
|---|---|---|---|
| Quadrant | BADHDUFLAG | Total packets | Discarded packets |
| A | 0 | 36596 | 817 |
| B | 0 | 40021 | 894 |
| C | 0 | 36861 | 811 |
| D | 0 | 49789 | 1182 |
| Quadrant | Total seconds | Saturated seconds | Saturation percentage |
|---|---|---|---|
| A | 17527 | 126 | 0.718891% |
| B | 17514 | 316 | 1.804271% |
| C | 17531 | 253 | 1.443158% |
| D | 17520 | 1276 | 7.283105% |
Noise dominated data is calculated using 1-second bins in cleaned event files. If a bin has >2000 counts, and if more than 50% of those come from <1% of pixels, then it is considered to be noise-dominated and hence unusable.
| Quadrant | # 1 sec bins | Bins with >0 counts | Bins with >2000 counts | High rate bins dominated by noise | Noise dominated (total time) | Noise dominated (detector-on time) | Marked lightcurve |
|---|---|---|---|---|---|---|---|
| A | 20359 | 17562 | 2 | 2 | 0.01% | 0.01% | 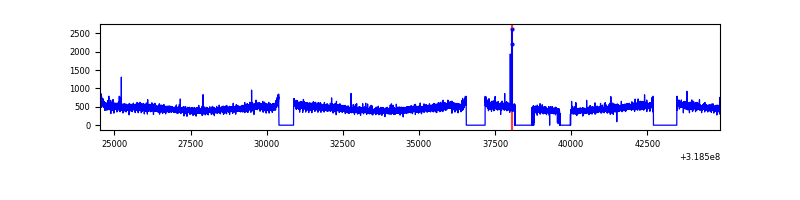 |
| B | 20359 | 17555 | 111 | 111 | 0.55% | 0.63% | 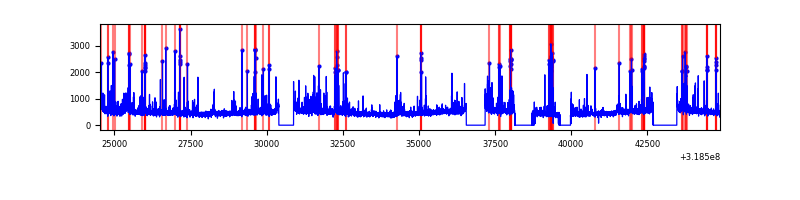 |
| C | 20359 | 17558 | 3 | 3 | 0.01% | 0.02% | 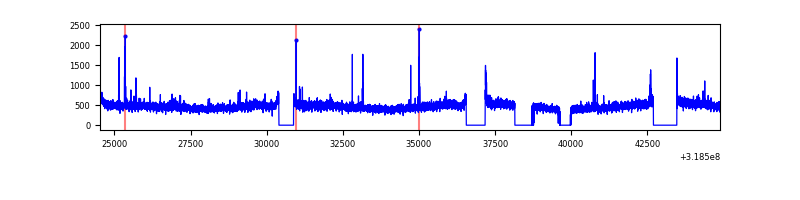 |
| D | 20359 | 17555 | 1082 | 1082 | 5.31% | 6.16% | 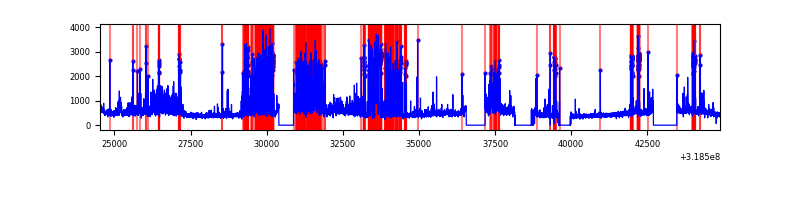 |
Top three noisy pixels from each quadrant. If the there are fewer than three noisy pixels in the level2.evt file, extra rows are filled as -1
| Pixel properties | Quadrant properties | ||||||
|---|---|---|---|---|---|---|---|
| Quadrant | DetID | PixID | Counts | Sigma | Mean | Median | Sigma |
| A | 13 | 254 | 32044 | 71.38 | 2093 | 2045 | 420.3 |
| A | 3 | 137 | 19078 | 40.53 | 2093 | 2045 | 420.3 |
| A | 0 | 226 | 17961 | 37.87 | 2093 | 2045 | 420.3 |
| B | 3 | 64 | 483716 | 1222.83 | 2071 | 2020 | 393.9 |
| B | 0 | 189 | 377781 | 953.91 | 2071 | 2020 | 393.9 |
| B | 0 | 229 | 152602 | 382.27 | 2071 | 2020 | 393.9 |
| C | 14 | 238 | 316743 | 675.61 | 2001 | 2016 | 465.8 |
| C | 7 | 247 | 79269 | 165.84 | 2001 | 2016 | 465.8 |
| C | 10 | 9 | 49793 | 102.56 | 2001 | 2016 | 465.8 |
| D | 1 | 52 | 3859139 | 8044.97 | 1973 | 1918 | 479.5 |
| D | 7 | 38 | 524806 | 1090.58 | 1973 | 1918 | 479.5 |
| D | 2 | 234 | 78216 | 159.13 | 1973 | 1918 | 479.5 |
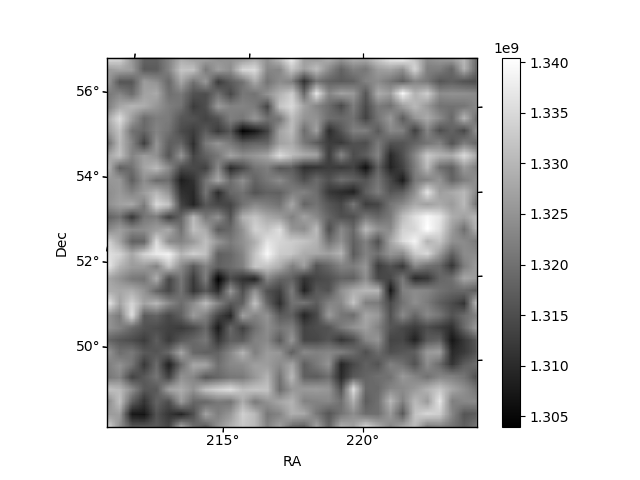
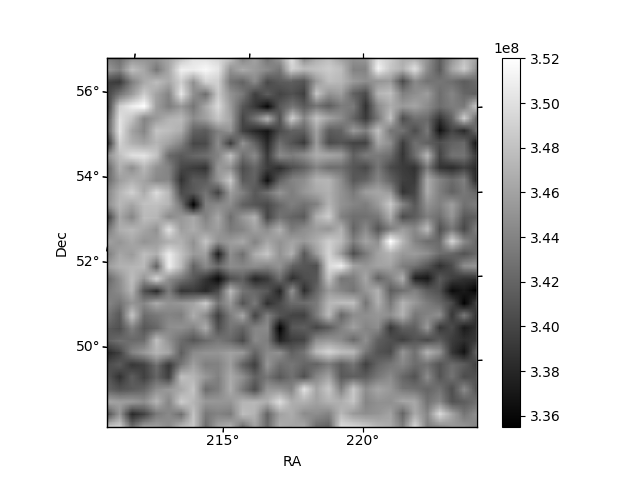
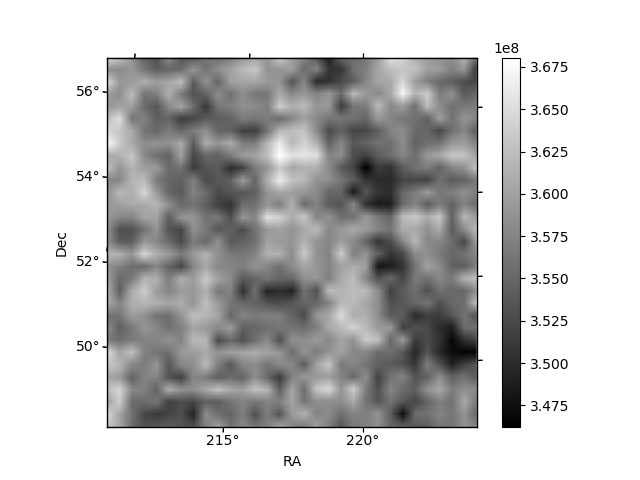
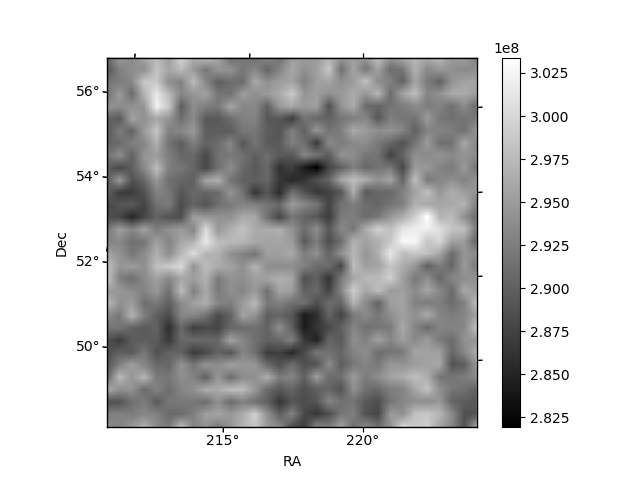
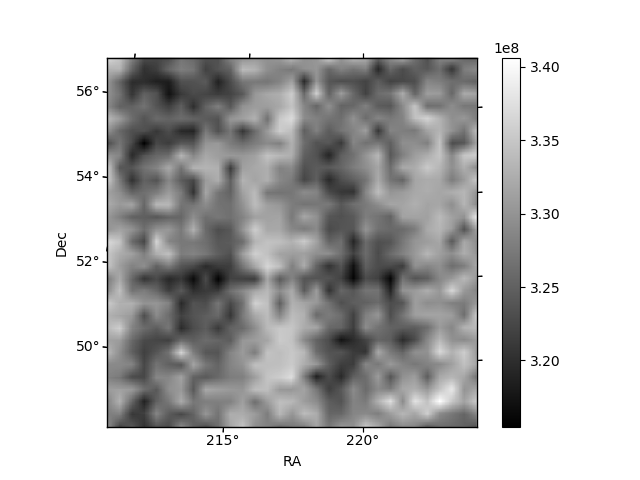
Histogram calculated using DETX and DETY for each event in the final _common_clean file
| Quadrant A | 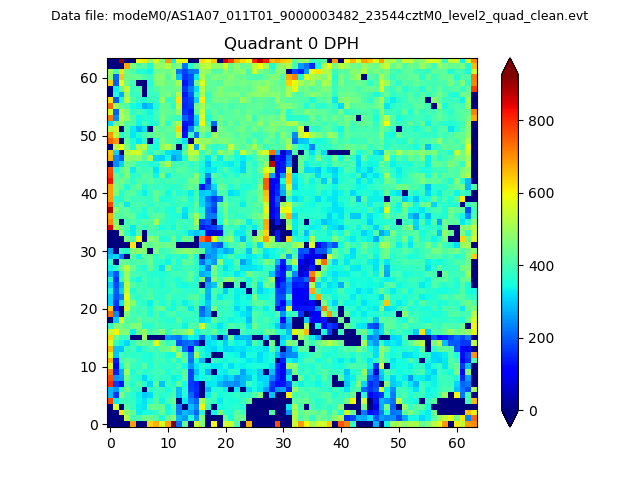 |
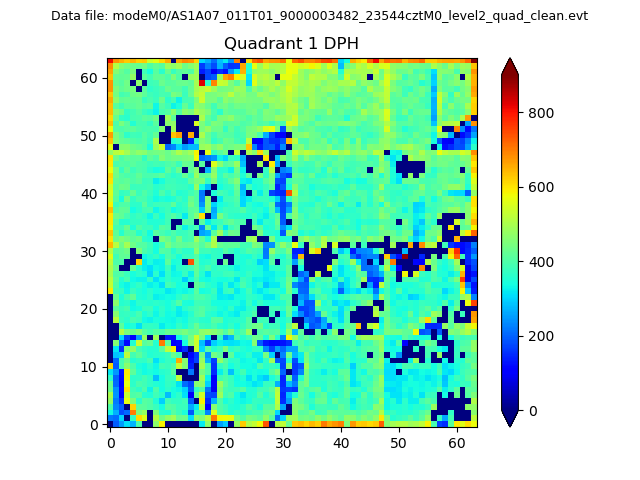 |
Quadrant B |
|---|---|---|---|
| Quadrant D | 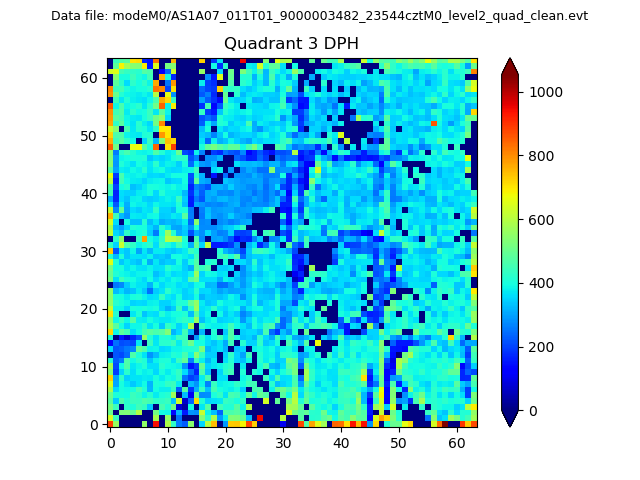 |
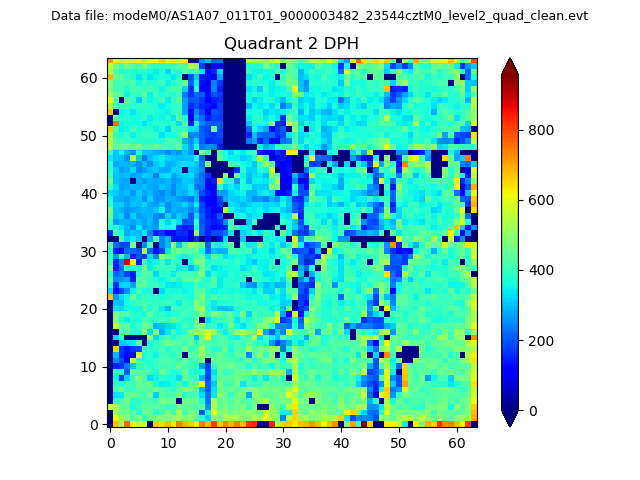 |
Quadrant C |
| Plot type | Count rate plots | Images |
|---|---|---|
| Comparison with Poisson distribution Blue bars denote a histogram of data divided into 1 sec bins. Red curve is a Poisson curve with rate = median count rate of data. |
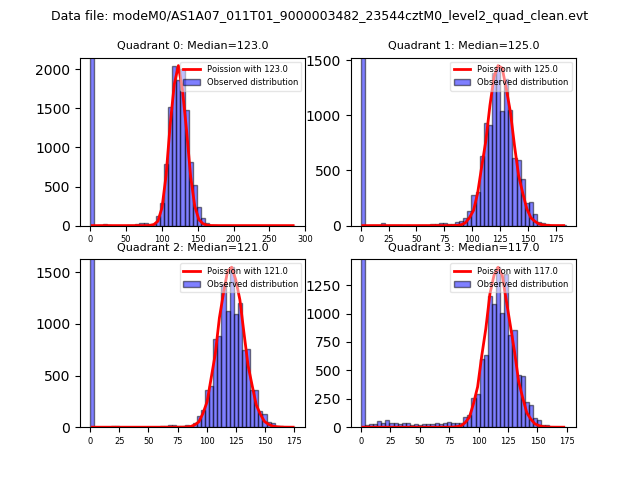 |
 |
| Quadrant-wise count rates Data is divided into 100 sec bins |
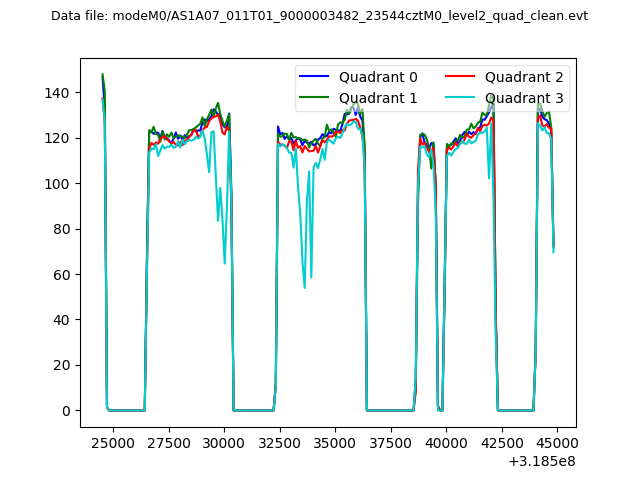 |
|
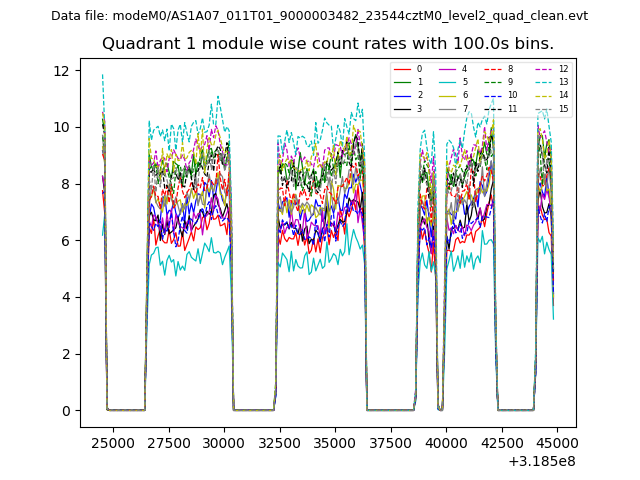
| Module-wise count rates for Quadrant A Data is divided into 100 sec bins |
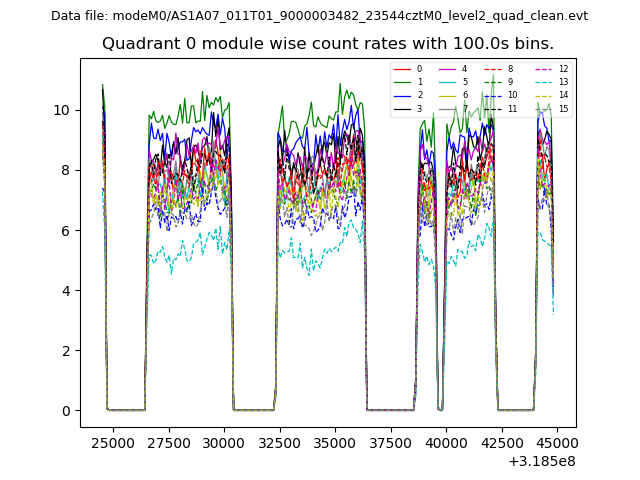 |
 |
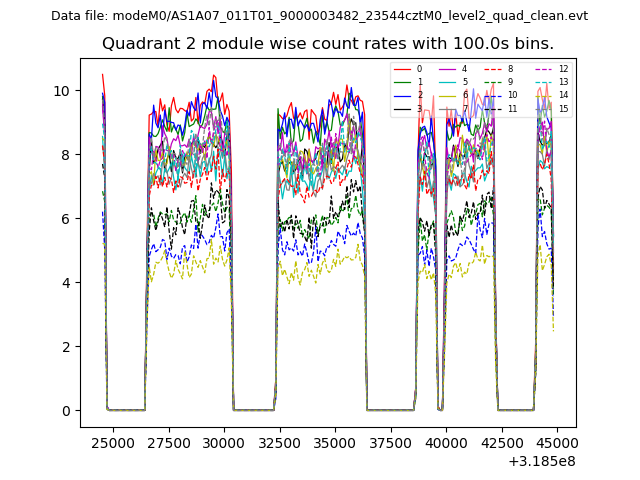
| Module-wise count rates for Quadrant B Data is divided into 100 sec bins |
 |
 |
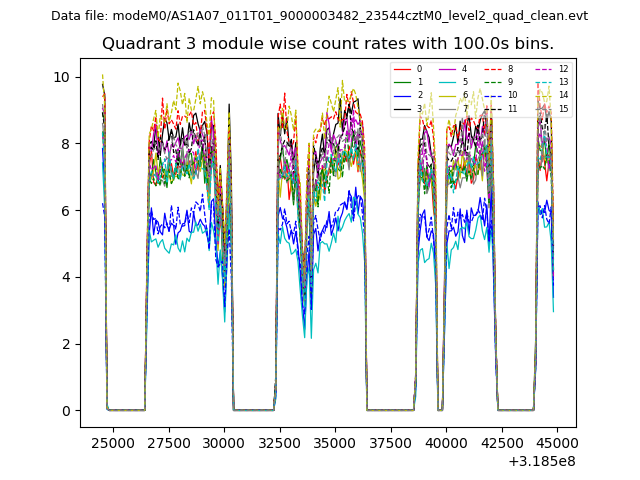
| Module-wise count rates for Quadrant C Data is divided into 100 sec bins |
 |
 |
| Module-wise count rates for Quadrant D Data is divided into 100 sec bins |
 |
 |
| Parameter | Plot |
|---|---|
| CZT HV Monitor | 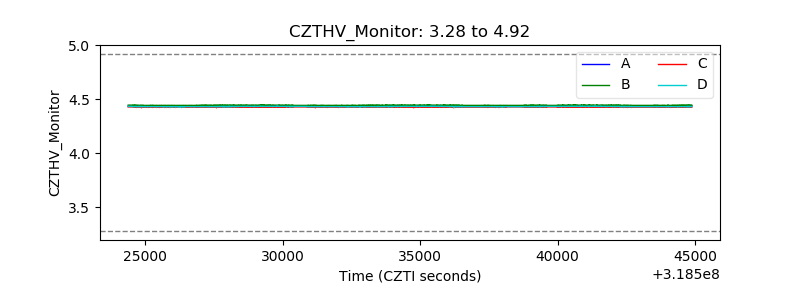 |
| D_VDD | 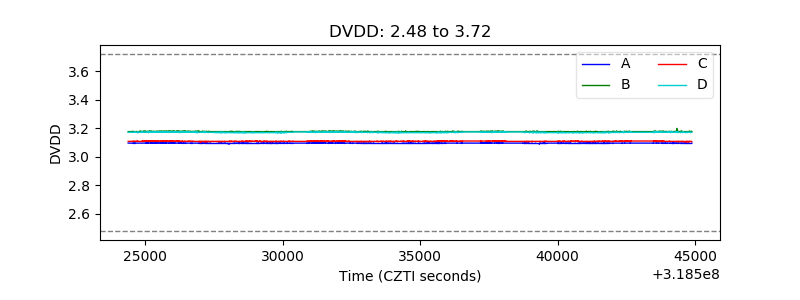 |
| Temperature 1 | 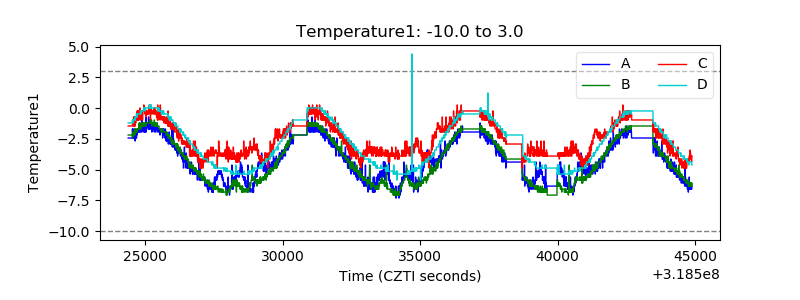 |
| Veto HV Monitor | 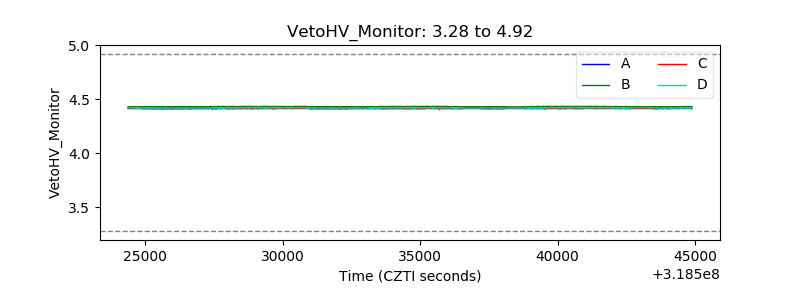 |
| Veto LLD | 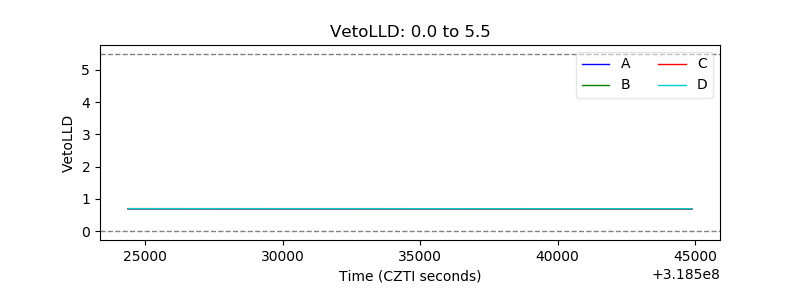 |
| Alpha Counter | 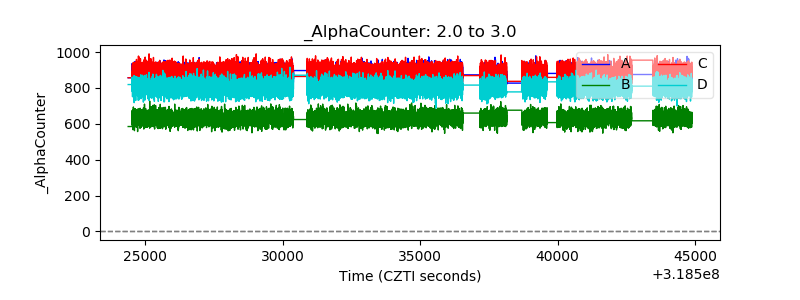 |
| _CPM_Rate | 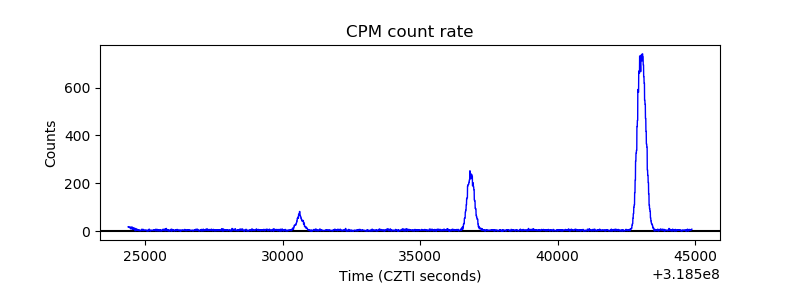 |
| CZT Counter | 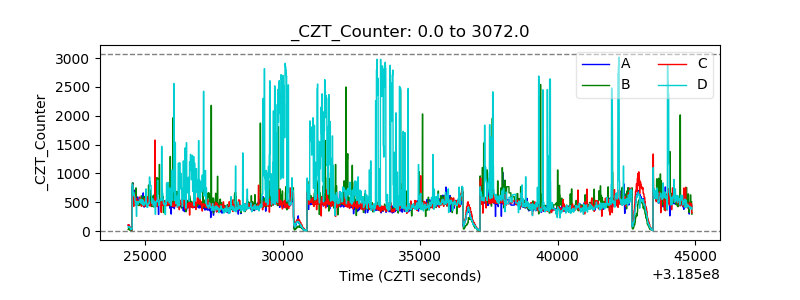 |
| +2.5 Volts monitor |  |
| +5 Volts monitor |  |
| _ROLL_ROT | 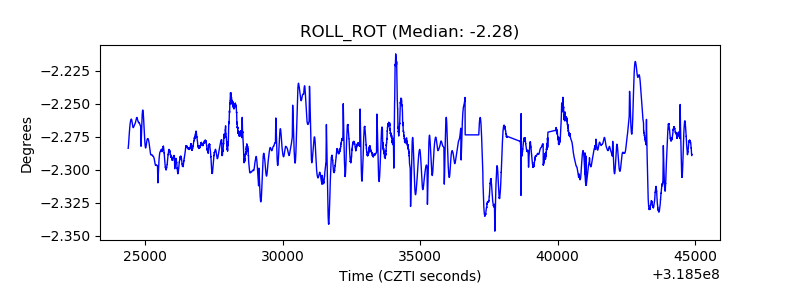 |
| _Roll_DEC | 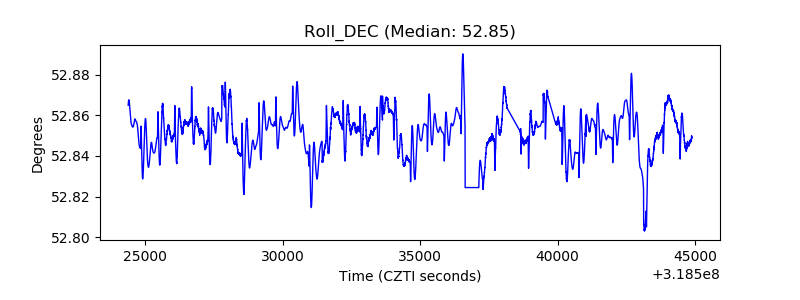 |
| _Roll_RA | 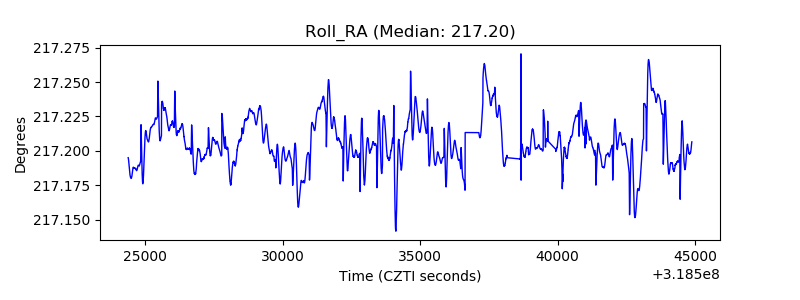 |
| Veto Counter | 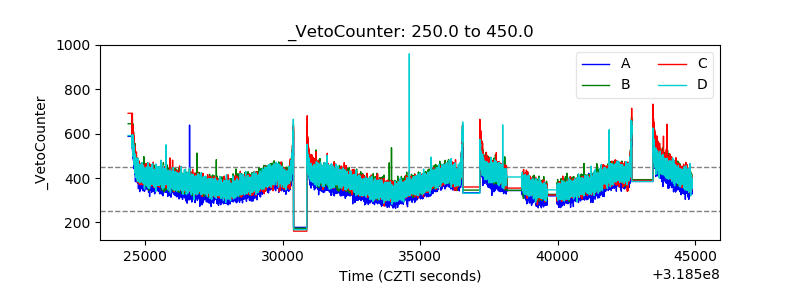 |