| Param | Original file | Final file |
|---|---|---|
| Filename | modeM0/AS1A07_011T01_9000003482_23545cztM0_level2.evt | modeM0/AS1A07_011T01_9000003482_23545cztM0_level2_quad_clean.evt |
| Size (bytes) | 434,767,680 | 100,267,200 |
| Size | 414.6 MB | 95.6 MB |
| Events in quadrant A | 3,017,691 | 651,050 |
| Events in quadrant B | 3,393,902 | 660,014 |
| Events in quadrant C | 3,128,963 | 641,395 |
| Events in quadrant D | 3,184,891 | 631,290 |
| Mode M9 | |||
|---|---|---|---|
| Quadrant | BADHDUFLAG | Total packets | Discarded packets |
| A | 0 | 6 | 1 |
| B | 0 | 6 | 1 |
| C | 0 | 6 | 0 |
| D | 0 | 5 | 0 |
| Mode SS | |||
|---|---|---|---|
| Quadrant | BADHDUFLAG | Total packets | Discarded packets |
| A | 0 | 132 | 0 |
| B | 0 | 133 | 1 |
| C | 0 | 132 | 0 |
| D | 0 | 132 | 0 |
| Mode M0 | |||
|---|---|---|---|
| Quadrant | BADHDUFLAG | Total packets | Discarded packets |
| A | 0 | 13253 | 28 |
| B | 0 | 14459 | 26 |
| C | 0 | 13505 | 20 |
| D | 0 | 14105 | 26 |
| Quadrant | Total seconds | Saturated seconds | Saturation percentage |
|---|---|---|---|
| A | 6492 | 6 | 0.092421% |
| B | 6494 | 79 | 1.216508% |
| C | 6495 | 53 | 0.816012% |
| D | 6493 | 58 | 0.893270% |
Noise dominated data is calculated using 1-second bins in cleaned event files. If a bin has >2000 counts, and if more than 50% of those come from <1% of pixels, then it is considered to be noise-dominated and hence unusable.
| Quadrant | # 1 sec bins | Bins with >0 counts | Bins with >2000 counts | High rate bins dominated by noise | Noise dominated (total time) | Noise dominated (detector-on time) | Marked lightcurve |
|---|---|---|---|---|---|---|---|
| A | 7545 | 6497 | 0 | 0 | 0.00% | 0.00% | 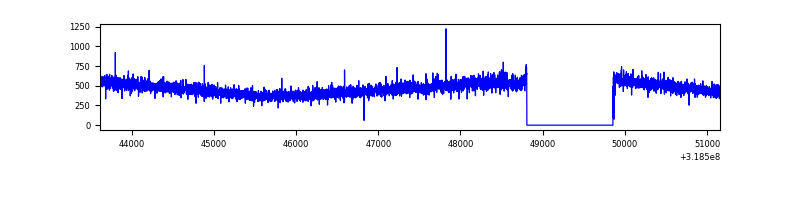 |
| B | 7545 | 6495 | 38 | 38 | 0.50% | 0.59% | 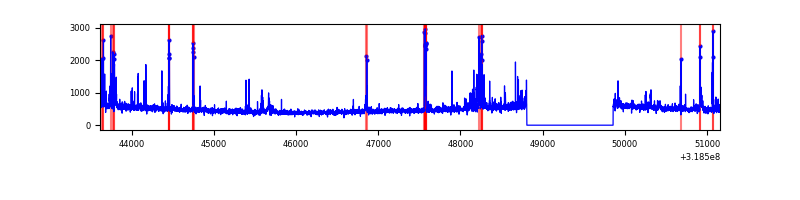 |
| C | 7545 | 6495 | 0 | 0 | 0.00% | 0.00% | 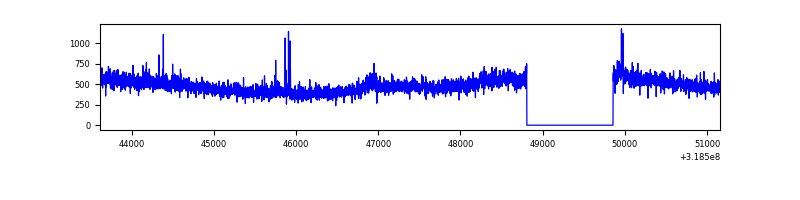 |
| D | 7545 | 6495 | 53 | 53 | 0.70% | 0.82% | 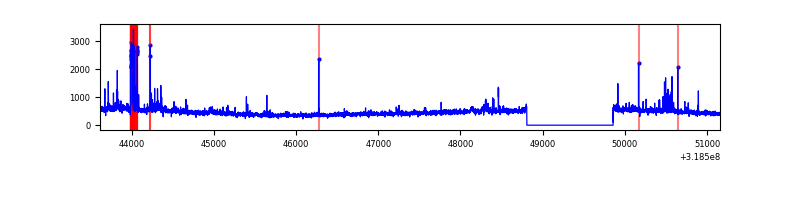 |
Top three noisy pixels from each quadrant. If the there are fewer than three noisy pixels in the level2.evt file, extra rows are filled as -1
| Pixel properties | Quadrant properties | ||||||
|---|---|---|---|---|---|---|---|
| Quadrant | DetID | PixID | Counts | Sigma | Mean | Median | Sigma |
| A | 13 | 252 | 43905 | 277.21 | 770 | 753 | 155.7 |
| A | 13 | 254 | 11460 | 68.78 | 770 | 753 | 155.7 |
| A | 3 | 137 | 6973 | 39.96 | 770 | 753 | 155.7 |
| B | 3 | 64 | 171607 | 1148.16 | 769 | 749 | 148.8 |
| B | 0 | 189 | 122663 | 819.26 | 769 | 749 | 148.8 |
| B | 14 | 207 | 41490 | 273.78 | 769 | 749 | 148.8 |
| C | 14 | 238 | 120186 | 687.5 | 744 | 748 | 173.7 |
| C | 10 | 91 | 62141 | 353.39 | 744 | 748 | 173.7 |
| C | 7 | 247 | 32340 | 181.85 | 744 | 748 | 173.7 |
| D | 1 | 52 | 218515 | 1189.58 | 748 | 727 | 183.1 |
| D | 9 | 85 | 36642 | 196.17 | 748 | 727 | 183.1 |
| D | 2 | 234 | 28492 | 151.65 | 748 | 727 | 183.1 |
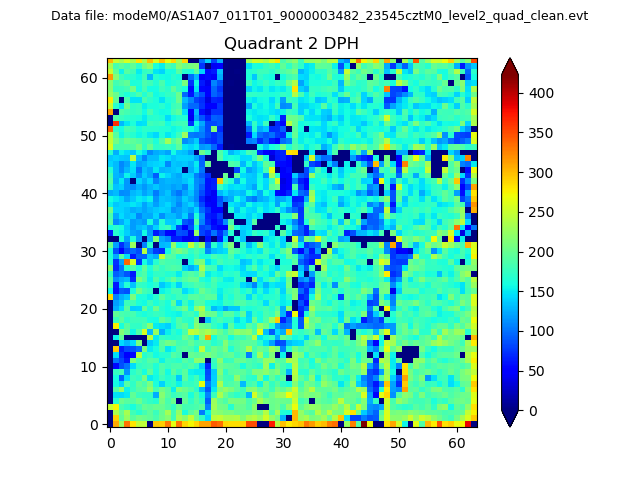
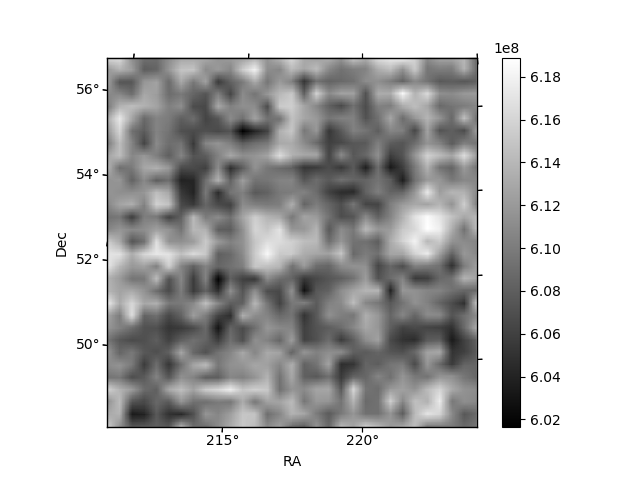
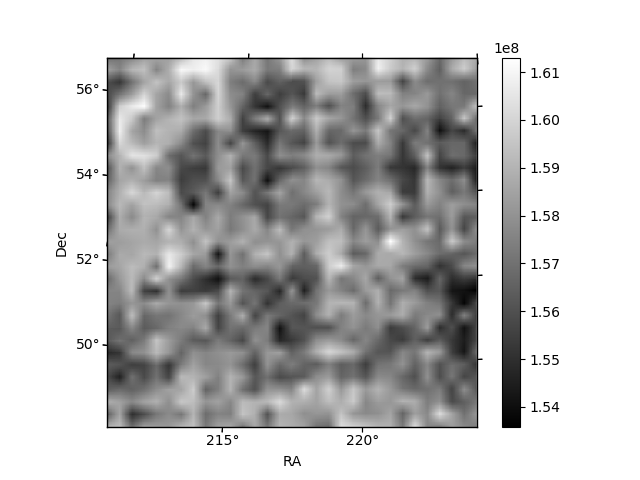
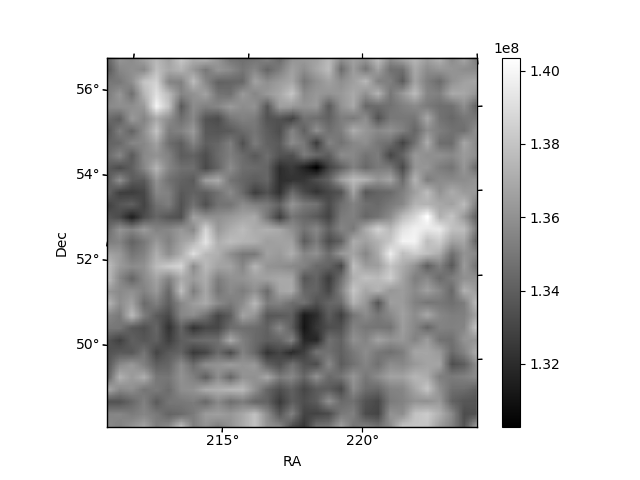
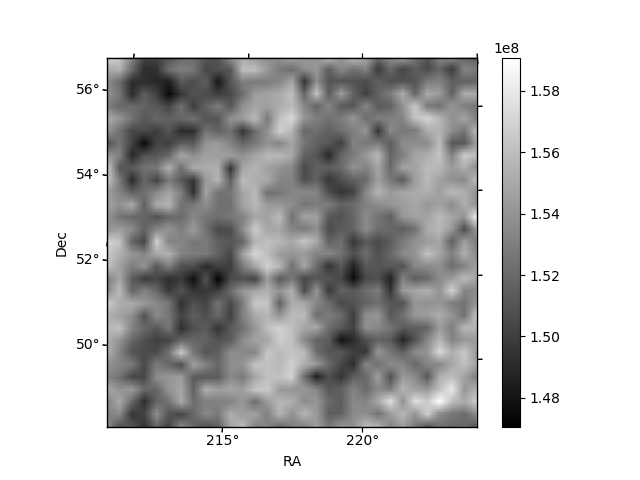
Histogram calculated using DETX and DETY for each event in the final _common_clean file
| Quadrant A | 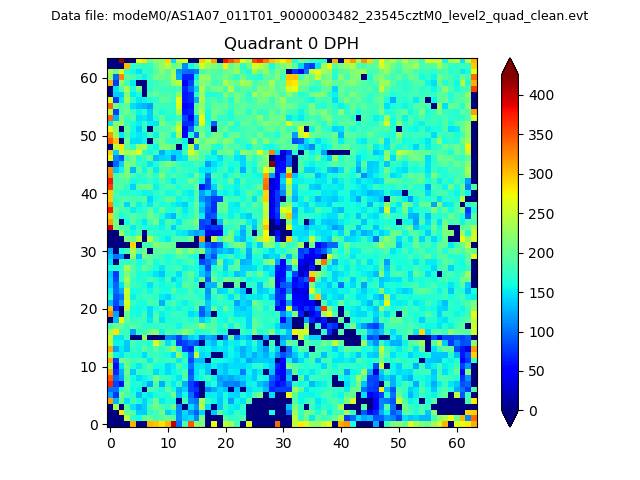 |
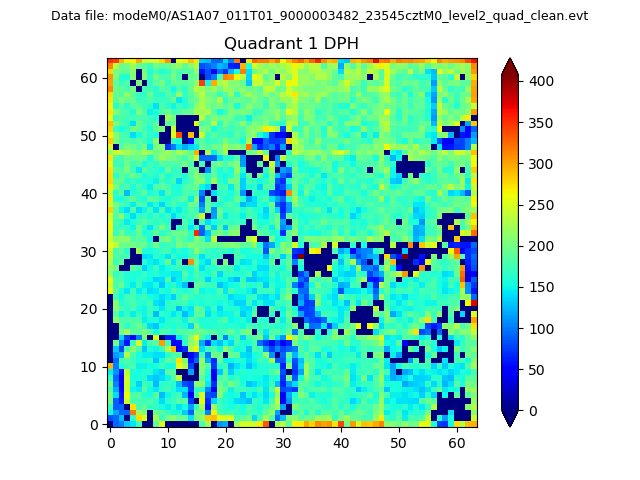 |
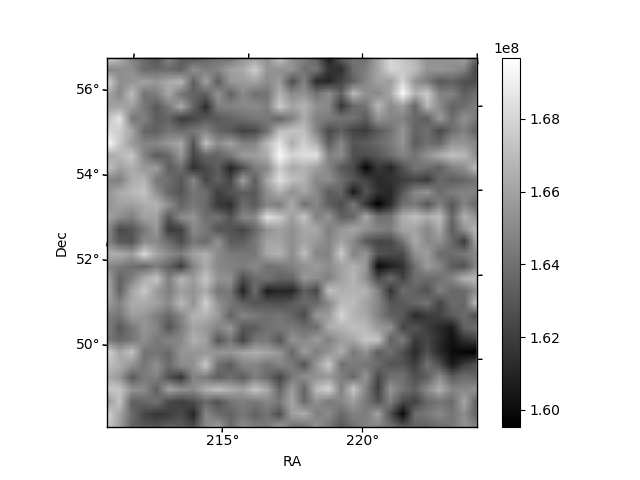
Quadrant B |
|---|---|---|---|
| Quadrant D | 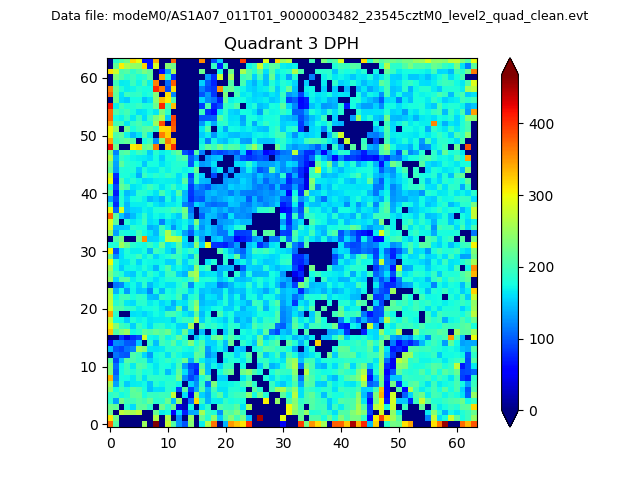 |
 |
Quadrant C |
| Plot type | Count rate plots | Images |
|---|---|---|
| Comparison with Poisson distribution Blue bars denote a histogram of data divided into 1 sec bins. Red curve is a Poisson curve with rate = median count rate of data. |
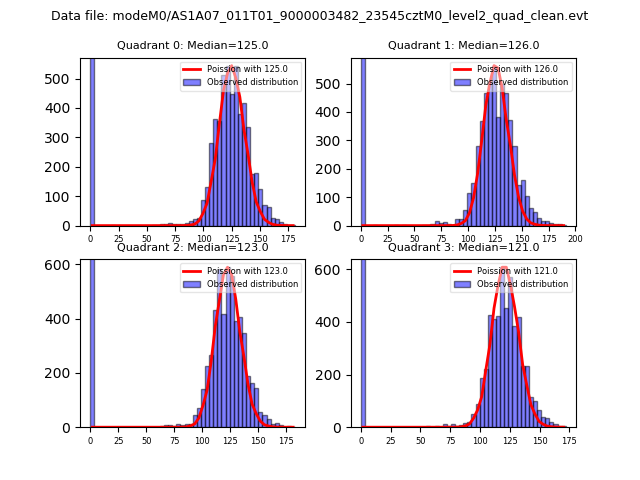 |
 |
| Quadrant-wise count rates Data is divided into 100 sec bins |
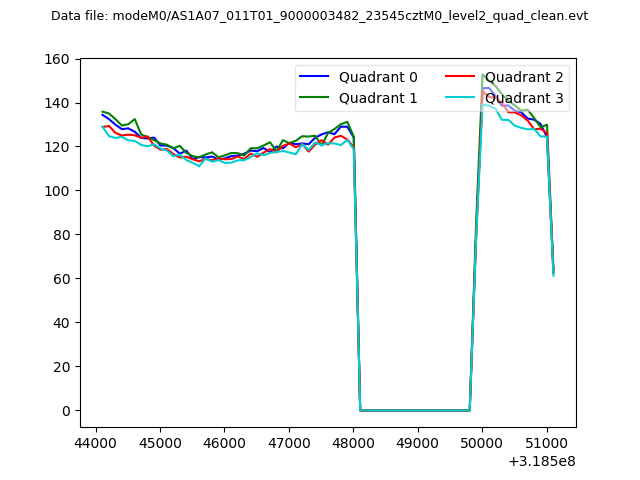 |
|
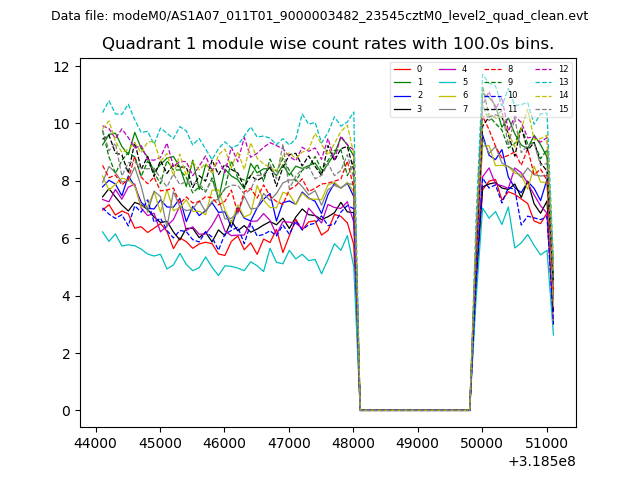
| Module-wise count rates for Quadrant A Data is divided into 100 sec bins |
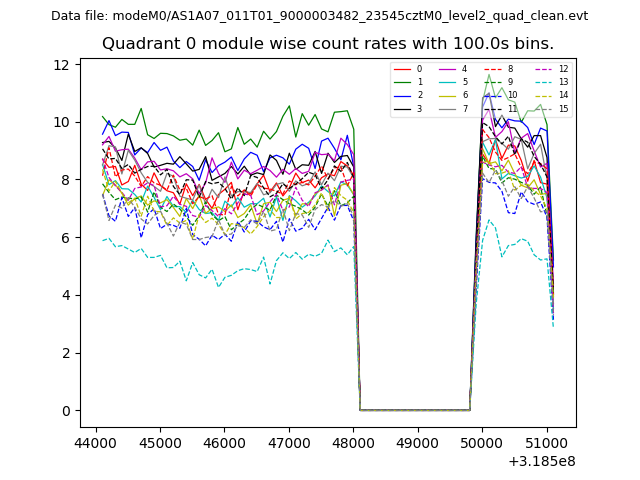 |
 |
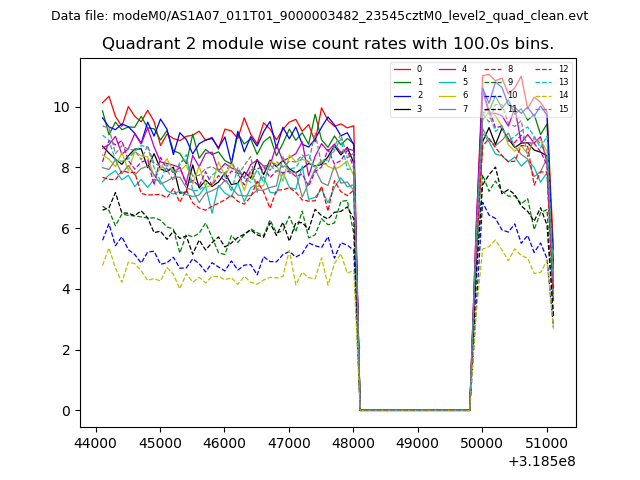
| Module-wise count rates for Quadrant B Data is divided into 100 sec bins |
 |
 |
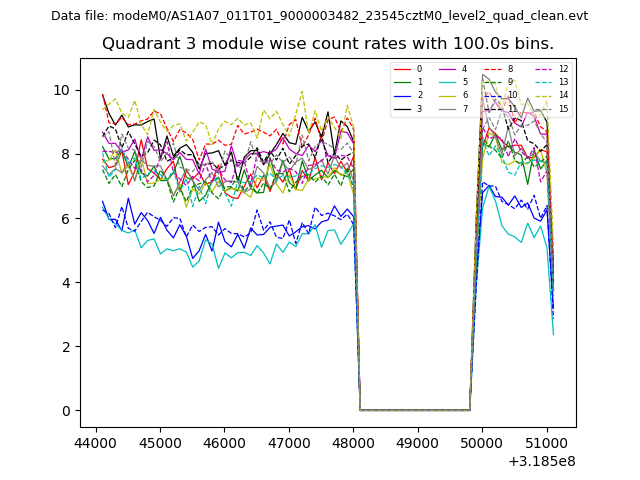
| Module-wise count rates for Quadrant C Data is divided into 100 sec bins |
 |
 |
| Module-wise count rates for Quadrant D Data is divided into 100 sec bins |
 |
 |
| Parameter | Plot |
|---|---|
| CZT HV Monitor | 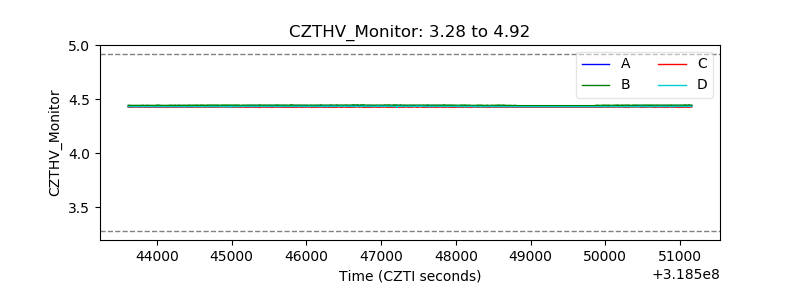 |
| D_VDD | 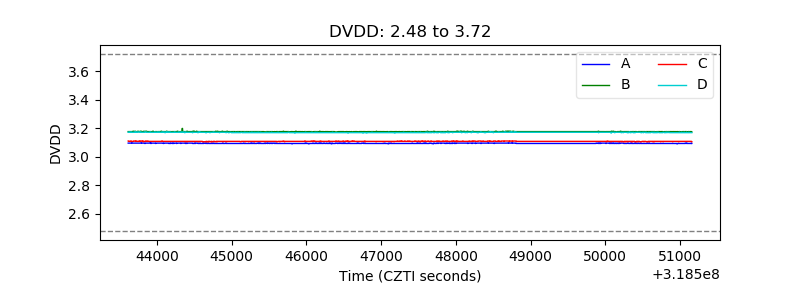 |
| Temperature 1 | 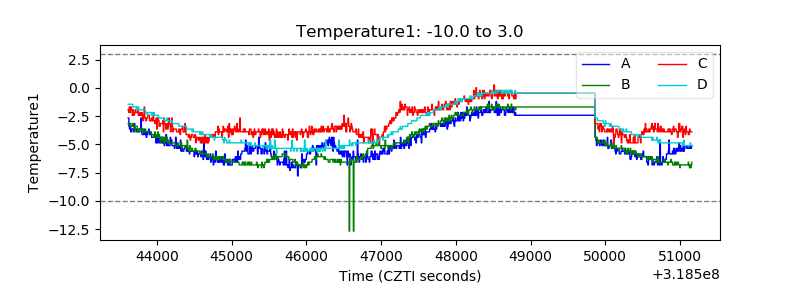 |
| Veto HV Monitor | 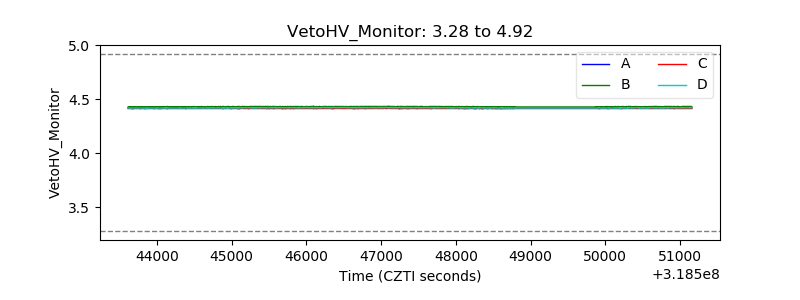 |
| Veto LLD | 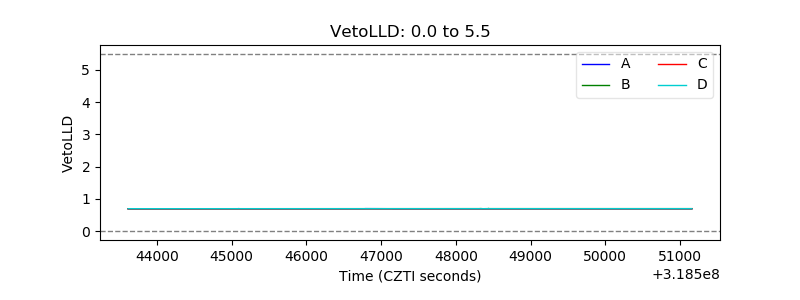 |
| Alpha Counter | 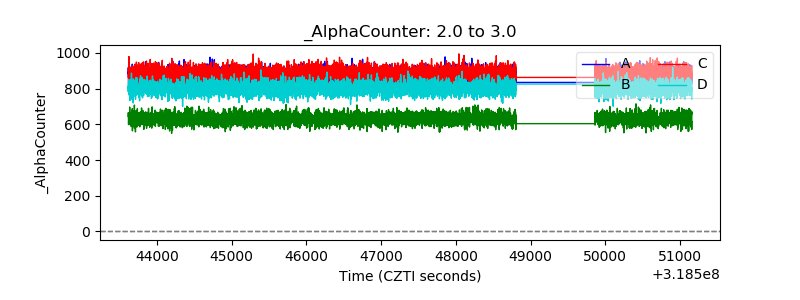 |
| _CPM_Rate | 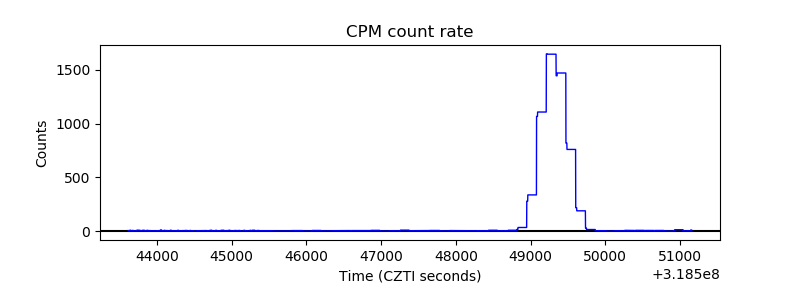 |
| CZT Counter | 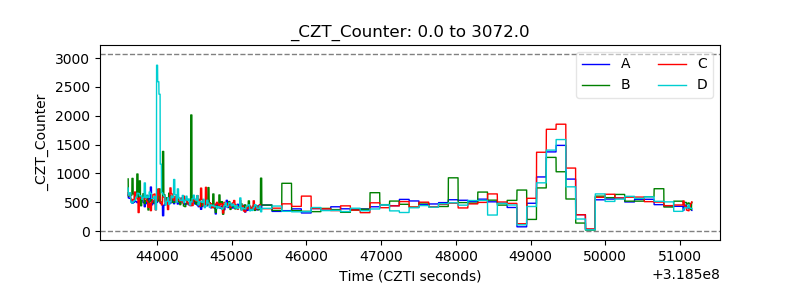 |
| +2.5 Volts monitor |  |
| +5 Volts monitor |  |
| _ROLL_ROT | 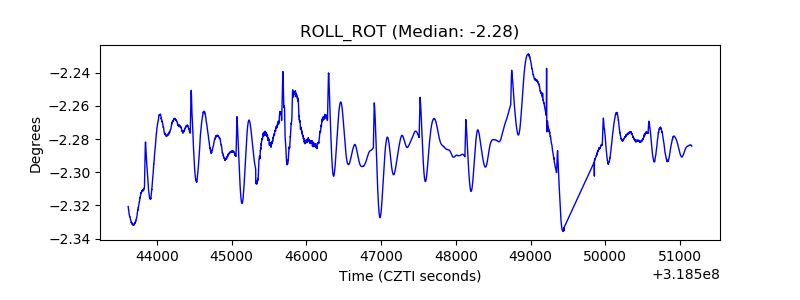 |
| _Roll_DEC | 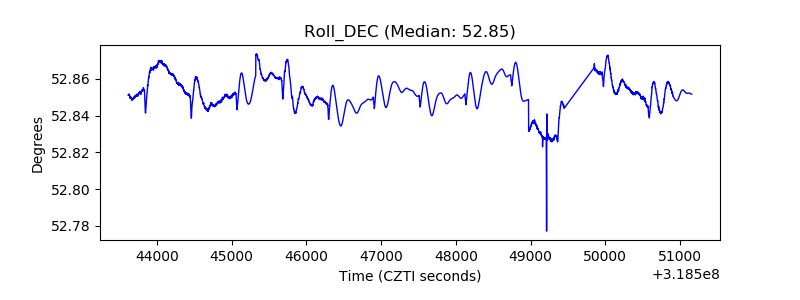 |
| _Roll_RA | 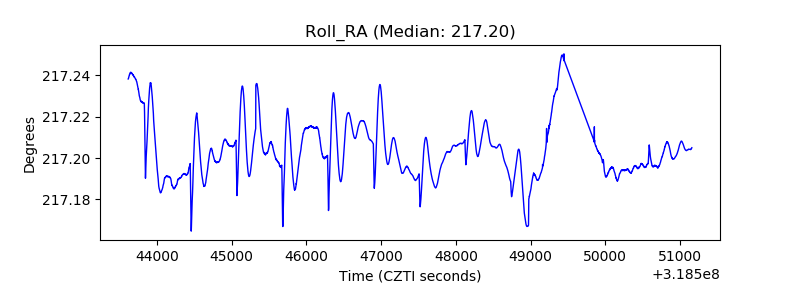 |
| Veto Counter | 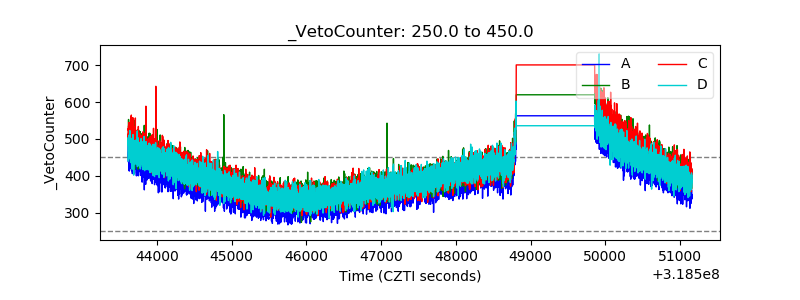 |