| Param | Original file | Final file |
|---|---|---|
| Filename | modeM0/AS1A07_011T01_9000003482_23548cztM0_level2.evt | modeM0/AS1A07_011T01_9000003482_23548cztM0_level2_quad_clean.evt |
| Size (bytes) | 553,844,160 | 104,169,600 |
| Size | 528.2 MB | 99.3 MB |
| Events in quadrant A | 3,503,492 | 674,487 |
| Events in quadrant B | 3,837,282 | 698,604 |
| Events in quadrant C | 3,545,098 | 664,801 |
| Events in quadrant D | 5,403,376 | 620,101 |
| Mode M9 | |||
|---|---|---|---|
| Quadrant | BADHDUFLAG | Total packets | Discarded packets |
| A | 0 | 23 | 1 |
| B | 0 | 24 | 2 |
| C | 0 | 24 | 1 |
| D | 0 | 23 | 1 |
| Mode SS | |||
|---|---|---|---|
| Quadrant | BADHDUFLAG | Total packets | Discarded packets |
| A | 0 | 150 | 4 |
| B | 0 | 150 | 4 |
| C | 0 | 151 | 7 |
| D | 0 | 151 | 5 |
| Mode M0 | |||
|---|---|---|---|
| Quadrant | BADHDUFLAG | Total packets | Discarded packets |
| A | 0 | 15281 | 445 |
| B | 0 | 16409 | 476 |
| C | 0 | 15654 | 517 |
| D | 0 | 22011 | 838 |
| Quadrant | Total seconds | Saturated seconds | Saturation percentage |
|---|---|---|---|
| A | 7145 | 24 | 0.335899% |
| B | 7146 | 85 | 1.189477% |
| C | 7153 | 98 | 1.370055% |
| D | 7113 | 541 | 7.605792% |
Noise dominated data is calculated using 1-second bins in cleaned event files. If a bin has >2000 counts, and if more than 50% of those come from <1% of pixels, then it is considered to be noise-dominated and hence unusable.
| Quadrant | # 1 sec bins | Bins with >0 counts | Bins with >2000 counts | High rate bins dominated by noise | Noise dominated (total time) | Noise dominated (detector-on time) | Marked lightcurve |
|---|---|---|---|---|---|---|---|
| A | 9822 | 7207 | 0 | 0 | 0.00% | 0.00% | 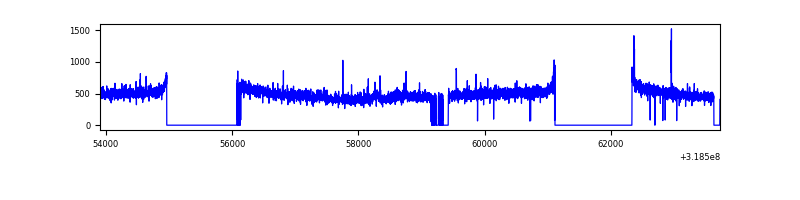 |
| B | 9820 | 7206 | 19 | 19 | 0.19% | 0.26% | 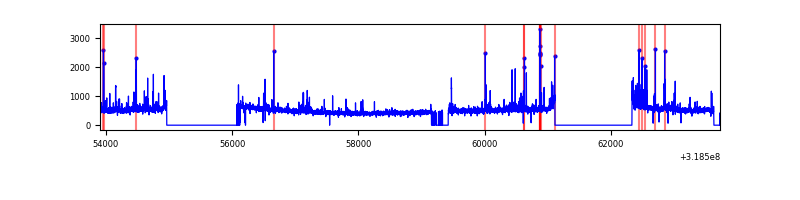 |
| C | 9821 | 7201 | 1 | 1 | 0.01% | 0.01% | 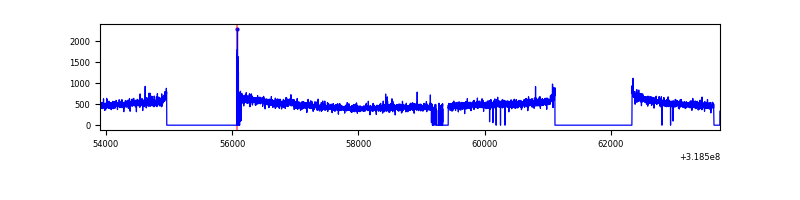 |
| D | 9820 | 7169 | 454 | 454 | 4.62% | 6.33% | 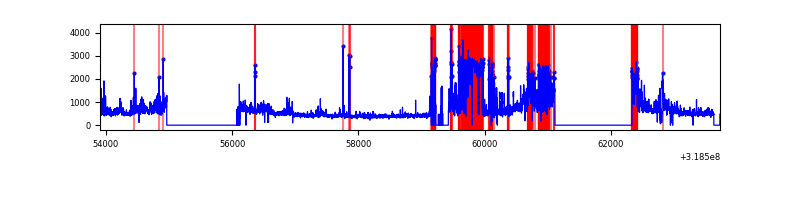 |
Top three noisy pixels from each quadrant. If the there are fewer than three noisy pixels in the level2.evt file, extra rows are filled as -1
| Pixel properties | Quadrant properties | ||||||
|---|---|---|---|---|---|---|---|
| Quadrant | DetID | PixID | Counts | Sigma | Mean | Median | Sigma |
| A | 13 | 252 | 62818 | 349.58 | 890 | 872 | 177.2 |
| A | 13 | 254 | 12593 | 66.15 | 890 | 872 | 177.2 |
| A | 8 | 31 | 9415 | 48.21 | 890 | 872 | 177.2 |
| B | 3 | 64 | 142513 | 843.52 | 893 | 872 | 167.9 |
| B | 0 | 189 | 83184 | 490.2 | 893 | 872 | 167.9 |
| B | 0 | 229 | 44427 | 259.38 | 893 | 872 | 167.9 |
| C | 14 | 238 | 138404 | 692.02 | 859 | 865 | 198.8 |
| C | 7 | 247 | 24948 | 121.17 | 859 | 865 | 198.8 |
| C | 10 | 91 | 12618 | 59.13 | 859 | 865 | 198.8 |
| D | 1 | 52 | 1861960 | 9443.83 | 823 | 802 | 197.1 |
| D | 9 | 85 | 391563 | 1982.79 | 823 | 802 | 197.1 |
| D | 2 | 234 | 29738 | 146.83 | 823 | 802 | 197.1 |
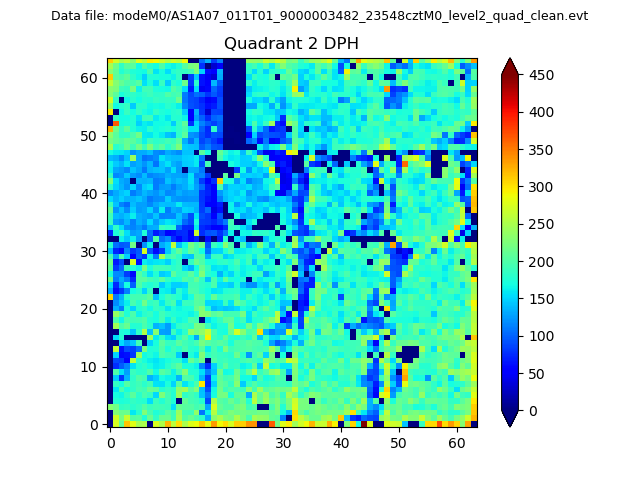
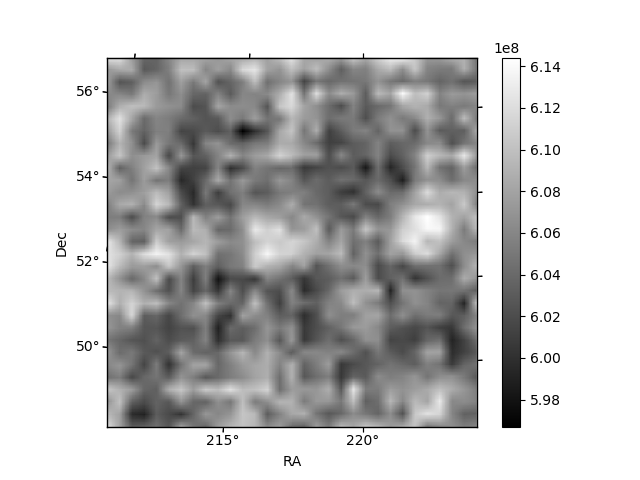
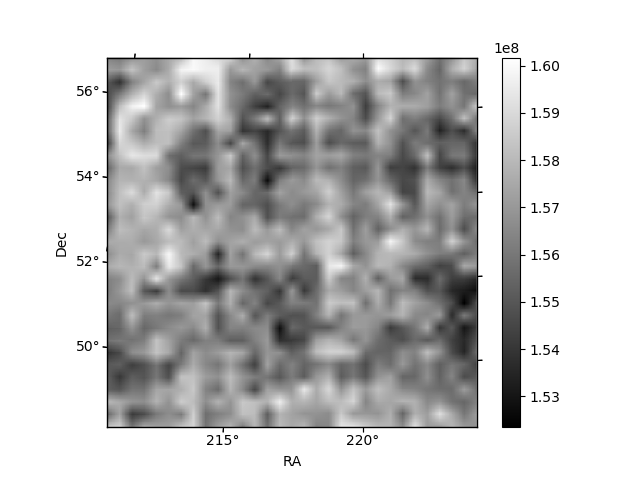
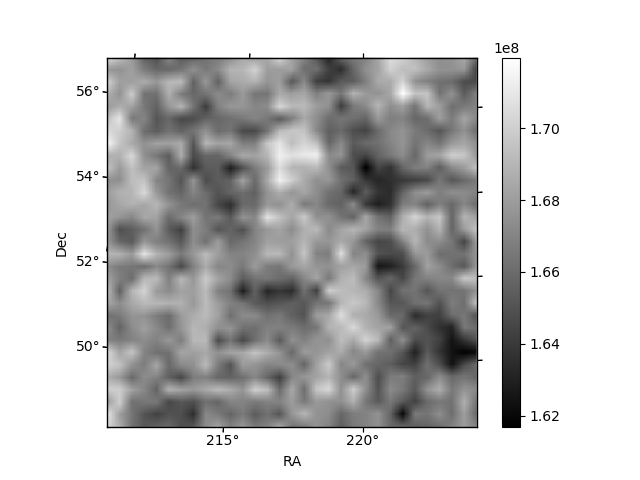
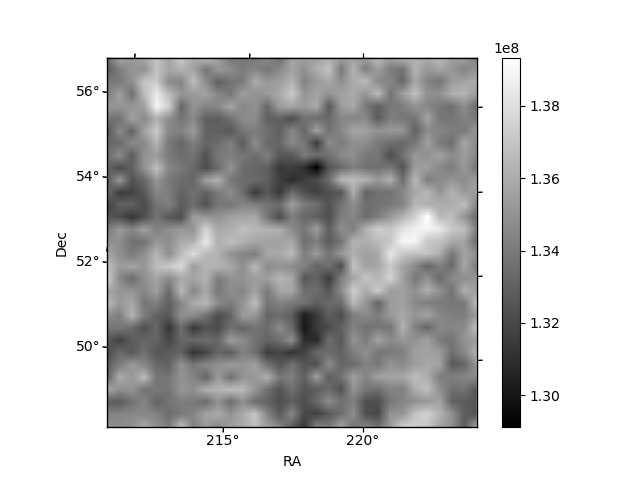
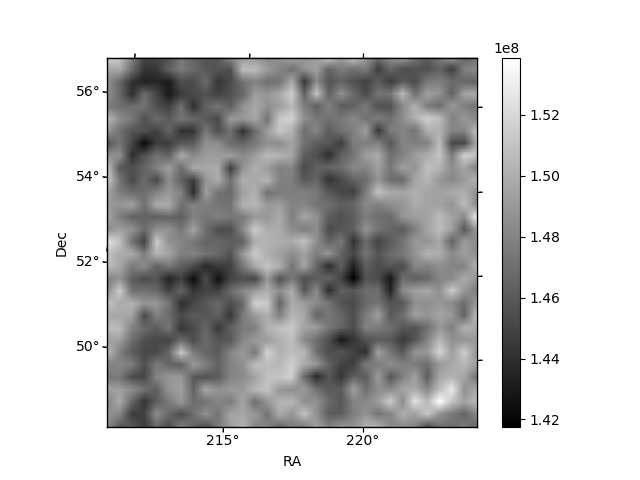
Histogram calculated using DETX and DETY for each event in the final _common_clean file
| Quadrant A | 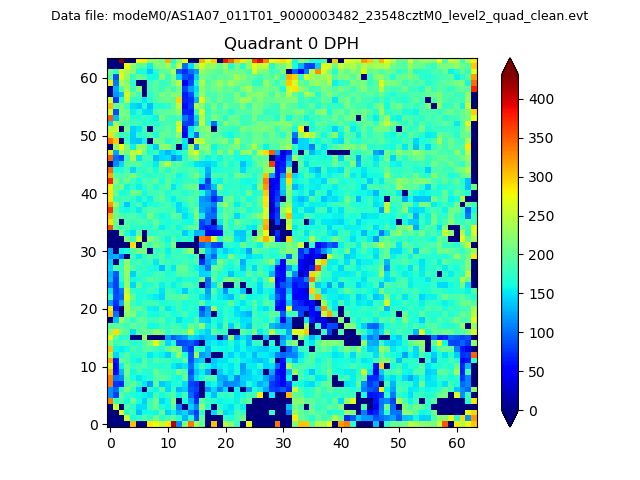 |
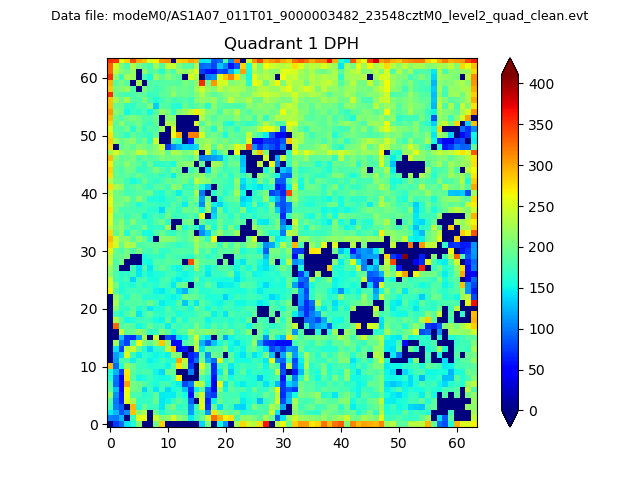 |
Quadrant B |
|---|---|---|---|
| Quadrant D | 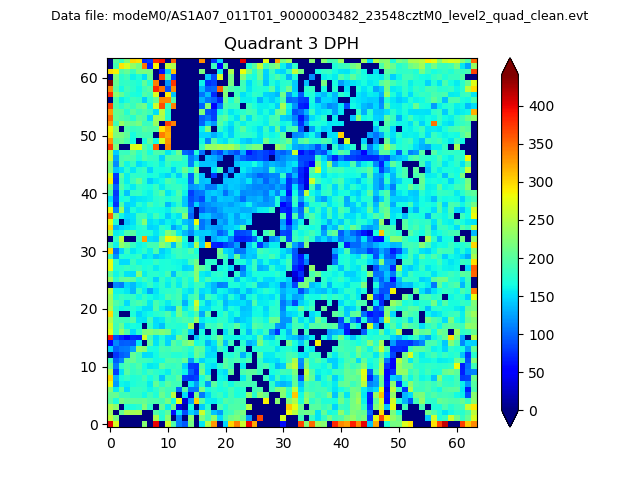 |
 |
Quadrant C |
| Plot type | Count rate plots | Images |
|---|---|---|
| Comparison with Poisson distribution Blue bars denote a histogram of data divided into 1 sec bins. Red curve is a Poisson curve with rate = median count rate of data. |
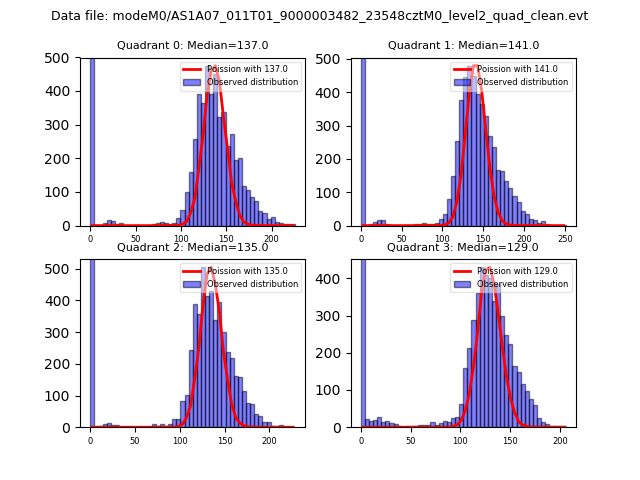 |
 |
| Quadrant-wise count rates Data is divided into 100 sec bins |
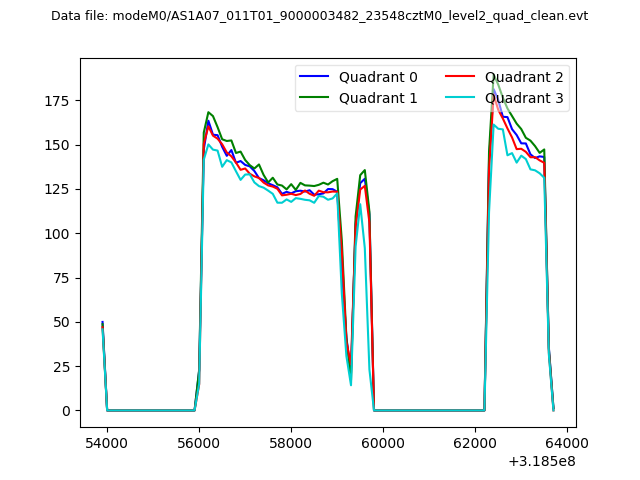 |
|
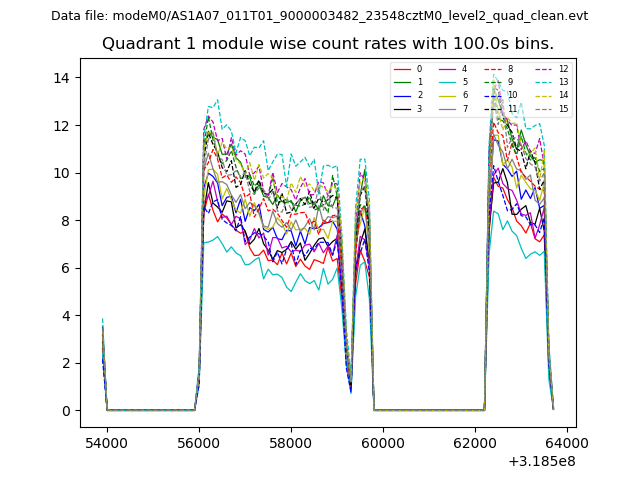
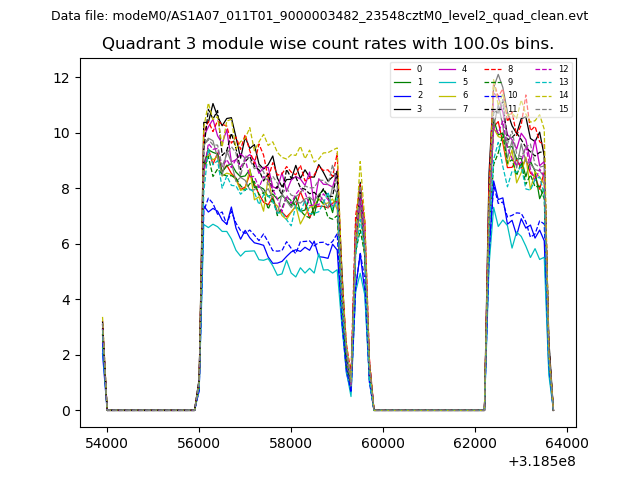
| Module-wise count rates for Quadrant A Data is divided into 100 sec bins |
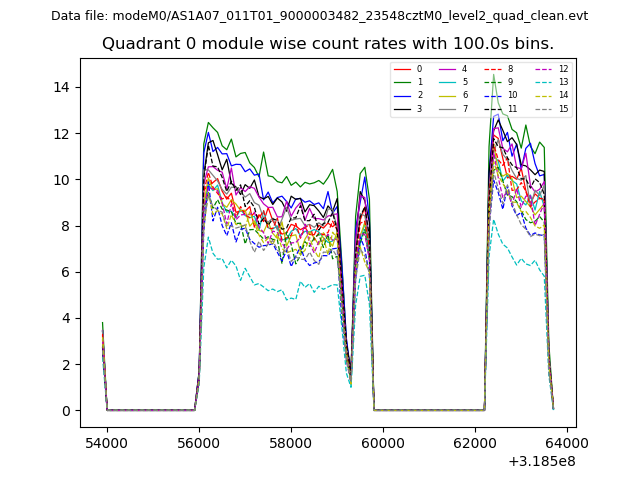 |
 |
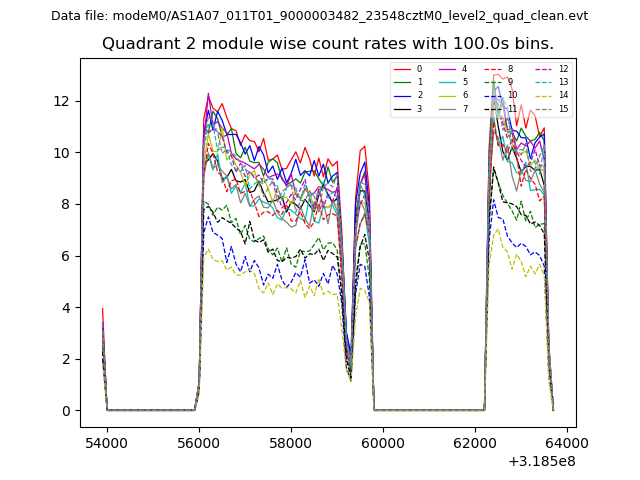
| Module-wise count rates for Quadrant B Data is divided into 100 sec bins |
 |
 |
| Module-wise count rates for Quadrant C Data is divided into 100 sec bins |
 |
 |
| Module-wise count rates for Quadrant D Data is divided into 100 sec bins |
 |
 |
| Parameter | Plot |
|---|---|
| CZT HV Monitor | 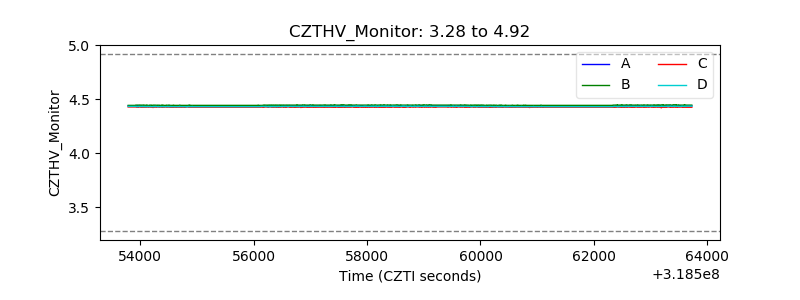 |
| D_VDD | 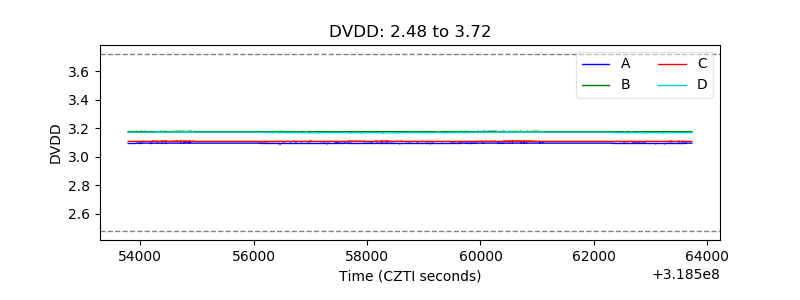 |
| Temperature 1 | 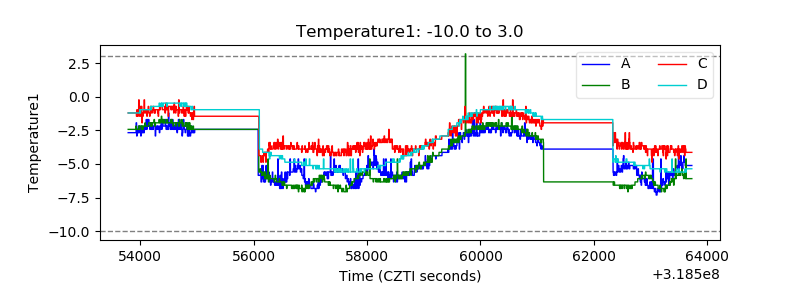 |
| Veto HV Monitor | 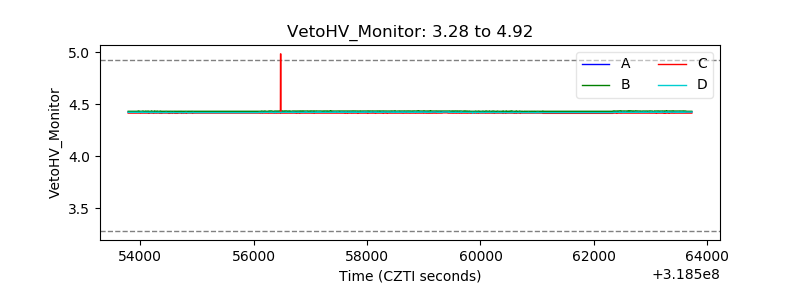 |
| Veto LLD | 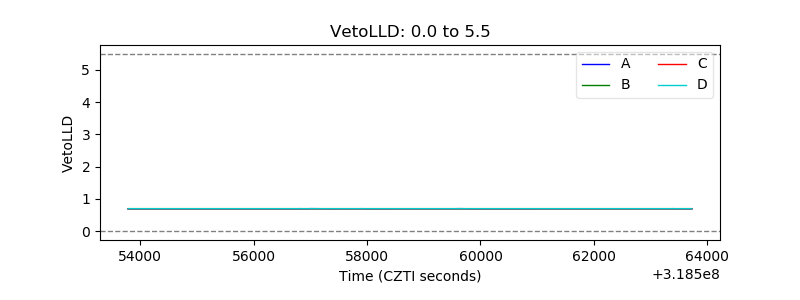 |
| Alpha Counter | 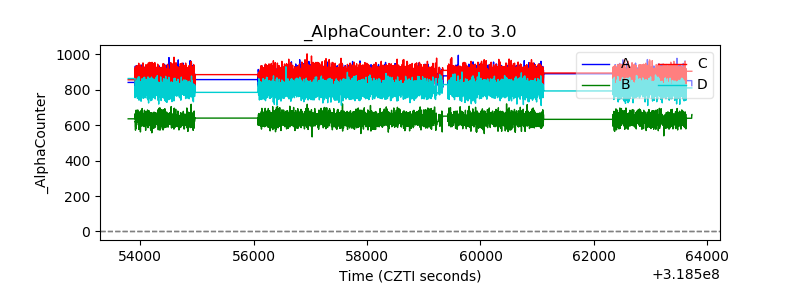 |
| _CPM_Rate | 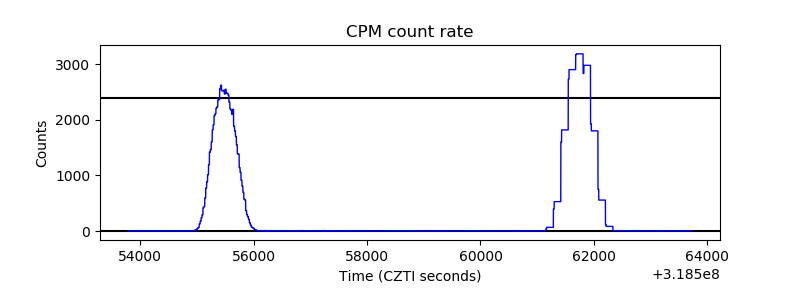 |
| CZT Counter | 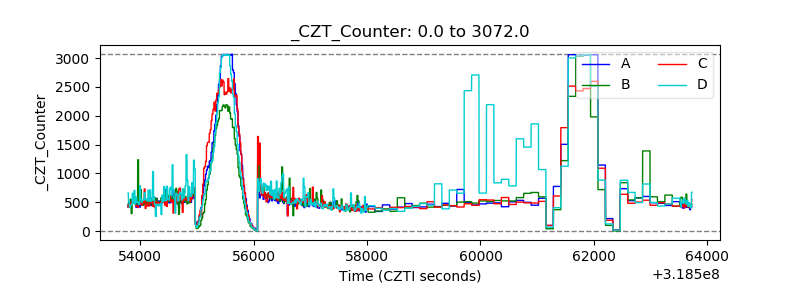 |
| +2.5 Volts monitor |  |
| +5 Volts monitor |  |
| _ROLL_ROT | 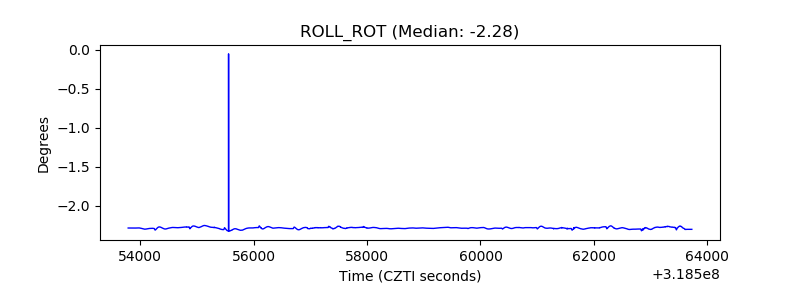 |
| _Roll_DEC | 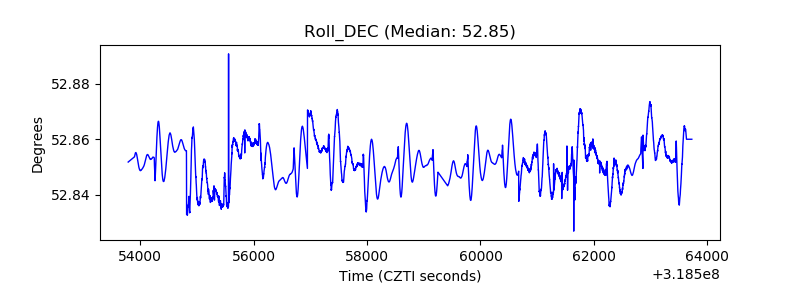 |
| _Roll_RA | 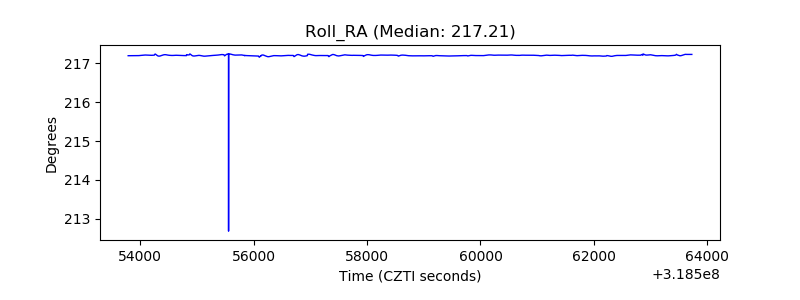 |
| Veto Counter | 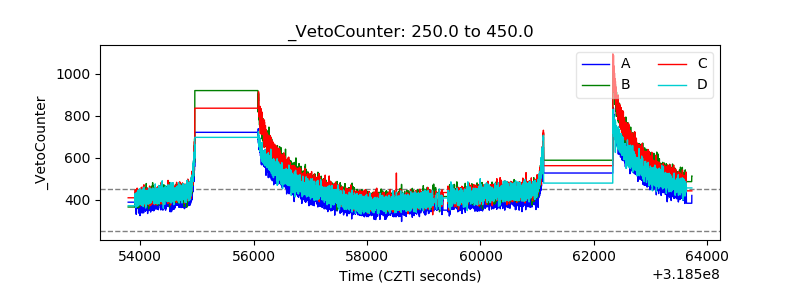 |