| Param | Original file | Final file |
|---|---|---|
| Filename | modeM0/AS1A07_011T01_9000003482_23549cztM0_level2.evt | modeM0/AS1A07_011T01_9000003482_23549cztM0_level2_quad_clean.evt |
| Size (bytes) | 1,536,419,520 | 302,431,680 |
| Size | 1.4 GB | 288.4 MB |
| Events in quadrant A | 9,536,536 | 1,979,087 |
| Events in quadrant B | 10,870,082 | 2,011,716 |
| Events in quadrant C | 9,711,554 | 1,935,212 |
| Events in quadrant D | 15,020,859 | 1,815,689 |
| Mode M9 | |||
|---|---|---|---|
| Quadrant | BADHDUFLAG | Total packets | Discarded packets |
| A | 0 | 27 | 0 |
| B | 0 | 27 | 0 |
| C | 0 | 29 | 1 |
| D | 0 | 28 | 0 |
| Mode SS | |||
|---|---|---|---|
| Quadrant | BADHDUFLAG | Total packets | Discarded packets |
| A | 0 | 424 | 2 |
| B | 0 | 426 | 4 |
| C | 0 | 425 | 3 |
| D | 0 | 425 | 3 |
| Mode M0 | |||
|---|---|---|---|
| Quadrant | BADHDUFLAG | Total packets | Discarded packets |
| A | 0 | 42507 | 354 |
| B | 0 | 46054 | 361 |
| C | 0 | 42796 | 360 |
| D | 0 | 59421 | 408 |
| Quadrant | Total seconds | Saturated seconds | Saturation percentage |
|---|---|---|---|
| A | 20588 | 110 | 0.534292% |
| B | 20586 | 277 | 1.345575% |
| C | 20586 | 221 | 1.073545% |
| D | 20584 | 1607 | 7.807035% |
Noise dominated data is calculated using 1-second bins in cleaned event files. If a bin has >2000 counts, and if more than 50% of those come from <1% of pixels, then it is considered to be noise-dominated and hence unusable.
| Quadrant | # 1 sec bins | Bins with >0 counts | Bins with >2000 counts | High rate bins dominated by noise | Noise dominated (total time) | Noise dominated (detector-on time) | Marked lightcurve |
|---|---|---|---|---|---|---|---|
| A | 44305 | 20604 | 3 | 3 | 0.01% | 0.01% | 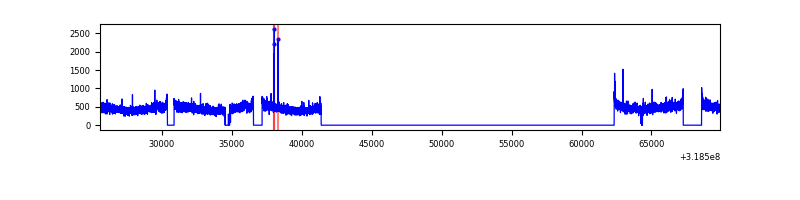 |
| B | 44306 | 20604 | 94 | 94 | 0.21% | 0.46% | 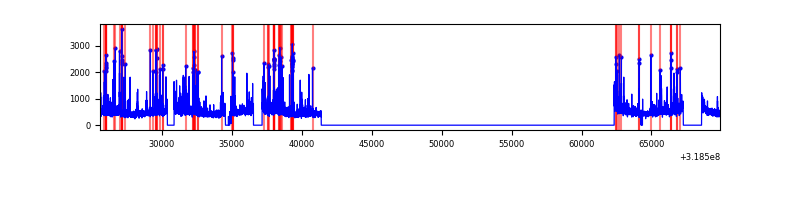 |
| C | 44306 | 20602 | 5 | 5 | 0.01% | 0.02% | 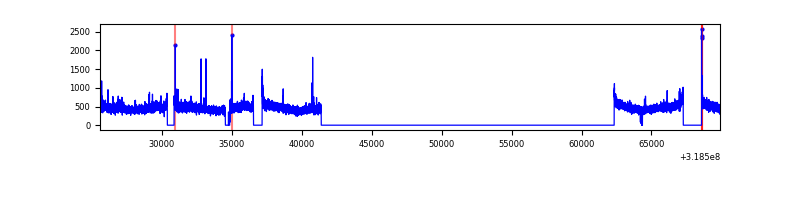 |
| D | 44306 | 20603 | 1376 | 1376 | 3.11% | 6.68% | 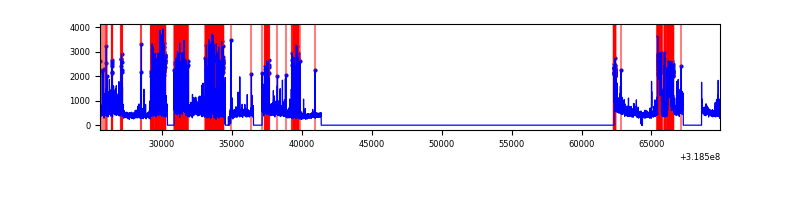 |
Top three noisy pixels from each quadrant. If the there are fewer than three noisy pixels in the level2.evt file, extra rows are filled as -1
| Pixel properties | Quadrant properties | ||||||
|---|---|---|---|---|---|---|---|
| Quadrant | DetID | PixID | Counts | Sigma | Mean | Median | Sigma |
| A | 13 | 254 | 37033 | 71.05 | 2457 | 2407 | 487.4 |
| A | 13 | 252 | 24915 | 46.18 | 2457 | 2407 | 487.4 |
| A | 6 | 16 | 23561 | 43.4 | 2457 | 2407 | 487.4 |
| B | 3 | 64 | 508688 | 1107.39 | 2449 | 2392 | 457.2 |
| B | 0 | 189 | 353650 | 768.28 | 2449 | 2392 | 457.2 |
| B | 0 | 229 | 201468 | 435.43 | 2449 | 2392 | 457.2 |
| C | 14 | 238 | 376611 | 687.69 | 2356 | 2373 | 544.2 |
| C | 7 | 247 | 61197 | 108.09 | 2356 | 2373 | 544.2 |
| C | 10 | 9 | 36076 | 61.93 | 2356 | 2373 | 544.2 |
| D | 1 | 52 | 4724781 | 8530.14 | 2301 | 2240 | 553.6 |
| D | 9 | 85 | 670285 | 1206.66 | 2301 | 2240 | 553.6 |
| D | 7 | 38 | 546237 | 982.6 | 2301 | 2240 | 553.6 |
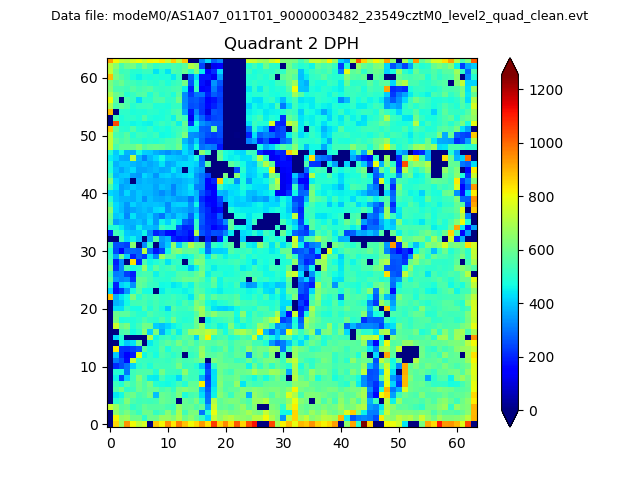
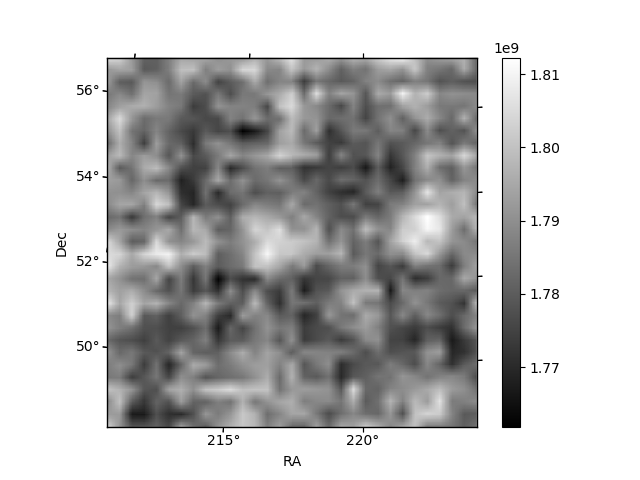
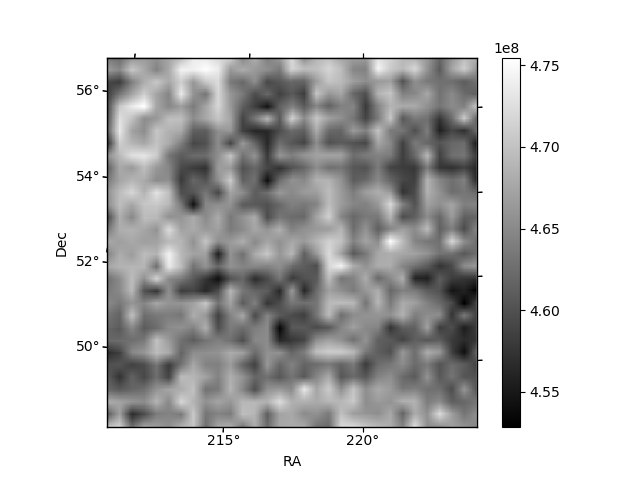
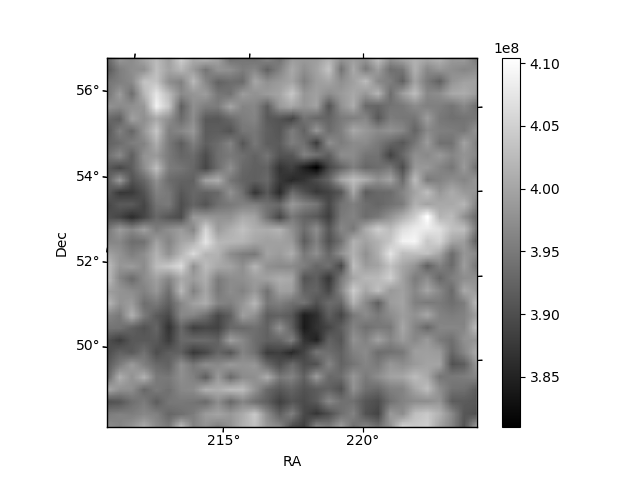
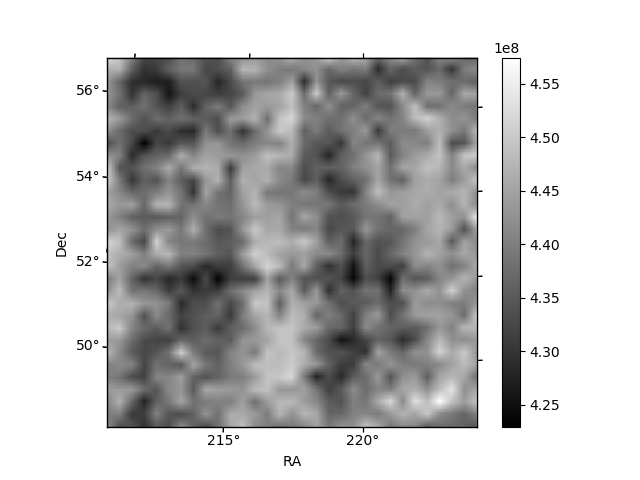
Histogram calculated using DETX and DETY for each event in the final _common_clean file
| Quadrant A | 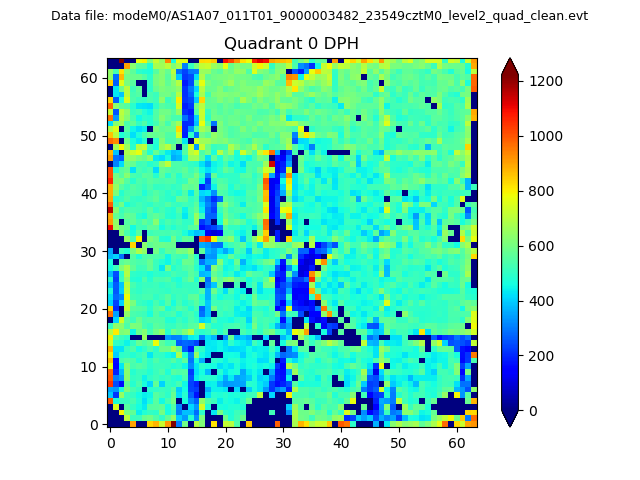 |
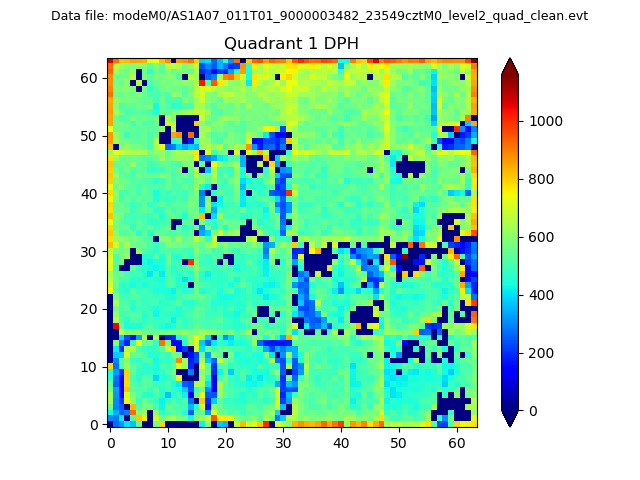 |
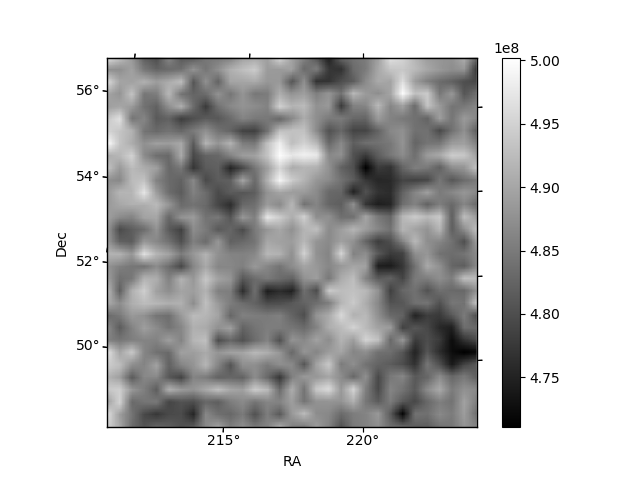
Quadrant B |
|---|---|---|---|
| Quadrant D | 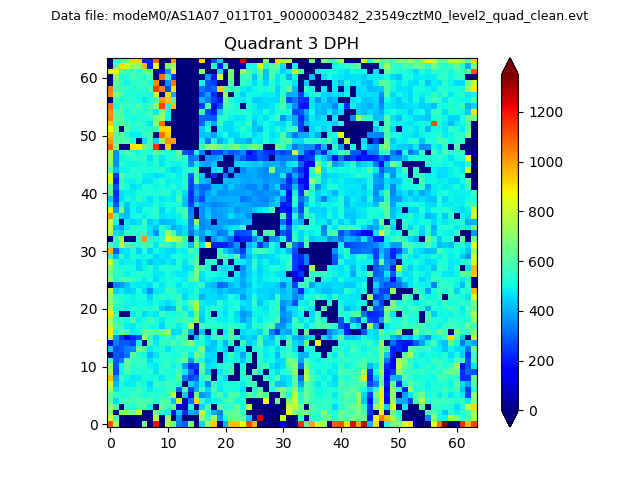 |
 |
Quadrant C |
| Plot type | Count rate plots | Images |
|---|---|---|
| Comparison with Poisson distribution Blue bars denote a histogram of data divided into 1 sec bins. Red curve is a Poisson curve with rate = median count rate of data. |
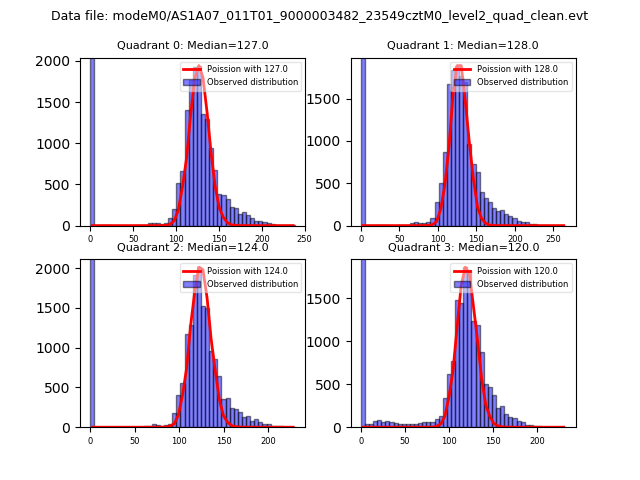 |
 |
| Quadrant-wise count rates Data is divided into 100 sec bins |
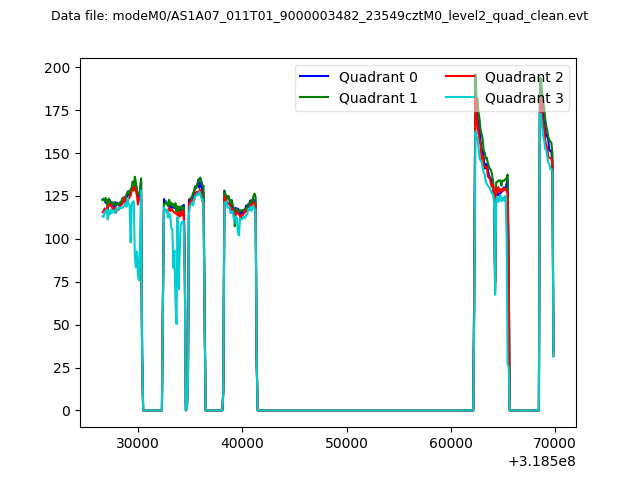 |
|
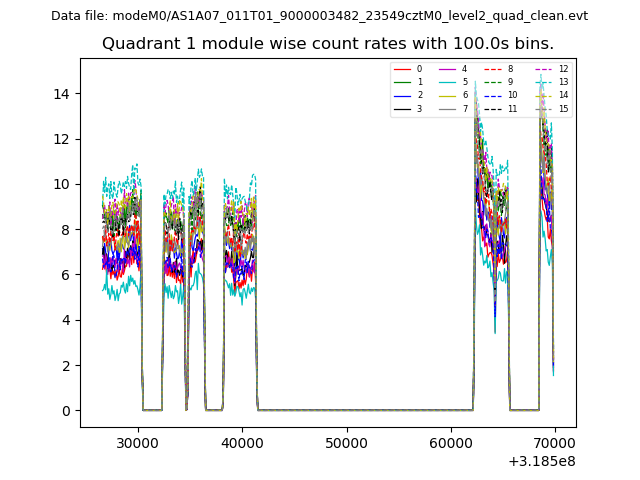
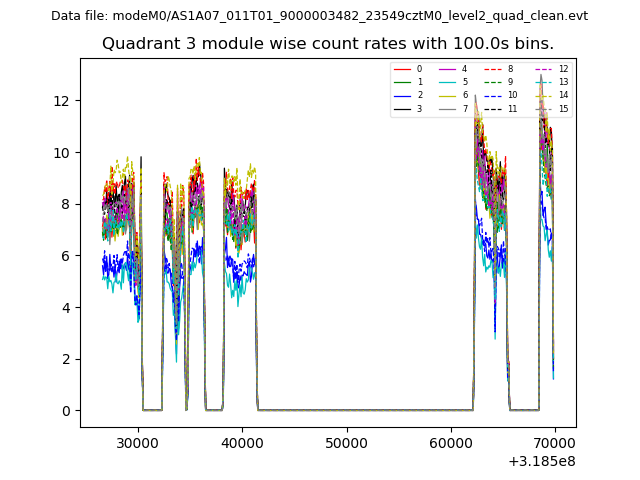
| Module-wise count rates for Quadrant A Data is divided into 100 sec bins |
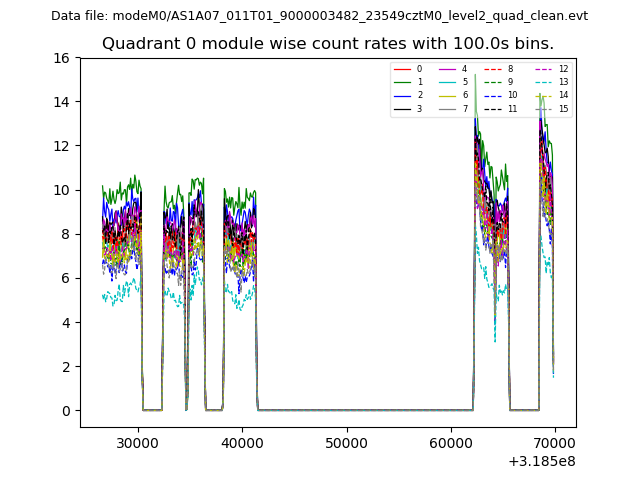 |
 |
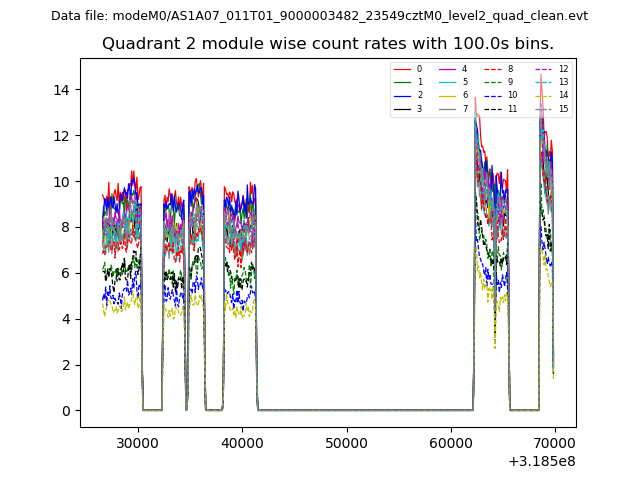
| Module-wise count rates for Quadrant B Data is divided into 100 sec bins |
 |
 |
| Module-wise count rates for Quadrant C Data is divided into 100 sec bins |
 |
 |
| Module-wise count rates for Quadrant D Data is divided into 100 sec bins |
 |
 |
| Parameter | Plot |
|---|---|
| CZT HV Monitor | 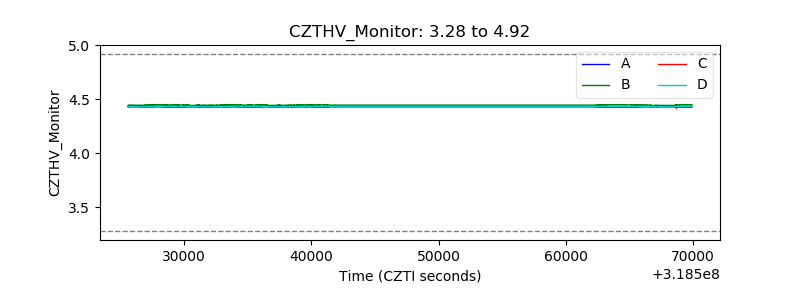 |
| D_VDD | 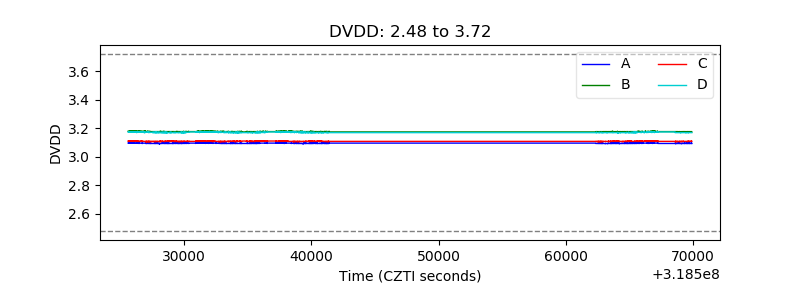 |
| Temperature 1 | 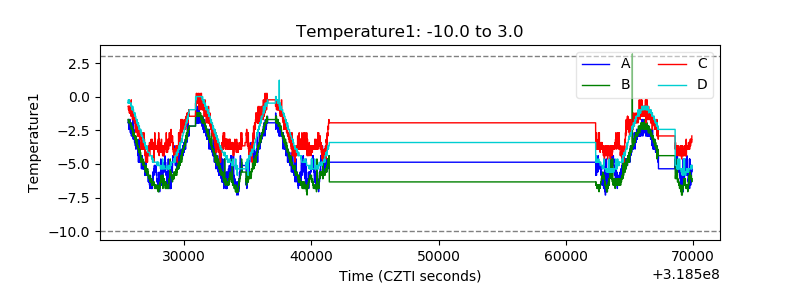 |
| Veto HV Monitor | 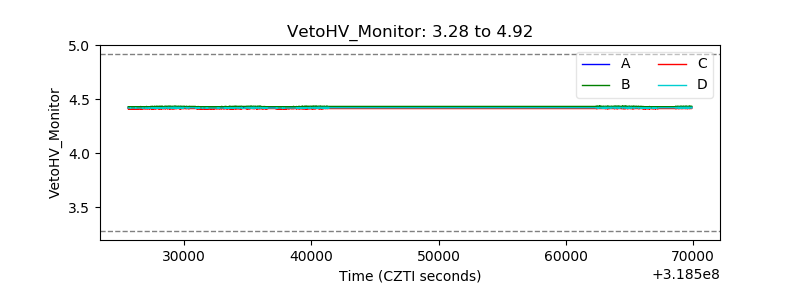 |
| Veto LLD | 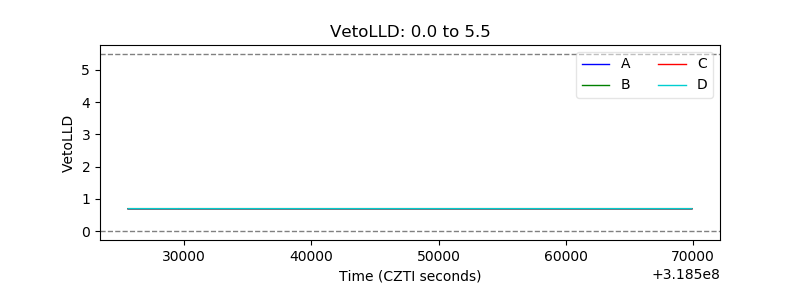 |
| Alpha Counter | 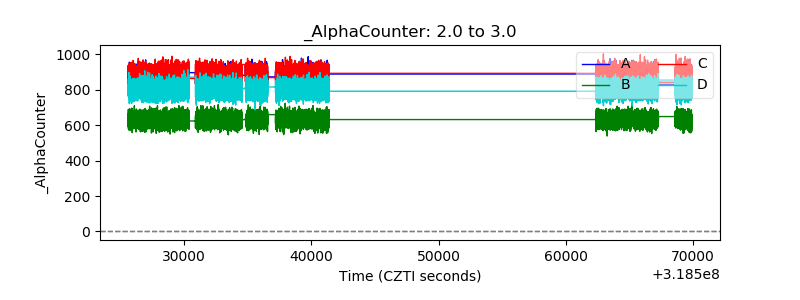 |
| _CPM_Rate | 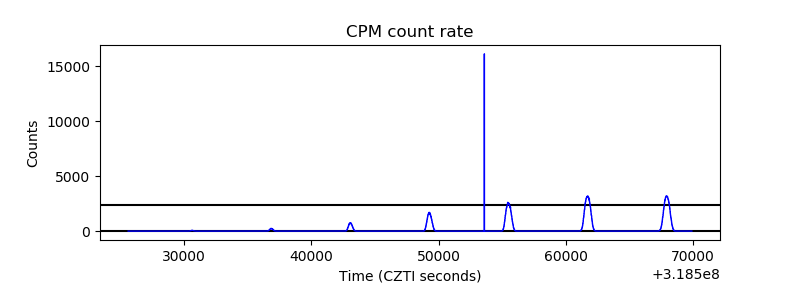 |
| CZT Counter | 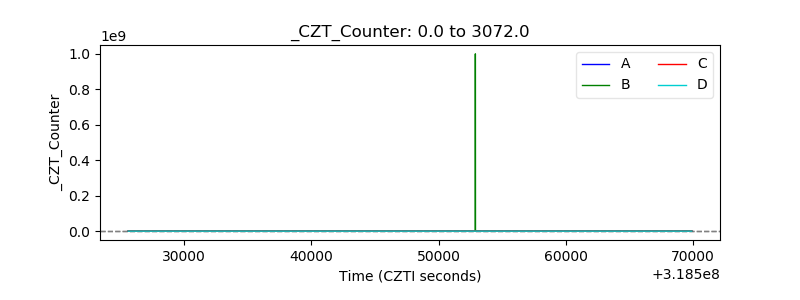 |
| +2.5 Volts monitor | 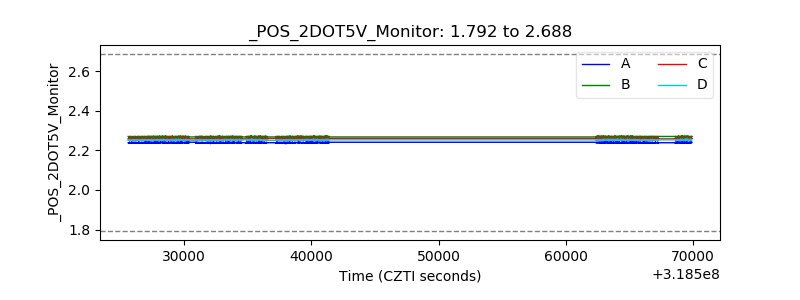 |
| +5 Volts monitor |  |
| _ROLL_ROT | 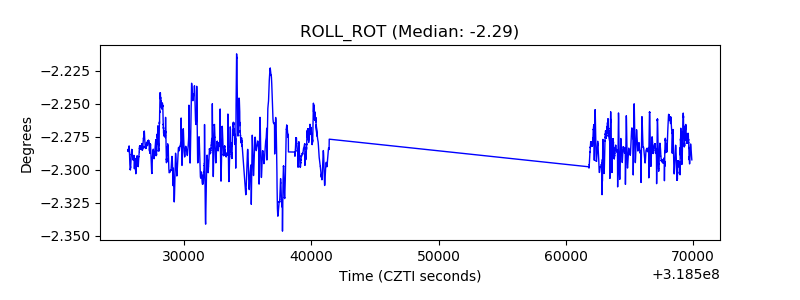 |
| _Roll_DEC | 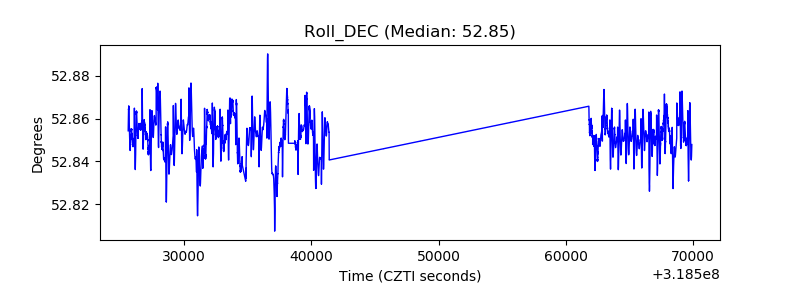 |
| _Roll_RA | 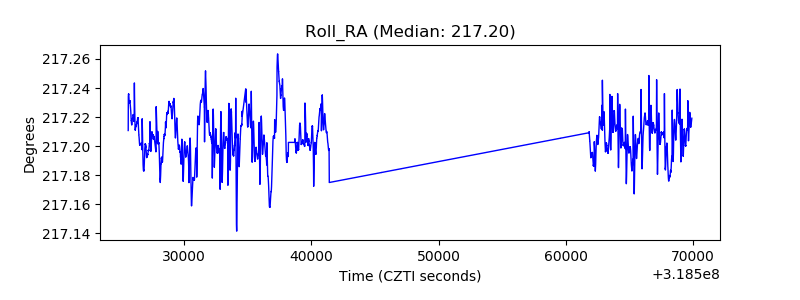 |
| Veto Counter | 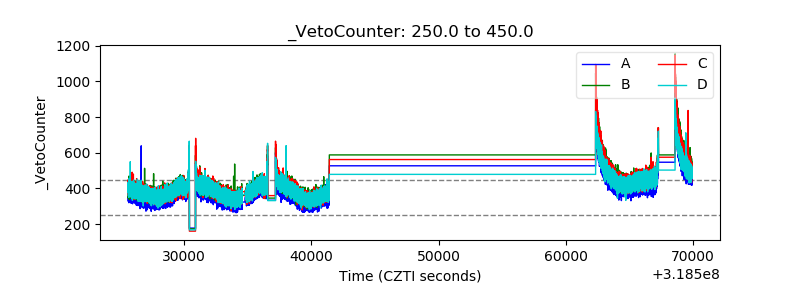 |