| Param | Original file | Final file |
|---|---|---|
| Filename | modeM0/AS1A07_011T01_9000003482_23550cztM0_level2.evt | modeM0/AS1A07_011T01_9000003482_23550cztM0_level2_quad_clean.evt |
| Size (bytes) | 452,664,000 | 104,212,800 |
| Size | 431.7 MB | 99.4 MB |
| Events in quadrant A | 3,198,438 | 690,243 |
| Events in quadrant B | 3,407,633 | 711,458 |
| Events in quadrant C | 3,216,229 | 666,681 |
| Events in quadrant D | 3,455,567 | 644,944 |
| Mode M9 | |||
|---|---|---|---|
| Quadrant | BADHDUFLAG | Total packets | Discarded packets |
| A | 0 | 19 | 0 |
| B | 0 | 20 | 0 |
| C | 0 | 20 | 0 |
| D | 0 | 20 | 0 |
| Mode SS | |||
|---|---|---|---|
| Quadrant | BADHDUFLAG | Total packets | Discarded packets |
| A | 0 | 130 | 0 |
| B | 0 | 130 | 0 |
| C | 0 | 130 | 0 |
| D | 0 | 130 | 0 |
| Mode M0 | |||
|---|---|---|---|
| Quadrant | BADHDUFLAG | Total packets | Discarded packets |
| A | 0 | 13232 | 2 |
| B | 0 | 14030 | 2 |
| C | 0 | 13410 | 3 |
| D | 0 | 14386 | 2 |
| Quadrant | Total seconds | Saturated seconds | Saturation percentage |
|---|---|---|---|
| A | 6342 | 22 | 0.346894% |
| B | 6342 | 63 | 0.993377% |
| C | 6341 | 69 | 1.088156% |
| D | 6341 | 24 | 0.378489% |
Noise dominated data is calculated using 1-second bins in cleaned event files. If a bin has >2000 counts, and if more than 50% of those come from <1% of pixels, then it is considered to be noise-dominated and hence unusable.
| Quadrant | # 1 sec bins | Bins with >0 counts | Bins with >2000 counts | High rate bins dominated by noise | Noise dominated (total time) | Noise dominated (detector-on time) | Marked lightcurve |
|---|---|---|---|---|---|---|---|
| A | 7707 | 6343 | 0 | 0 | 0.00% | 0.00% | 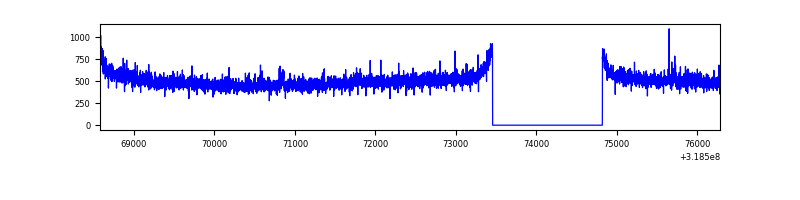 |
| B | 7707 | 6343 | 11 | 11 | 0.14% | 0.17% | 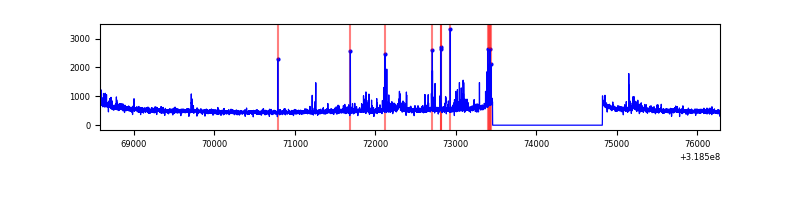 |
| C | 7706 | 6341 | 3 | 3 | 0.04% | 0.05% | 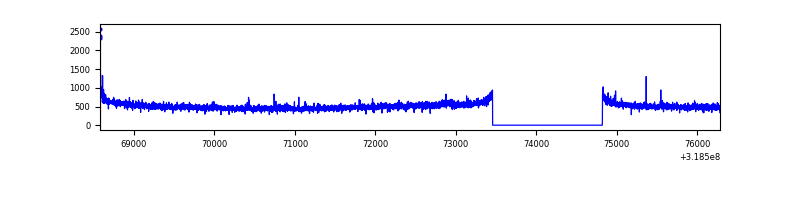 |
| D | 7706 | 6342 | 6 | 6 | 0.08% | 0.09% | 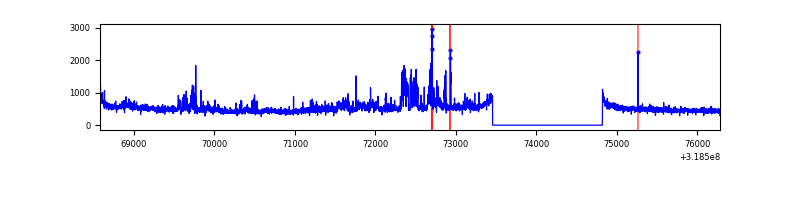 |
Top three noisy pixels from each quadrant. If the there are fewer than three noisy pixels in the level2.evt file, extra rows are filled as -1
| Pixel properties | Quadrant properties | ||||||
|---|---|---|---|---|---|---|---|
| Quadrant | DetID | PixID | Counts | Sigma | Mean | Median | Sigma |
| A | 13 | 252 | 25464 | 151.51 | 821 | 807 | 162.7 |
| A | 13 | 254 | 11185 | 63.77 | 821 | 807 | 162.7 |
| A | 0 | 226 | 7226 | 39.44 | 821 | 807 | 162.7 |
| B | 0 | 189 | 94921 | 628.51 | 815 | 797 | 149.8 |
| B | 15 | 32 | 42185 | 276.37 | 815 | 797 | 149.8 |
| B | 3 | 64 | 27706 | 179.68 | 815 | 797 | 149.8 |
| C | 14 | 238 | 127597 | 719.01 | 775 | 779 | 176.4 |
| C | 0 | 10 | 32657 | 180.73 | 775 | 779 | 176.4 |
| C | 7 | 247 | 13219 | 70.53 | 775 | 779 | 176.4 |
| D | 1 | 52 | 310502 | 1649.69 | 783 | 760 | 187.8 |
| D | 9 | 85 | 152494 | 808.14 | 783 | 760 | 187.8 |
| D | 2 | 234 | 25489 | 131.71 | 783 | 760 | 187.8 |
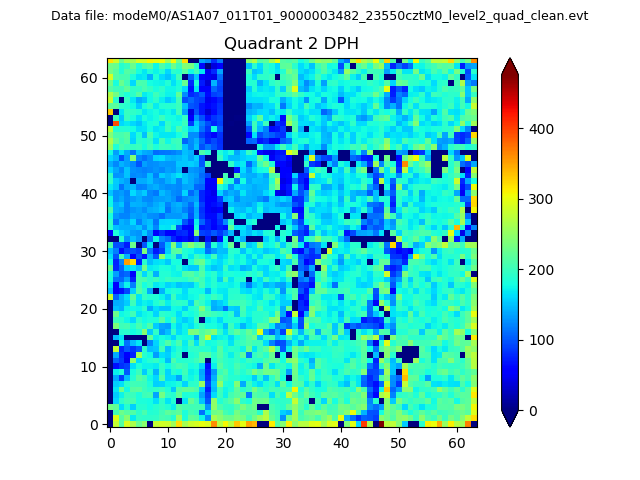
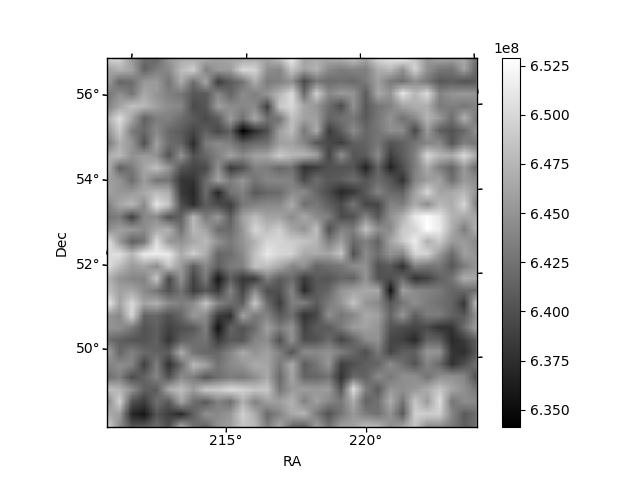
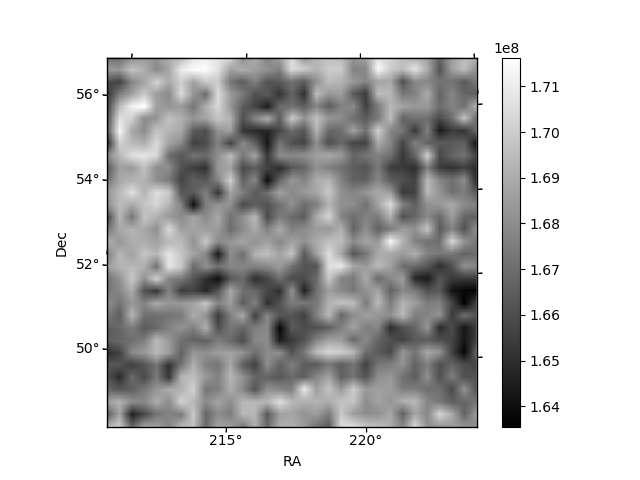
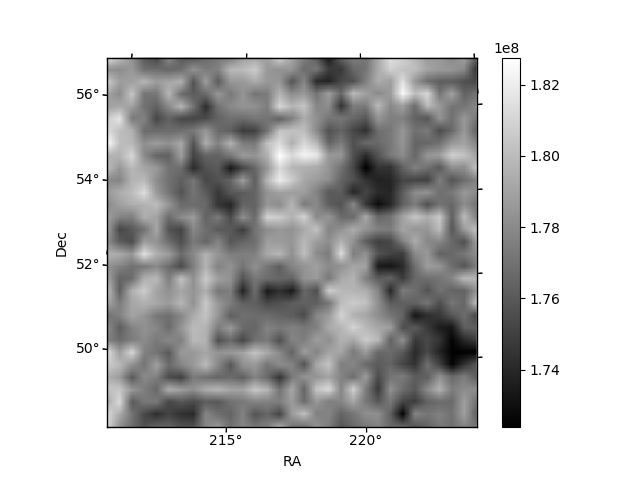
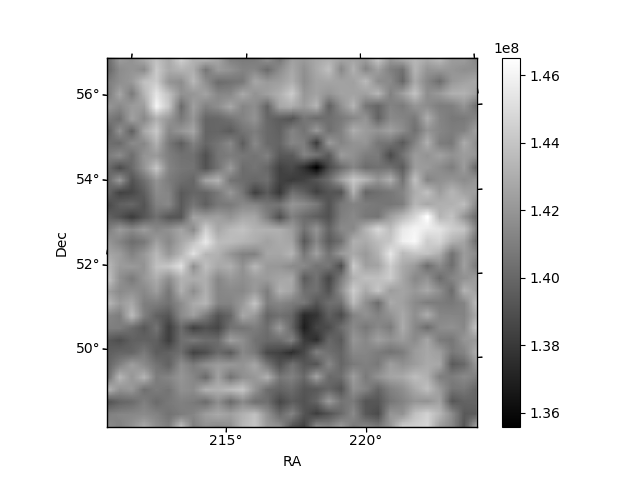
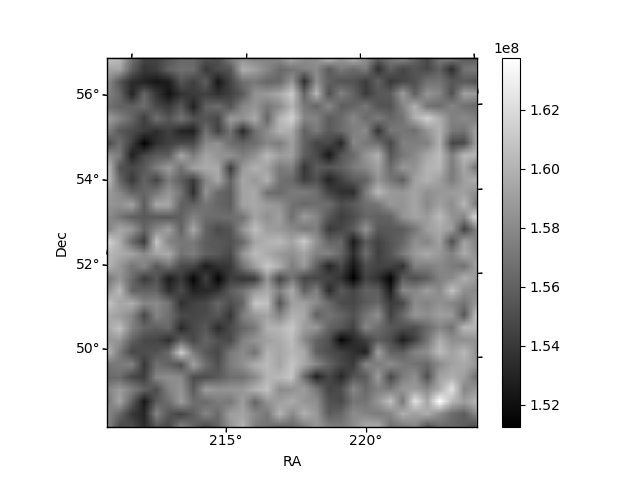
Histogram calculated using DETX and DETY for each event in the final _common_clean file
| Quadrant A | 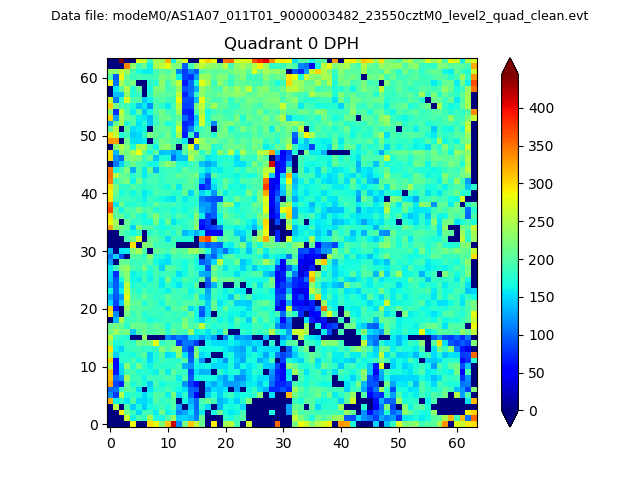 |
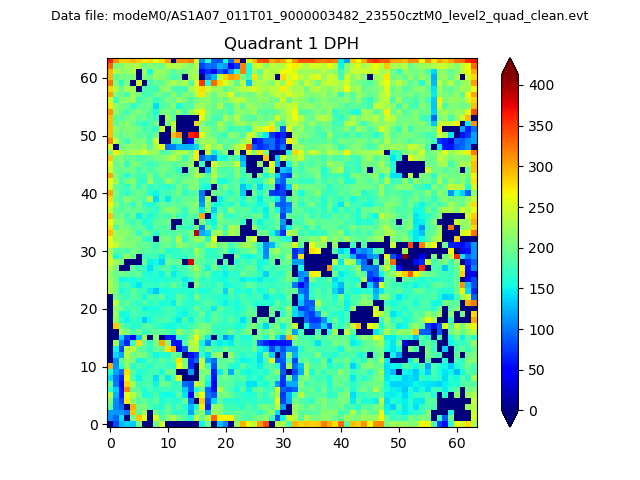 |
Quadrant B |
|---|---|---|---|
| Quadrant D | 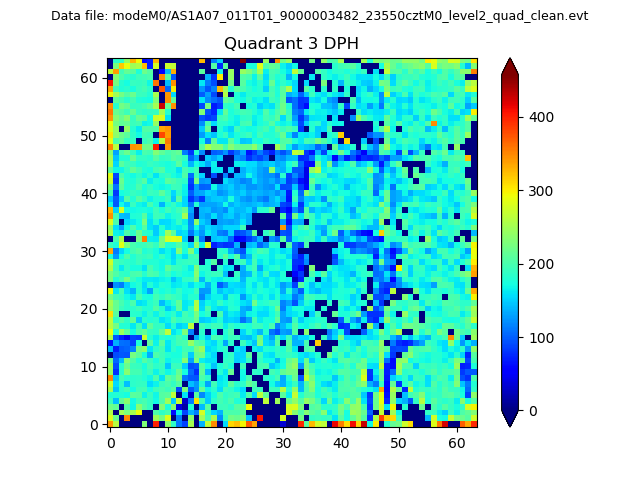 |
 |
Quadrant C |
| Plot type | Count rate plots | Images |
|---|---|---|
| Comparison with Poisson distribution Blue bars denote a histogram of data divided into 1 sec bins. Red curve is a Poisson curve with rate = median count rate of data. |
 |
 |
| Quadrant-wise count rates Data is divided into 100 sec bins |
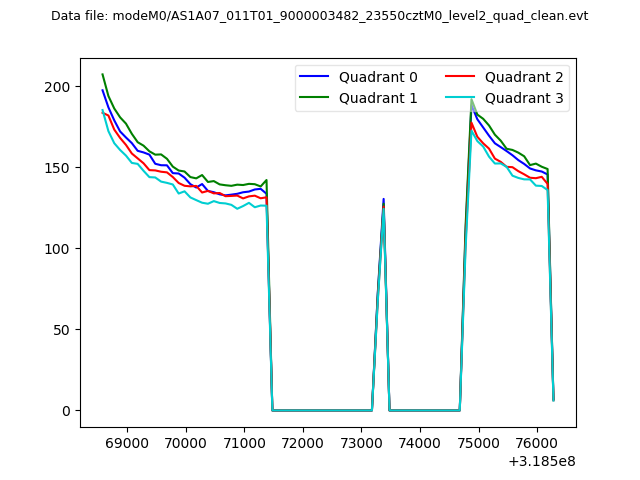 |
|
| Module-wise count rates for Quadrant A Data is divided into 100 sec bins |
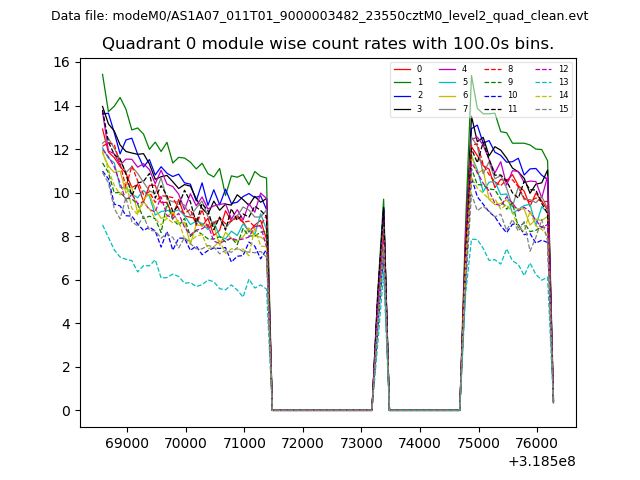 |
 |
| Module-wise count rates for Quadrant B Data is divided into 100 sec bins |
 |
 |
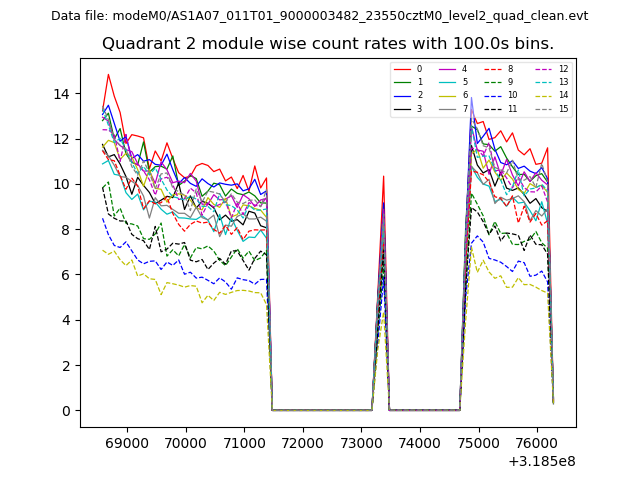
| Module-wise count rates for Quadrant C Data is divided into 100 sec bins |
 |
 |
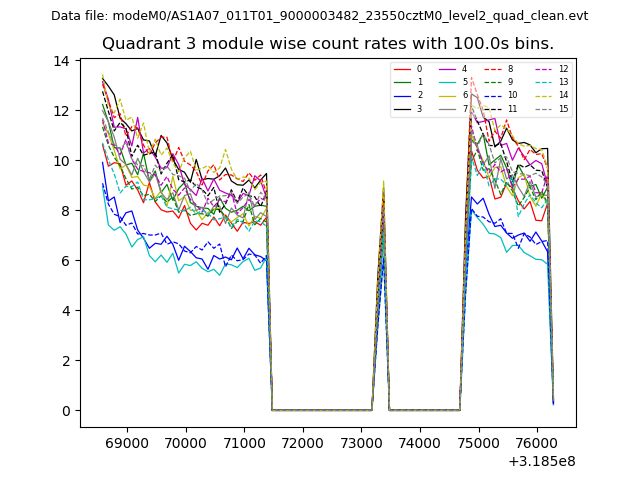
| Module-wise count rates for Quadrant D Data is divided into 100 sec bins |
 |
 |
| Parameter | Plot |
|---|---|
| CZT HV Monitor | 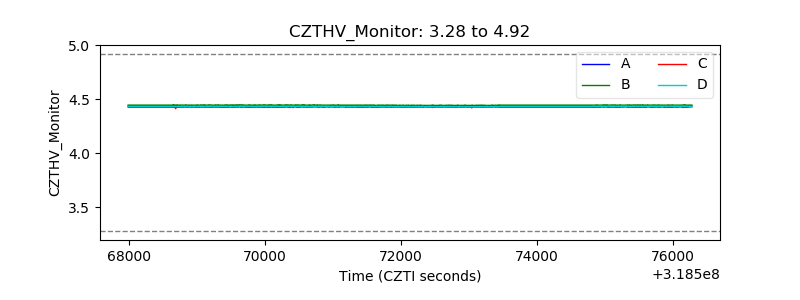 |
| D_VDD | 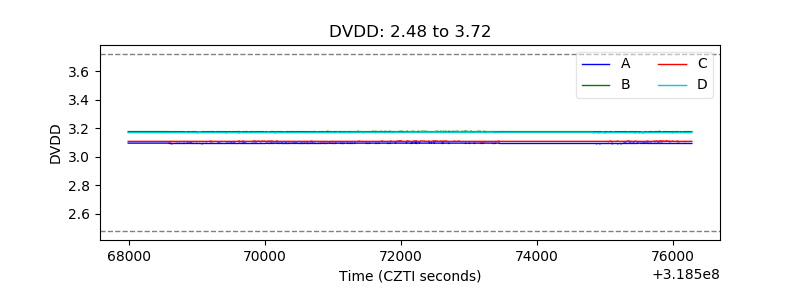 |
| Temperature 1 | 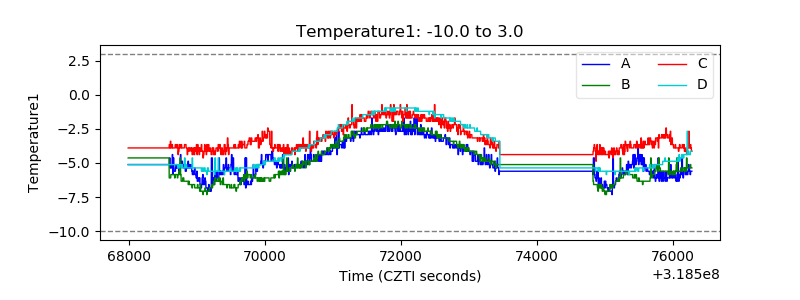 |
| Veto HV Monitor | 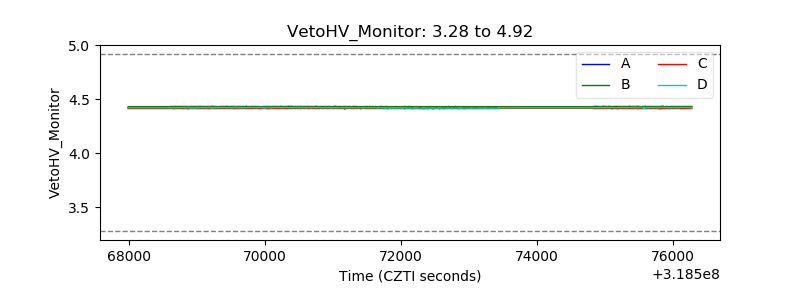 |
| Veto LLD | 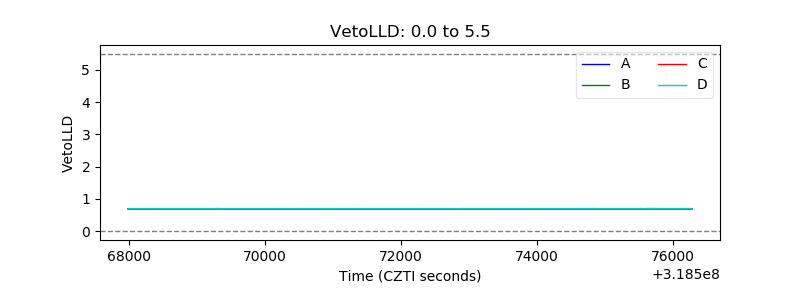 |
| Alpha Counter | 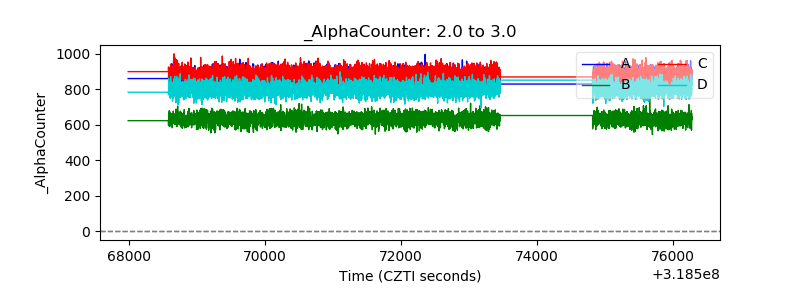 |
| _CPM_Rate | 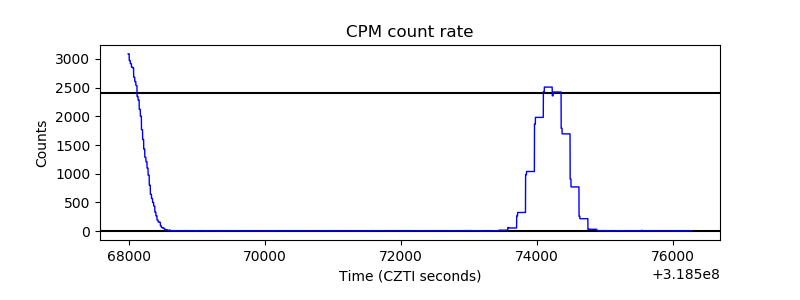 |
| CZT Counter | 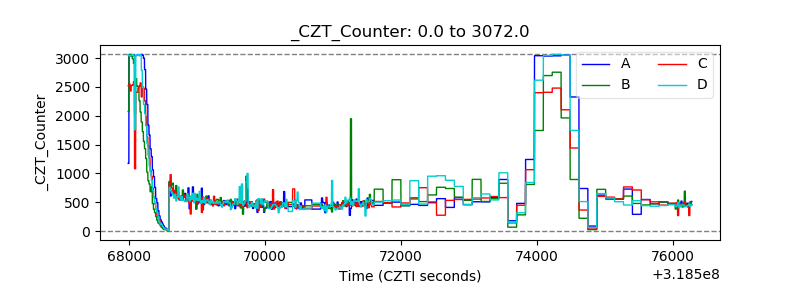 |
| +2.5 Volts monitor |  |
| +5 Volts monitor | 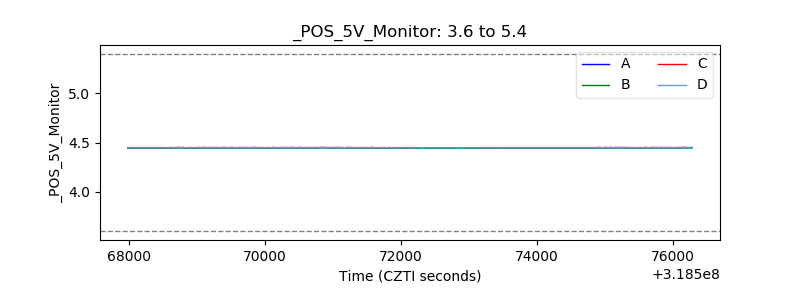 |
| _ROLL_ROT | 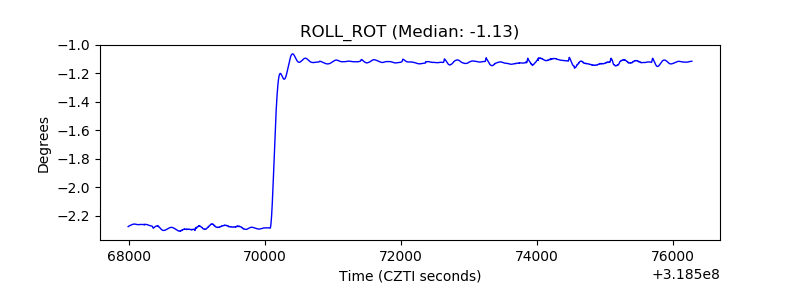 |
| _Roll_DEC |  |
| _Roll_RA | 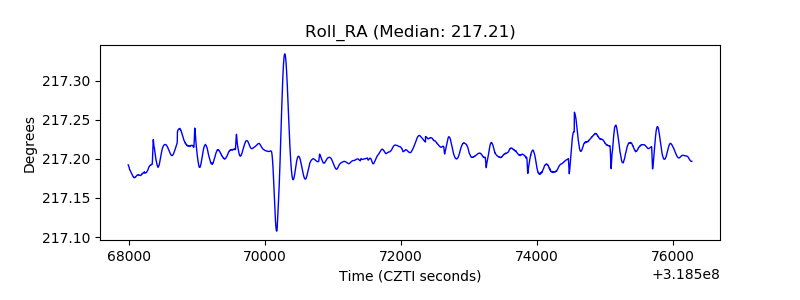 |
| Veto Counter |  |