| Param | Original file | Final file |
|---|---|---|
| Filename | modeM0/AS1A07_011T01_9000003482_23551cztM0_level2.evt | modeM0/AS1A07_011T01_9000003482_23551cztM0_level2_quad_clean.evt |
| Size (bytes) | 405,878,400 | 88,459,200 |
| Size | 387.1 MB | 84.4 MB |
| Events in quadrant A | 2,942,286 | 580,475 |
| Events in quadrant B | 2,986,650 | 588,806 |
| Events in quadrant C | 2,862,617 | 556,907 |
| Events in quadrant D | 3,107,331 | 548,584 |
| Mode M9 | |||
|---|---|---|---|
| Quadrant | BADHDUFLAG | Total packets | Discarded packets |
| A | 0 | 13 | 0 |
| B | 0 | 13 | 0 |
| C | 0 | 13 | 0 |
| D | 0 | 13 | 0 |
| Mode SS | |||
|---|---|---|---|
| Quadrant | BADHDUFLAG | Total packets | Discarded packets |
| A | 0 | 118 | 0 |
| B | 0 | 118 | 0 |
| C | 0 | 118 | 0 |
| D | 0 | 118 | 0 |
| Mode M0 | |||
|---|---|---|---|
| Quadrant | BADHDUFLAG | Total packets | Discarded packets |
| A | 0 | 12100 | 1 |
| B | 0 | 12283 | 1 |
| C | 0 | 11980 | 1 |
| D | 0 | 13028 | 1 |
| Quadrant | Total seconds | Saturated seconds | Saturation percentage |
|---|---|---|---|
| A | 5780 | 47 | 0.813149% |
| B | 5780 | 78 | 1.349481% |
| C | 5780 | 64 | 1.107266% |
| D | 5779 | 39 | 0.674857% |
Noise dominated data is calculated using 1-second bins in cleaned event files. If a bin has >2000 counts, and if more than 50% of those come from <1% of pixels, then it is considered to be noise-dominated and hence unusable.
| Quadrant | # 1 sec bins | Bins with >0 counts | Bins with >2000 counts | High rate bins dominated by noise | Noise dominated (total time) | Noise dominated (detector-on time) | Marked lightcurve |
|---|---|---|---|---|---|---|---|
| A | 7110 | 5781 | 0 | 0 | 0.00% | 0.00% | 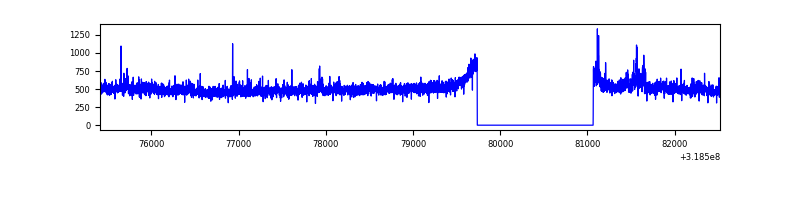 |
| B | 7110 | 5780 | 5 | 5 | 0.07% | 0.09% | 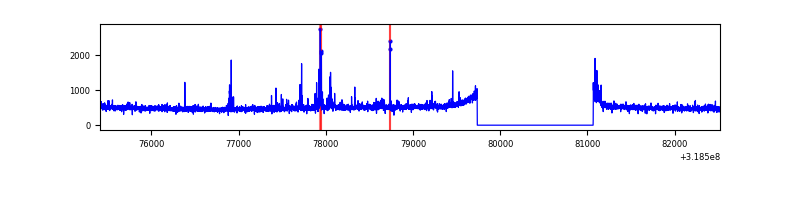 |
| C | 7110 | 5781 | 0 | 0 | 0.00% | 0.00% | 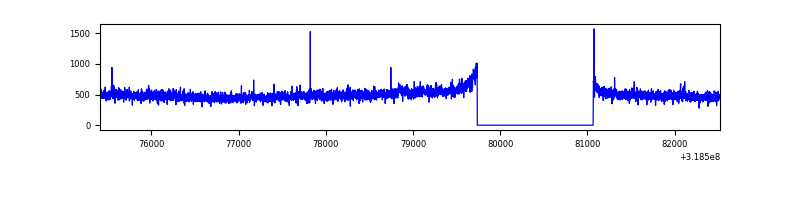 |
| D | 7109 | 5780 | 17 | 17 | 0.24% | 0.29% | 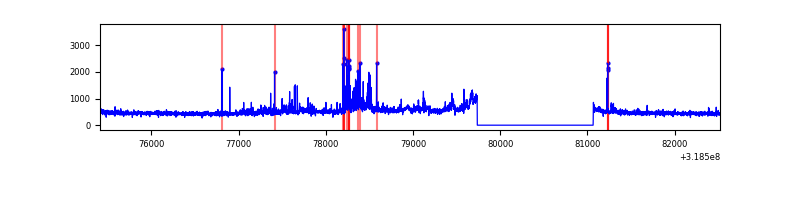 |
Top three noisy pixels from each quadrant. If the there are fewer than three noisy pixels in the level2.evt file, extra rows are filled as -1
| Pixel properties | Quadrant properties | ||||||
|---|---|---|---|---|---|---|---|
| Quadrant | DetID | PixID | Counts | Sigma | Mean | Median | Sigma |
| A | 13 | 252 | 74395 | 501.54 | 738 | 724 | 146.9 |
| A | 2 | 79 | 12383 | 79.37 | 738 | 724 | 146.9 |
| A | 13 | 254 | 10108 | 63.88 | 738 | 724 | 146.9 |
| B | 0 | 189 | 36556 | 263.68 | 727 | 710 | 135.9 |
| B | 14 | 207 | 24546 | 175.34 | 727 | 710 | 135.9 |
| B | 0 | 230 | 22774 | 162.3 | 727 | 710 | 135.9 |
| C | 14 | 238 | 112897 | 705.46 | 693 | 698 | 159.0 |
| C | 14 | 67 | 17488 | 105.57 | 693 | 698 | 159.0 |
| C | 0 | 10 | 13593 | 81.08 | 693 | 698 | 159.0 |
| D | 1 | 52 | 231152 | 1359.25 | 706 | 686 | 169.6 |
| D | 9 | 85 | 173412 | 1018.71 | 706 | 686 | 169.6 |
| D | 2 | 234 | 23436 | 134.17 | 706 | 686 | 169.6 |
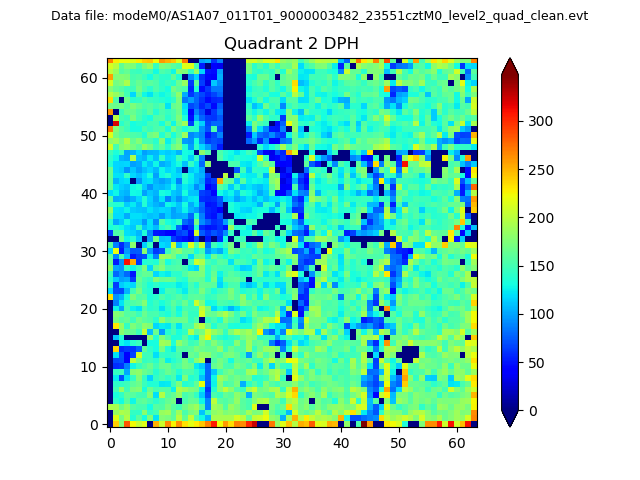
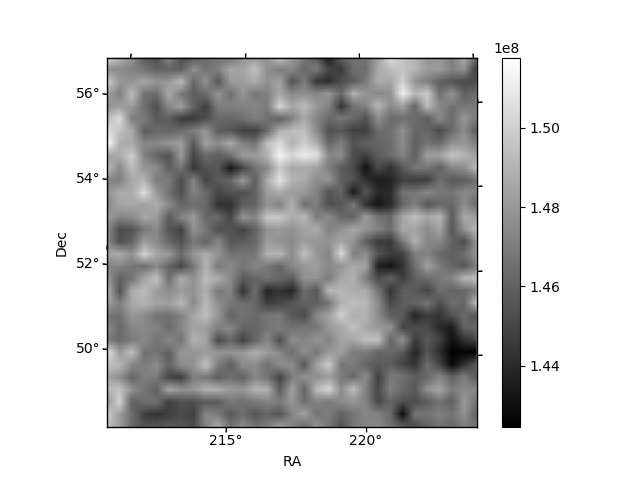
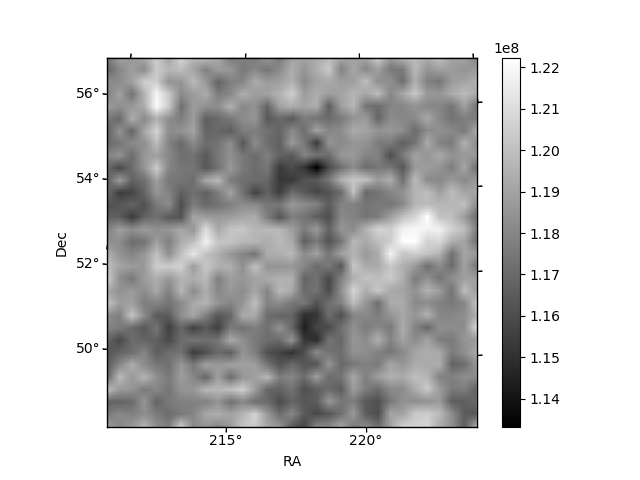
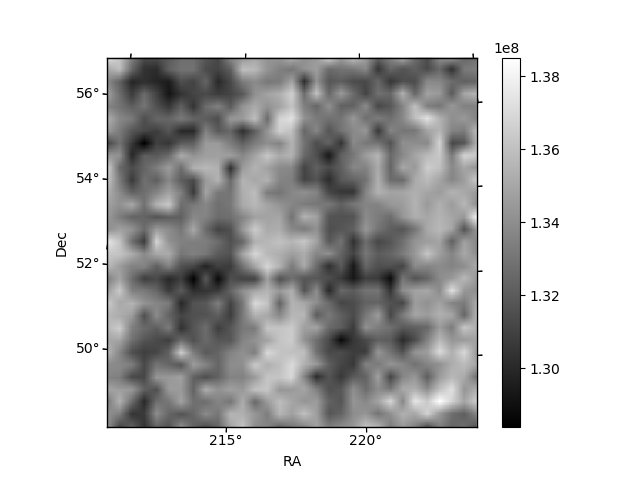
Histogram calculated using DETX and DETY for each event in the final _common_clean file
| Quadrant A | 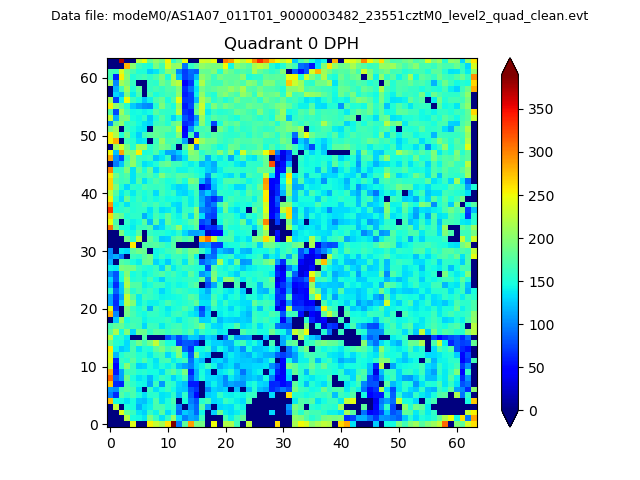 |
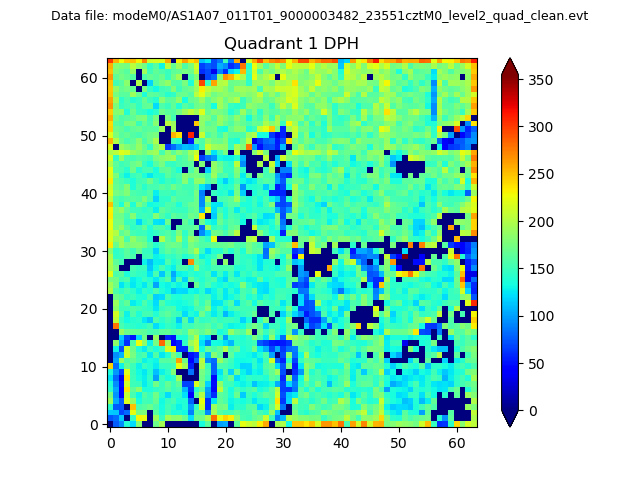 |
Quadrant B |
|---|---|---|---|
| Quadrant D | 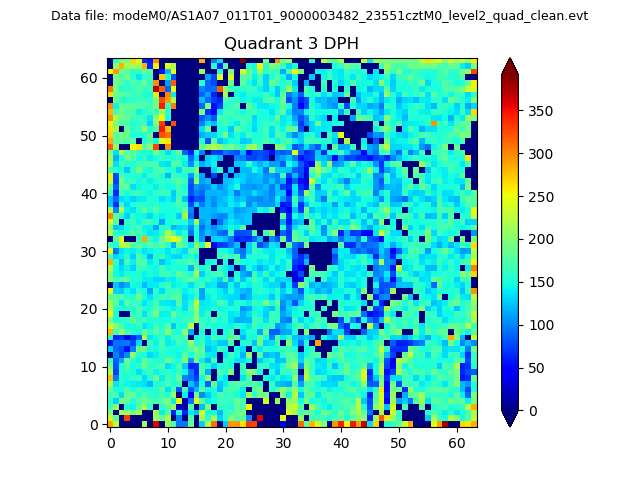 |
 |
Quadrant C |
| Plot type | Count rate plots | Images |
|---|---|---|
| Comparison with Poisson distribution Blue bars denote a histogram of data divided into 1 sec bins. Red curve is a Poisson curve with rate = median count rate of data. |
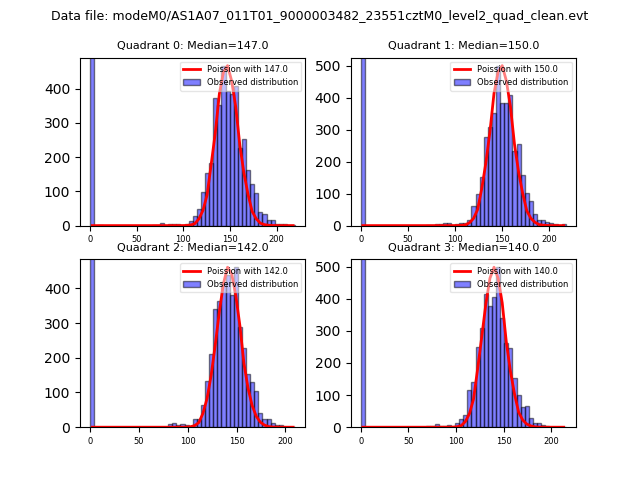 |
 |
| Quadrant-wise count rates Data is divided into 100 sec bins |
 |
|
| Module-wise count rates for Quadrant A Data is divided into 100 sec bins |
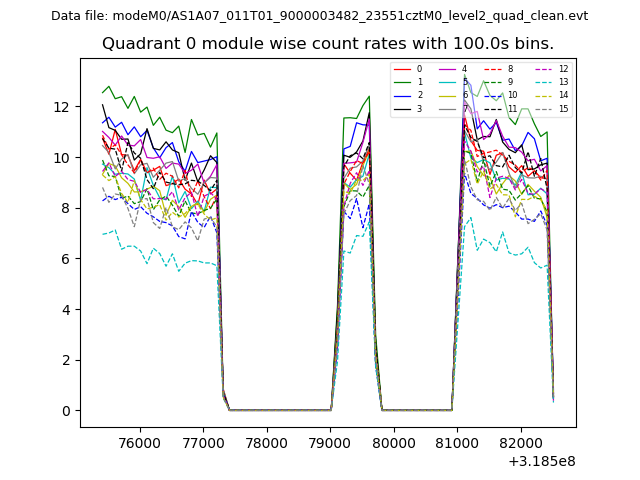 |
 |
| Module-wise count rates for Quadrant B Data is divided into 100 sec bins |
 |
 |
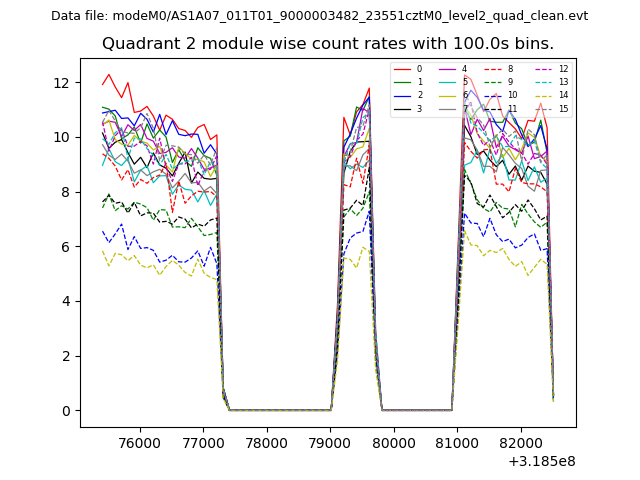
| Module-wise count rates for Quadrant C Data is divided into 100 sec bins |
 |
 |
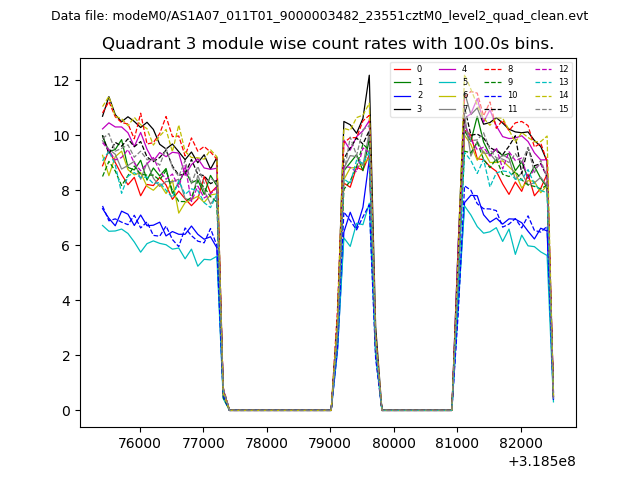
| Module-wise count rates for Quadrant D Data is divided into 100 sec bins |
 |
 |
| Parameter | Plot |
|---|---|
| CZT HV Monitor | 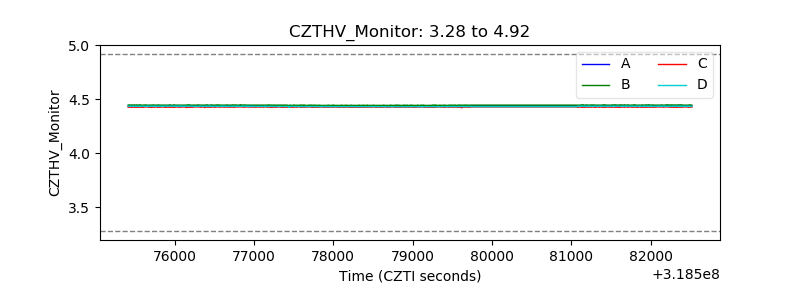 |
| D_VDD | 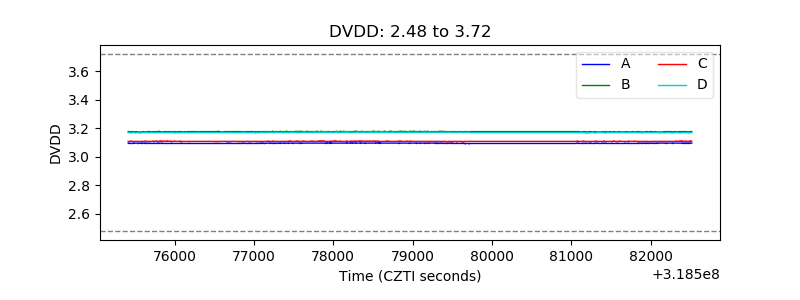 |
| Temperature 1 | 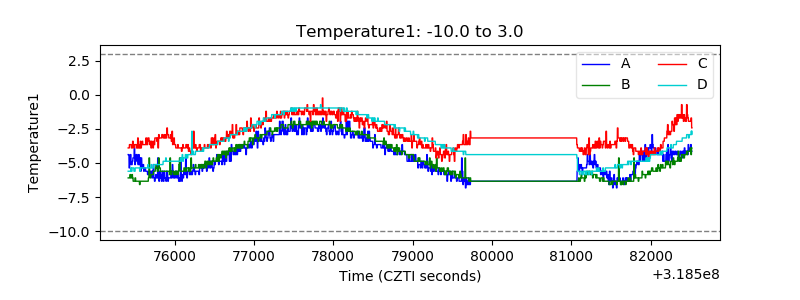 |
| Veto HV Monitor | 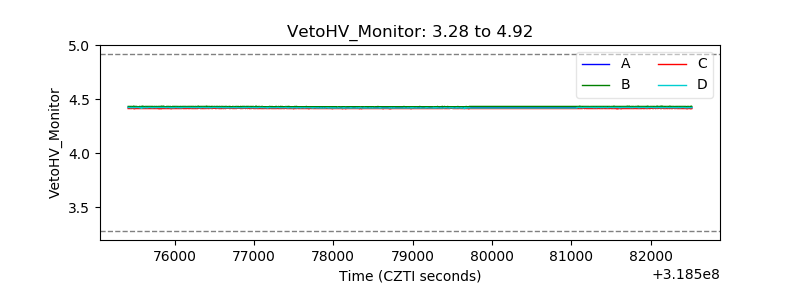 |
| Veto LLD | 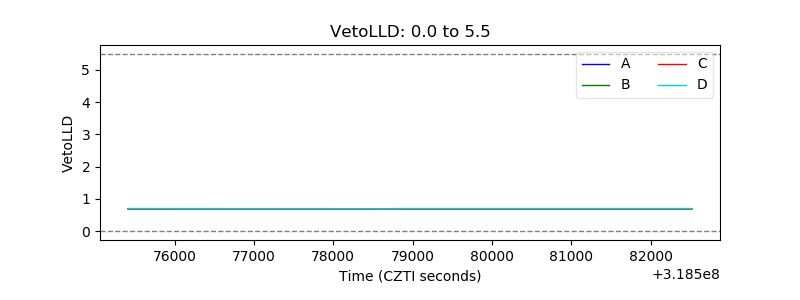 |
| Alpha Counter |  |
| _CPM_Rate | 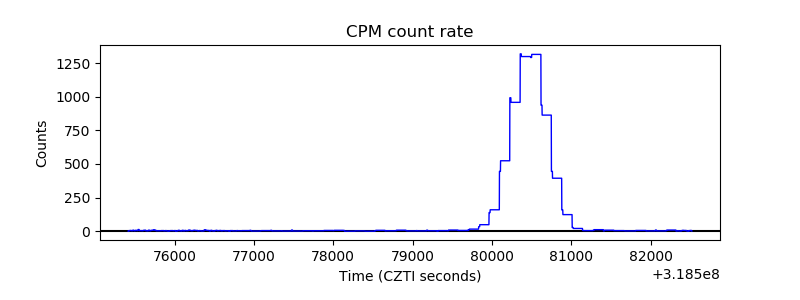 |
| CZT Counter | 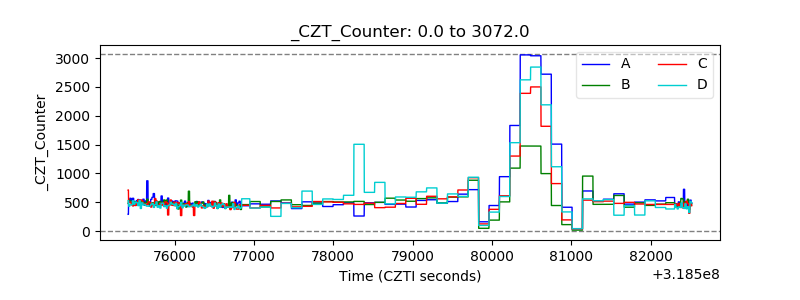 |
| +2.5 Volts monitor |  |
| +5 Volts monitor |  |
| _ROLL_ROT | 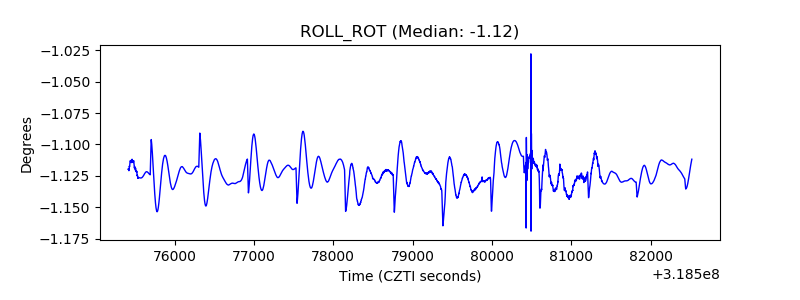 |
| _Roll_DEC | 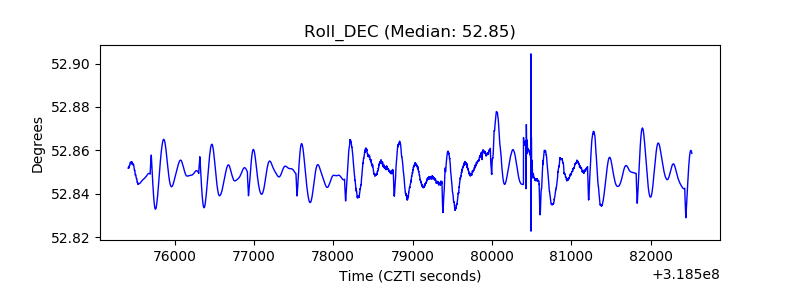 |
| _Roll_RA | 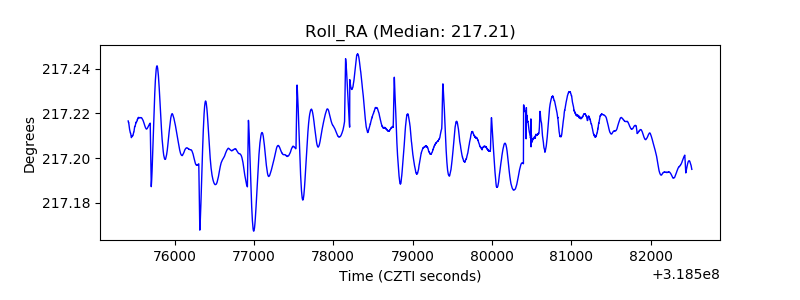 |
| Veto Counter | 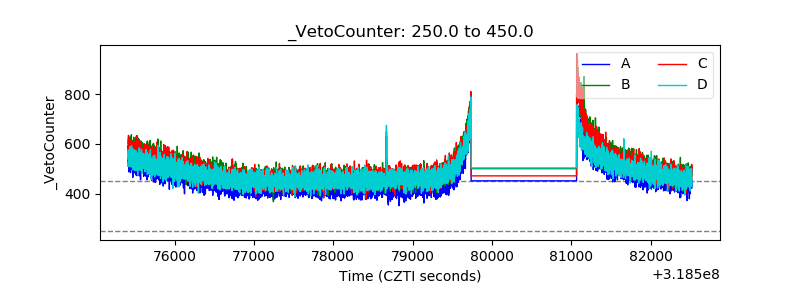 |