| Param | Original file | Final file |
|---|---|---|
| Filename | modeM0/AS1A07_011T01_9000003482_23554cztM0_level2.evt | modeM0/AS1A07_011T01_9000003482_23554cztM0_level2_quad_clean.evt |
| Size (bytes) | 499,703,040 | 98,461,440 |
| Size | 476.6 MB | 93.9 MB |
| Events in quadrant A | 3,336,163 | 629,028 |
| Events in quadrant B | 3,602,767 | 637,650 |
| Events in quadrant C | 3,529,152 | 611,337 |
| Events in quadrant D | 4,177,554 | 603,642 |
| Mode M9 | |||
|---|---|---|---|
| Quadrant | BADHDUFLAG | Total packets | Discarded packets |
| A | 0 | 4 | 0 |
| B | 0 | 4 | 0 |
| C | 0 | 4 | 0 |
| D | 0 | 4 | 0 |
| Mode SS | |||
|---|---|---|---|
| Quadrant | BADHDUFLAG | Total packets | Discarded packets |
| A | 0 | 146 | 0 |
| B | 0 | 146 | 0 |
| C | 0 | 146 | 0 |
| D | 0 | 146 | 0 |
| Mode M0 | |||
|---|---|---|---|
| Quadrant | BADHDUFLAG | Total packets | Discarded packets |
| A | 0 | 14675 | 2 |
| B | 0 | 15223 | 2 |
| C | 0 | 15188 | 2 |
| D | 0 | 17330 | 2 |
| Quadrant | Total seconds | Saturated seconds | Saturation percentage |
|---|---|---|---|
| A | 7183 | 81 | 1.127663% |
| B | 7183 | 103 | 1.433941% |
| C | 7183 | 161 | 2.241403% |
| D | 7183 | 125 | 1.740220% |
Noise dominated data is calculated using 1-second bins in cleaned event files. If a bin has >2000 counts, and if more than 50% of those come from <1% of pixels, then it is considered to be noise-dominated and hence unusable.
| Quadrant | # 1 sec bins | Bins with >0 counts | Bins with >2000 counts | High rate bins dominated by noise | Noise dominated (total time) | Noise dominated (detector-on time) | Marked lightcurve |
|---|---|---|---|---|---|---|---|
| A | 7593 | 7183 | 0 | 0 | 0.00% | 0.00% | 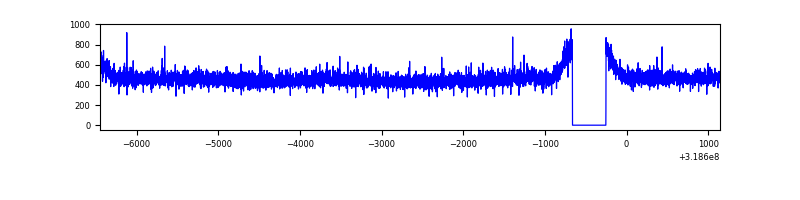 |
| B | 7593 | 7183 | 4 | 4 | 0.05% | 0.06% | 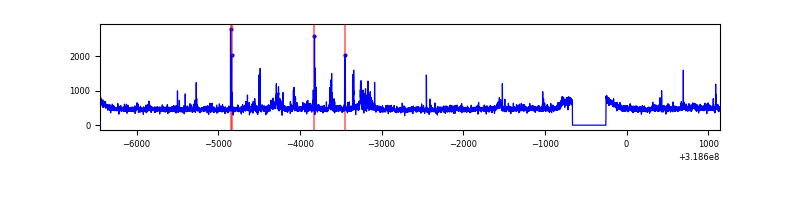 |
| C | 7593 | 7183 | 42 | 42 | 0.55% | 0.58% | 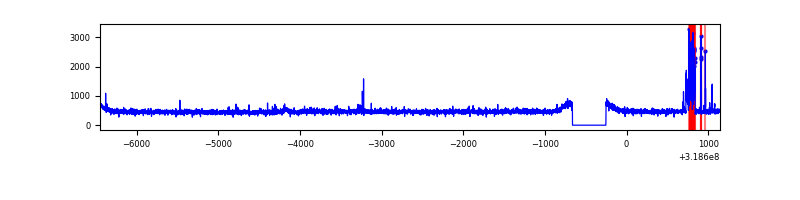 |
| D | 7593 | 7183 | 42 | 42 | 0.55% | 0.58% | 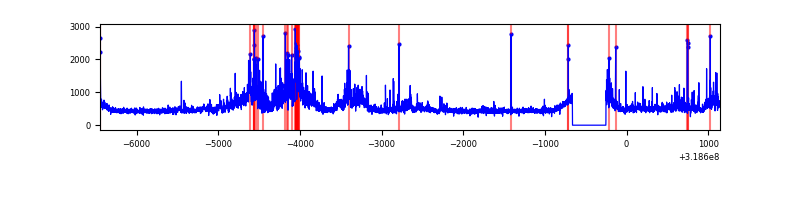 |
Top three noisy pixels from each quadrant. If the there are fewer than three noisy pixels in the level2.evt file, extra rows are filled as -1
| Pixel properties | Quadrant properties | ||||||
|---|---|---|---|---|---|---|---|
| Quadrant | DetID | PixID | Counts | Sigma | Mean | Median | Sigma |
| A | 13 | 254 | 12248 | 65.49 | 864 | 845 | 174.1 |
| A | 3 | 137 | 7666 | 39.18 | 864 | 845 | 174.1 |
| A | 0 | 226 | 7646 | 39.06 | 864 | 845 | 174.1 |
| B | 0 | 229 | 69950 | 420.06 | 858 | 834 | 164.5 |
| B | 0 | 189 | 67761 | 406.76 | 858 | 834 | 164.5 |
| B | 0 | 230 | 32274 | 191.08 | 858 | 834 | 164.5 |
| C | 10 | 9 | 165720 | 864.22 | 820 | 824 | 190.8 |
| C | 14 | 238 | 130396 | 679.09 | 820 | 824 | 190.8 |
| C | 7 | 247 | 19484 | 97.79 | 820 | 824 | 190.8 |
| D | 9 | 85 | 638727 | 3130.18 | 835 | 809 | 203.8 |
| D | 1 | 52 | 251779 | 1231.48 | 835 | 809 | 203.8 |
| D | 13 | 174 | 49500 | 238.92 | 835 | 809 | 203.8 |
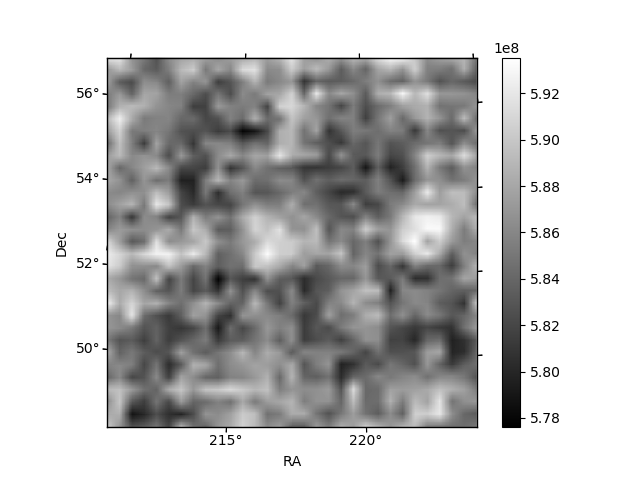
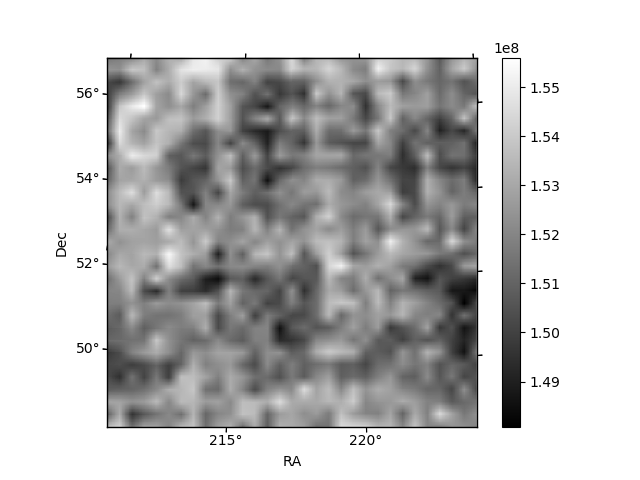
Histogram calculated using DETX and DETY for each event in the final _common_clean file
| Quadrant A | 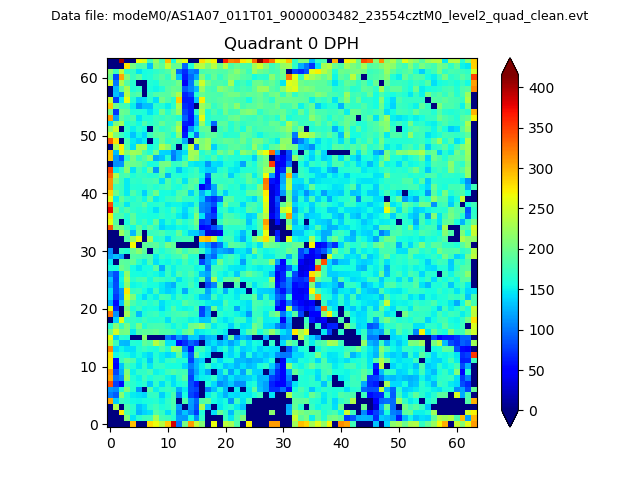 |
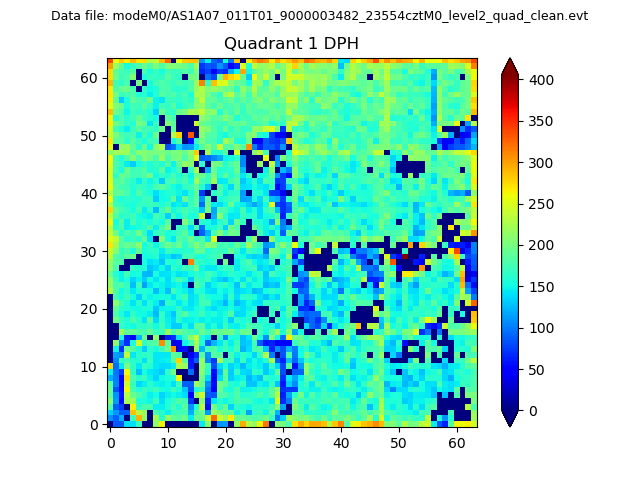 |
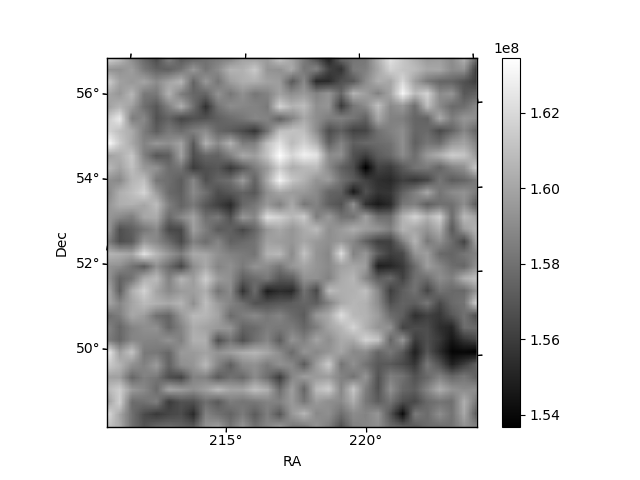
Quadrant B |
|---|---|---|---|
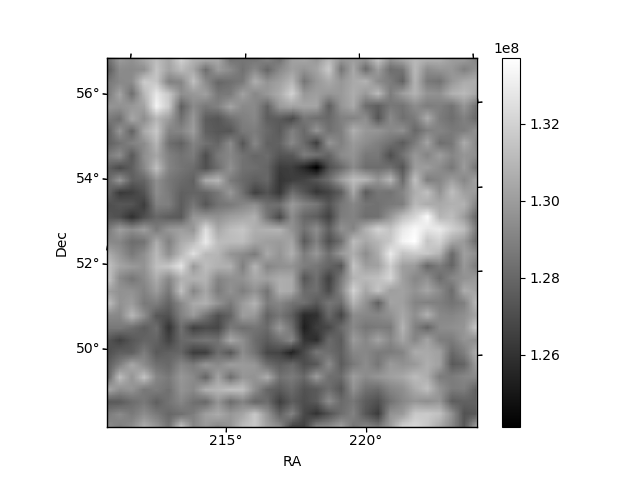
| Quadrant D | 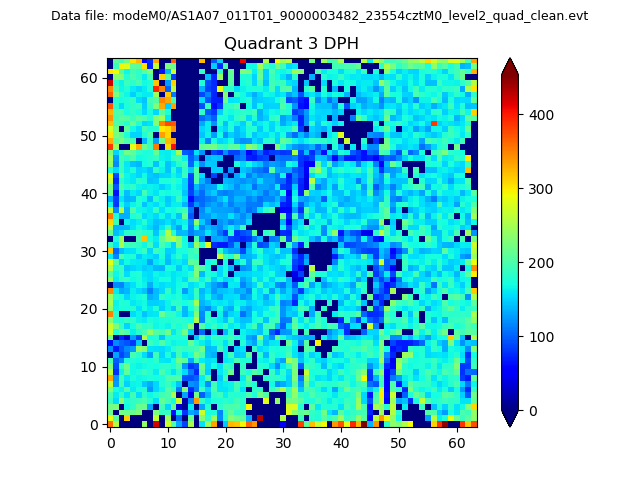 |
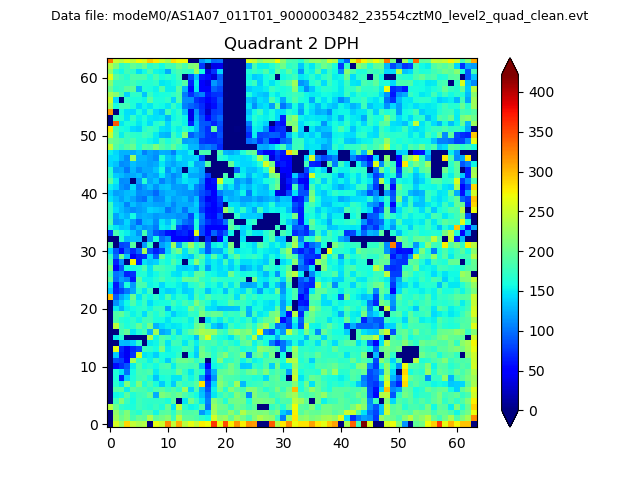 |
Quadrant C |
| Plot type | Count rate plots | Images |
|---|---|---|
| Comparison with Poisson distribution Blue bars denote a histogram of data divided into 1 sec bins. Red curve is a Poisson curve with rate = median count rate of data. |
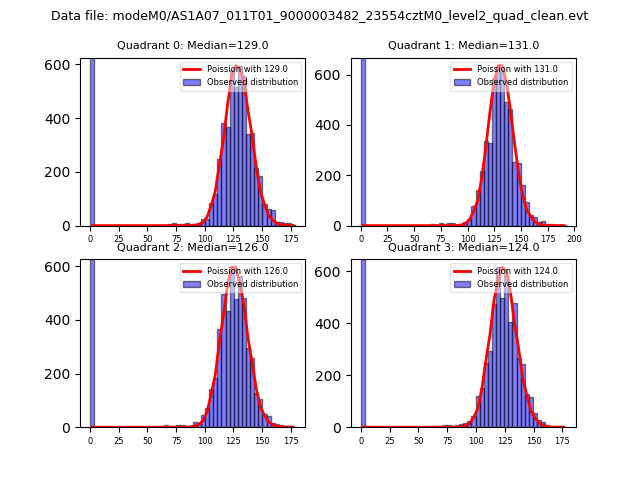 |
 |
| Quadrant-wise count rates Data is divided into 100 sec bins |
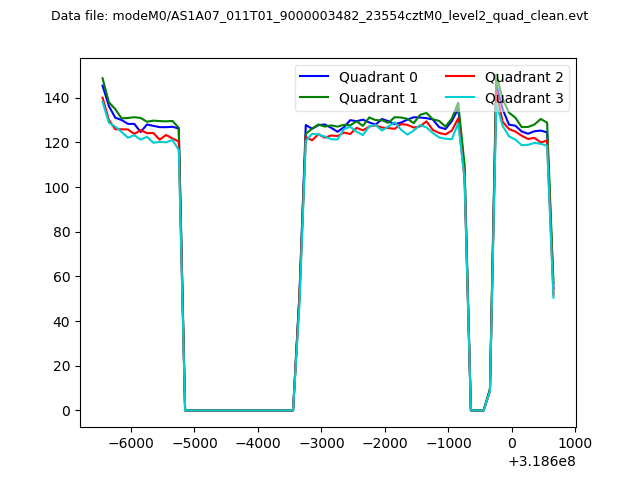 |
|
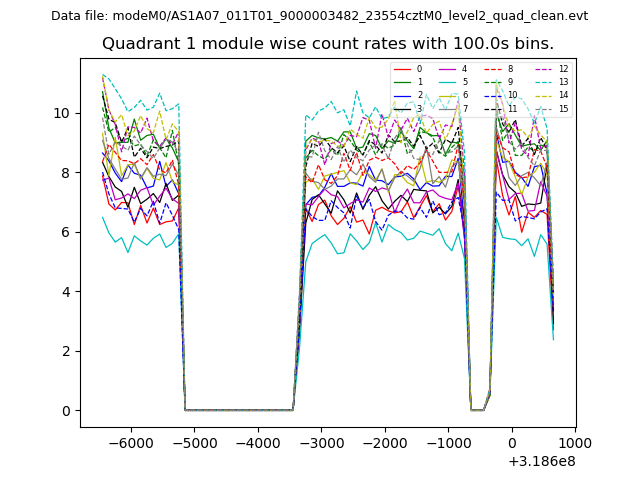
| Module-wise count rates for Quadrant A Data is divided into 100 sec bins |
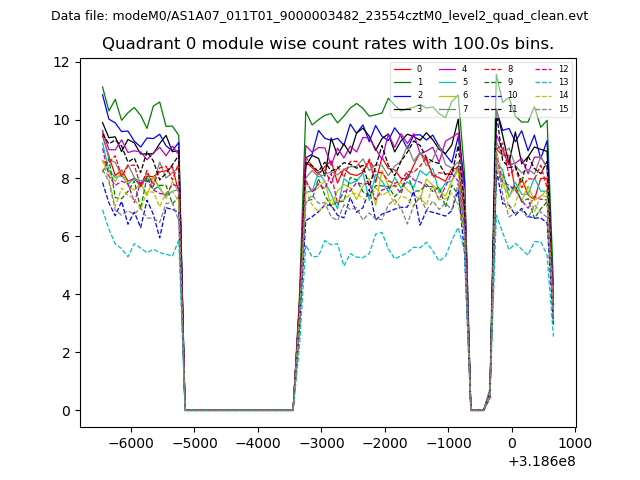 |
 |
| Module-wise count rates for Quadrant B Data is divided into 100 sec bins |
 |
 |
| Module-wise count rates for Quadrant C Data is divided into 100 sec bins |
 |
 |
| Module-wise count rates for Quadrant D Data is divided into 100 sec bins |
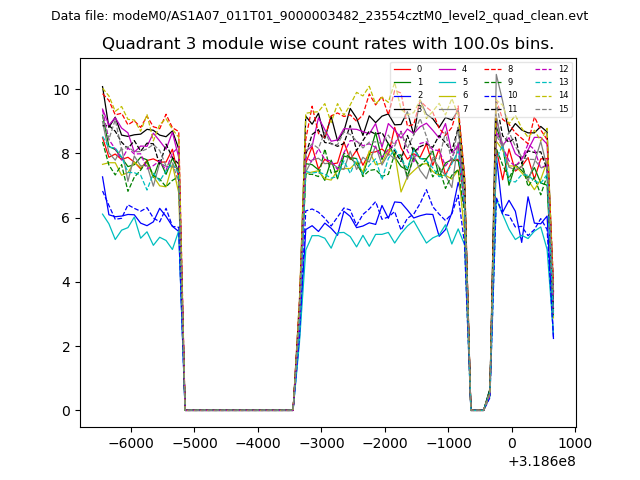 |
 |
| Parameter | Plot |
|---|---|
| CZT HV Monitor |  |
| D_VDD | 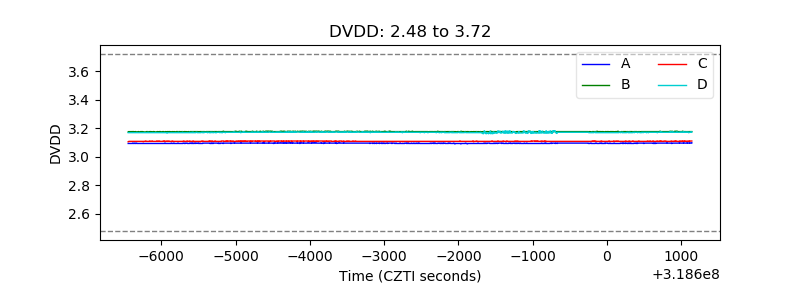 |
| Temperature 1 | 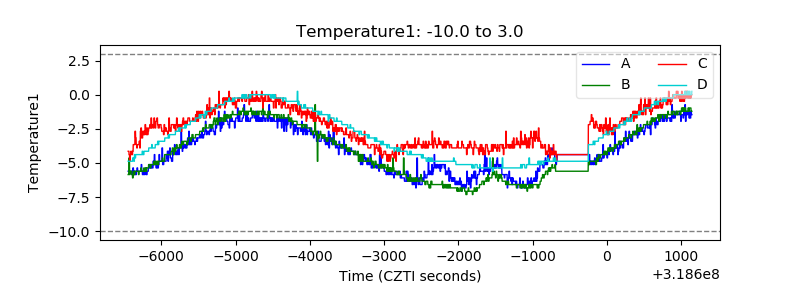 |
| Veto HV Monitor | 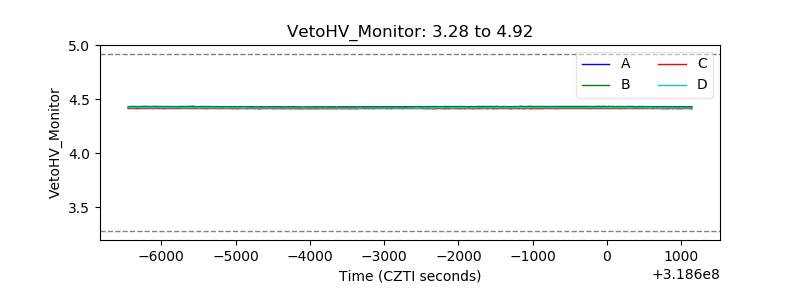 |
| Veto LLD | 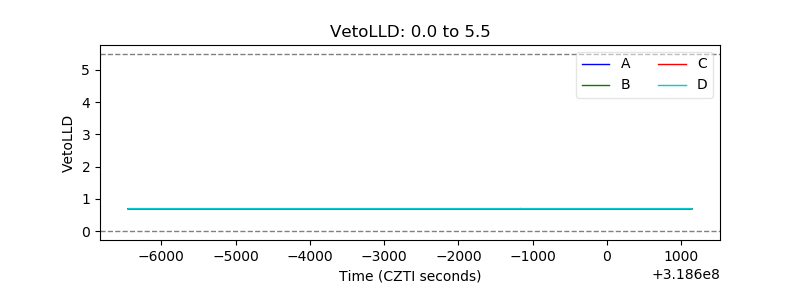 |
| Alpha Counter | 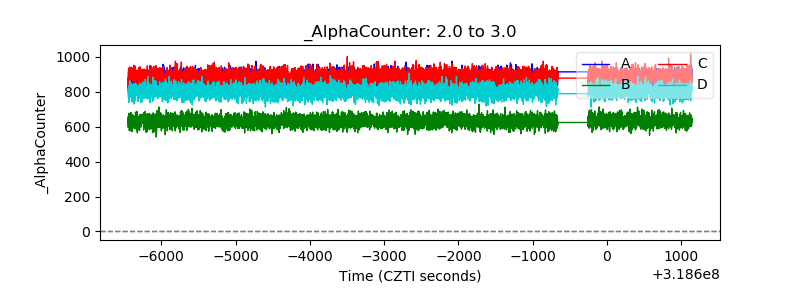 |
| _CPM_Rate | 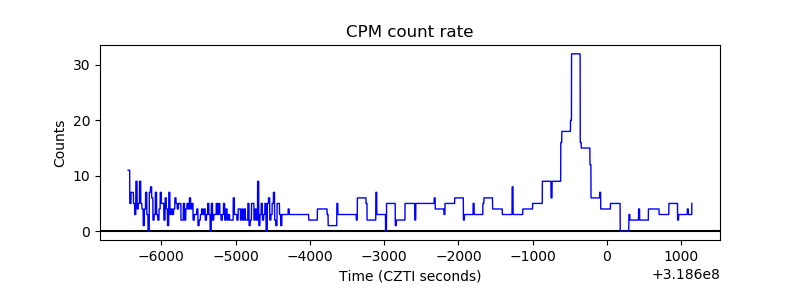 |
| CZT Counter | 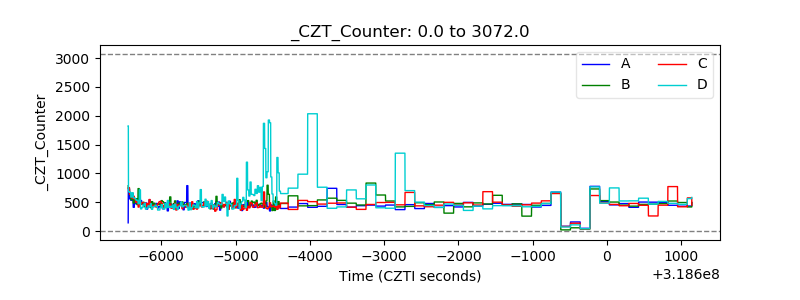 |
| +2.5 Volts monitor |  |
| +5 Volts monitor |  |
| _ROLL_ROT | 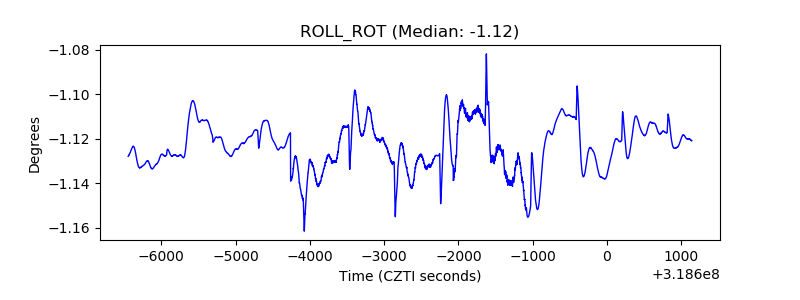 |
| _Roll_DEC | 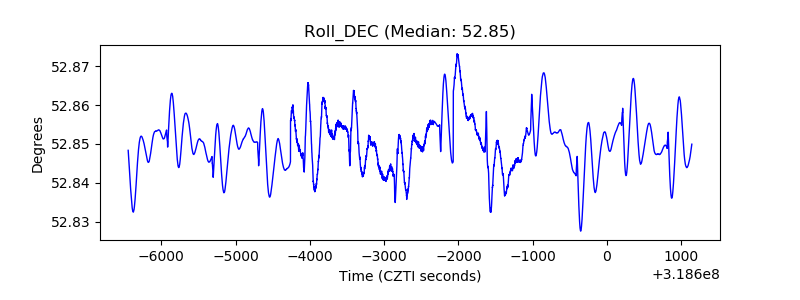 |
| _Roll_RA | 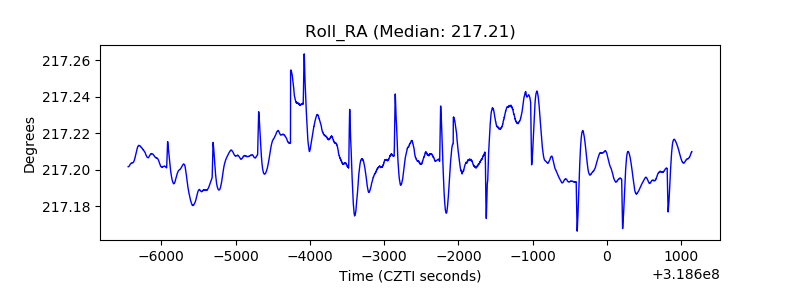 |
| Veto Counter | 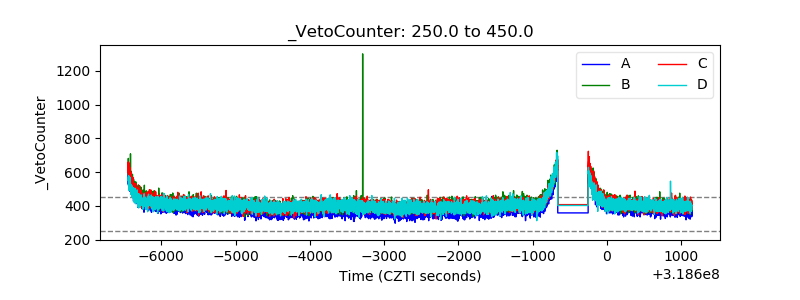 |