| Param | Original file | Final file |
|---|---|---|
| Filename | modeM0/AS1A07_011T01_9000003482_23555cztM0_level2.evt | modeM0/AS1A07_011T01_9000003482_23555cztM0_level2_quad_clean.evt |
| Size (bytes) | 534,024,000 | 90,694,080 |
| Size | 509.3 MB | 86.5 MB |
| Events in quadrant A | 3,503,114 | 564,037 |
| Events in quadrant B | 3,831,224 | 571,909 |
| Events in quadrant C | 3,826,211 | 548,135 |
| Events in quadrant D | 4,504,127 | 541,204 |
| Mode M9 | |||
|---|---|---|---|
| Quadrant | BADHDUFLAG | Total packets | Discarded packets |
| A | 0 | 3 | 0 |
| B | 0 | 3 | 0 |
| C | 0 | 3 | 0 |
| D | 0 | 4 | 1 |
| Mode SS | |||
|---|---|---|---|
| Quadrant | BADHDUFLAG | Total packets | Discarded packets |
| A | 0 | 150 | 0 |
| B | 0 | 150 | 0 |
| C | 0 | 150 | 0 |
| D | 0 | 150 | 0 |
| Mode M0 | |||
|---|---|---|---|
| Quadrant | BADHDUFLAG | Total packets | Discarded packets |
| A | 0 | 15432 | 83 |
| B | 0 | 16119 | 94 |
| C | 0 | 16214 | 79 |
| D | 0 | 18535 | 78 |
| Quadrant | Total seconds | Saturated seconds | Saturation percentage |
|---|---|---|---|
| A | 7493 | 135 | 1.801682% |
| B | 7490 | 167 | 2.229640% |
| C | 7493 | 220 | 2.936074% |
| D | 7494 | 152 | 2.028289% |
Noise dominated data is calculated using 1-second bins in cleaned event files. If a bin has >2000 counts, and if more than 50% of those come from <1% of pixels, then it is considered to be noise-dominated and hence unusable.
| Quadrant | # 1 sec bins | Bins with >0 counts | Bins with >2000 counts | High rate bins dominated by noise | Noise dominated (total time) | Noise dominated (detector-on time) | Marked lightcurve |
|---|---|---|---|---|---|---|---|
| A | 7823 | 7498 | 0 | 0 | 0.00% | 0.00% | 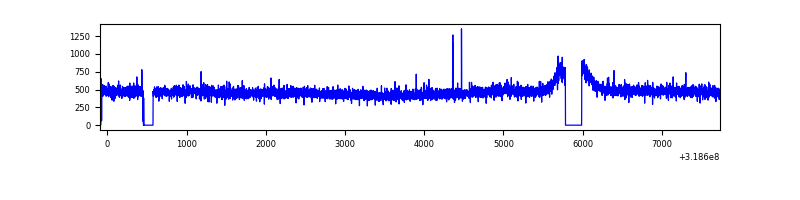 |
| B | 7820 | 7498 | 16 | 16 | 0.20% | 0.21% | 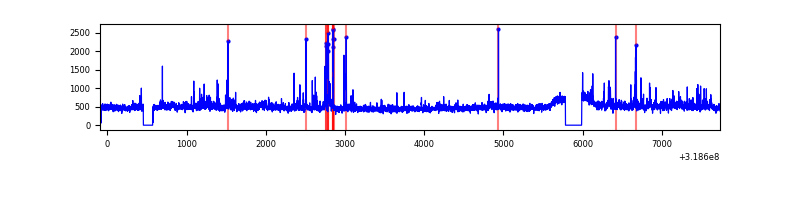 |
| C | 7821 | 7498 | 54 | 54 | 0.69% | 0.72% | 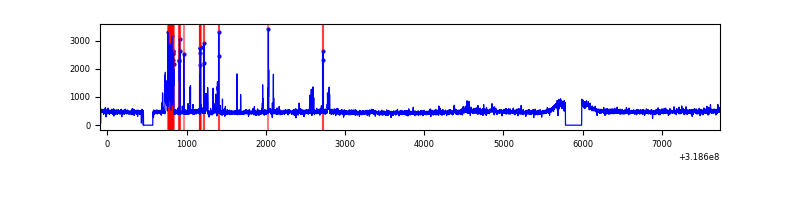 |
| D | 7825 | 7503 | 45 | 45 | 0.58% | 0.60% | 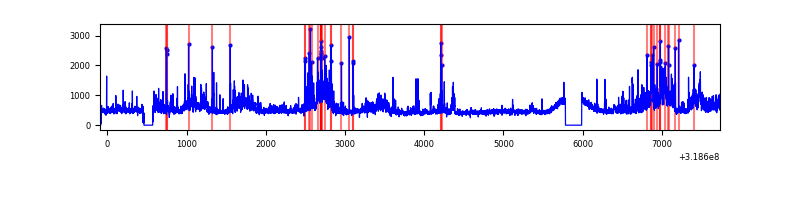 |
Top three noisy pixels from each quadrant. If the there are fewer than three noisy pixels in the level2.evt file, extra rows are filled as -1
| Pixel properties | Quadrant properties | ||||||
|---|---|---|---|---|---|---|---|
| Quadrant | DetID | PixID | Counts | Sigma | Mean | Median | Sigma |
| A | 13 | 254 | 12915 | 65.36 | 906 | 885 | 184.0 |
| A | 6 | 16 | 9060 | 44.42 | 906 | 885 | 184.0 |
| A | 3 | 137 | 8151 | 39.48 | 906 | 885 | 184.0 |
| B | 0 | 189 | 127724 | 741.05 | 894 | 873 | 171.2 |
| B | 0 | 229 | 88279 | 510.62 | 894 | 873 | 171.2 |
| B | 3 | 64 | 62110 | 357.74 | 894 | 873 | 171.2 |
| C | 10 | 9 | 306621 | 1527.47 | 857 | 861 | 200.2 |
| C | 14 | 238 | 133260 | 661.42 | 857 | 861 | 200.2 |
| C | 7 | 247 | 21400 | 102.61 | 857 | 861 | 200.2 |
| D | 1 | 52 | 506067 | 2361.39 | 876 | 848 | 214.0 |
| D | 9 | 85 | 456684 | 2130.57 | 876 | 848 | 214.0 |
| D | 12 | 233 | 87897 | 406.87 | 876 | 848 | 214.0 |
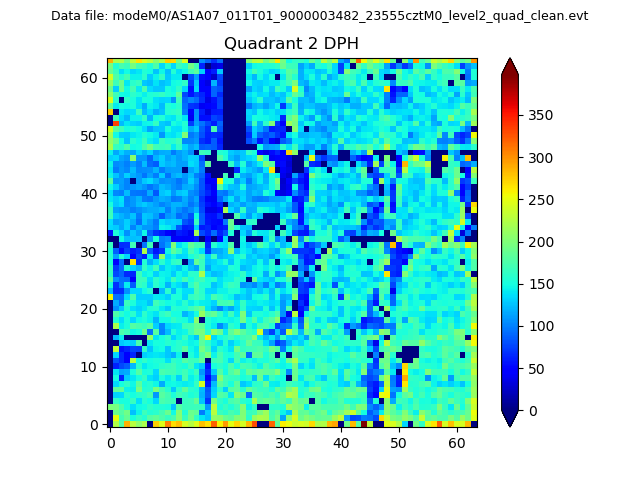
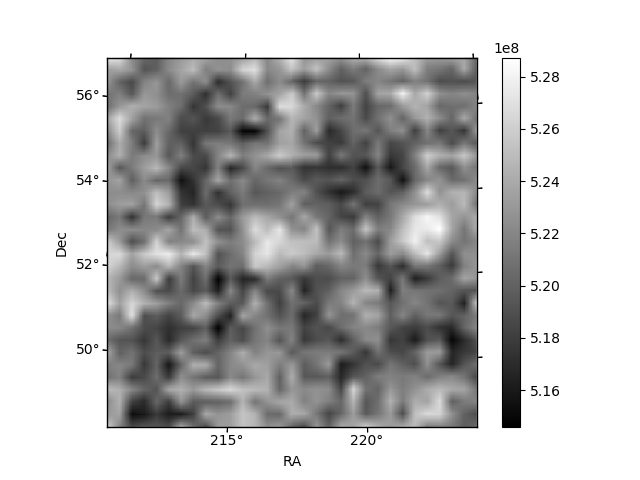
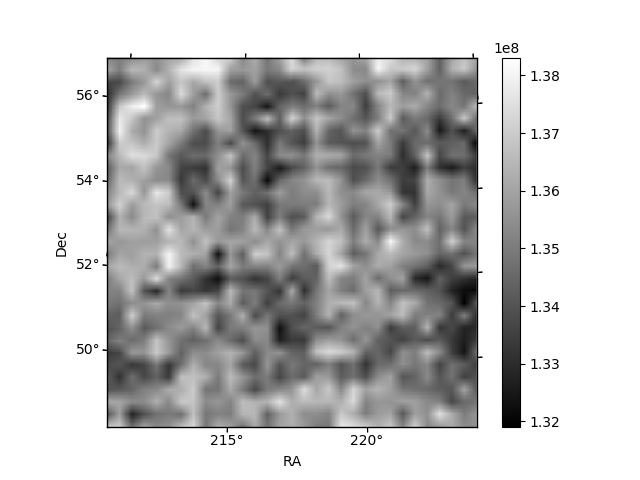
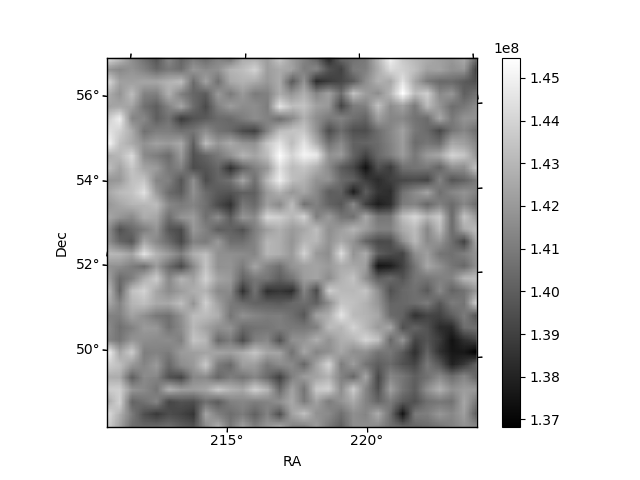
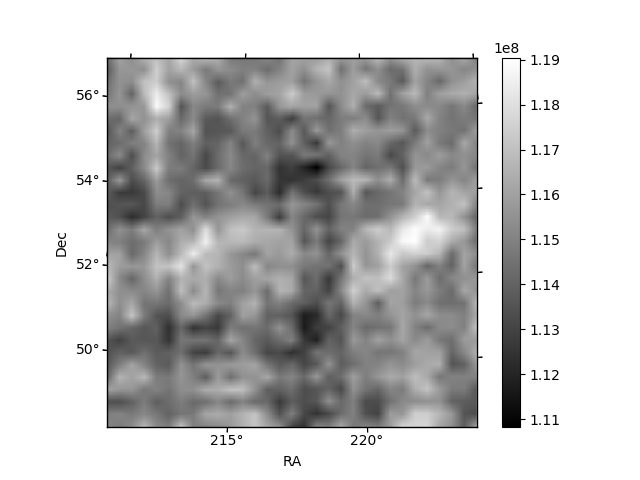
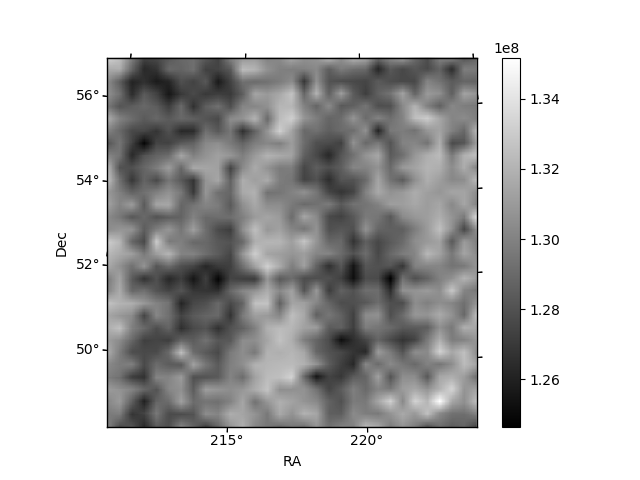
Histogram calculated using DETX and DETY for each event in the final _common_clean file
| Quadrant A | 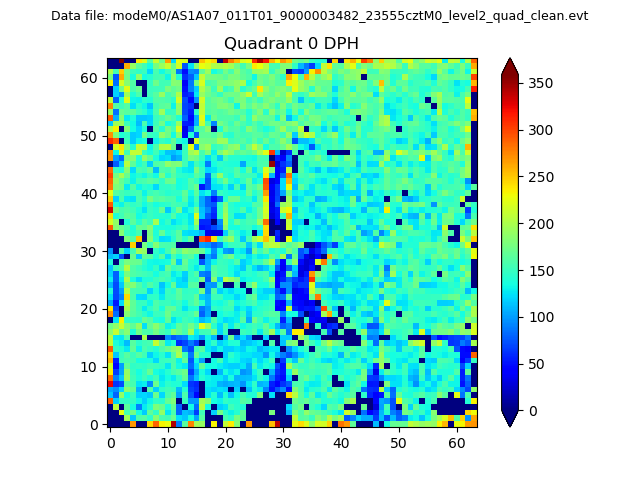 |
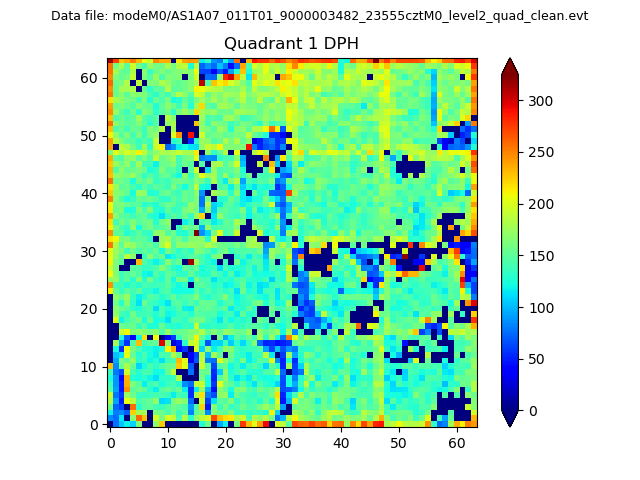 |
Quadrant B |
|---|---|---|---|
| Quadrant D | 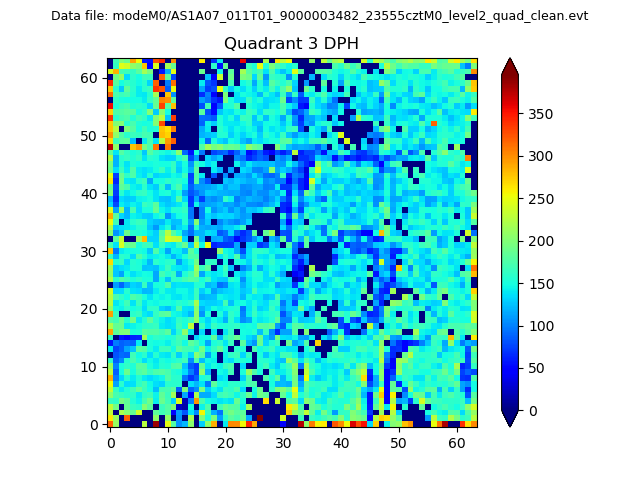 |
 |
Quadrant C |
| Plot type | Count rate plots | Images |
|---|---|---|
| Comparison with Poisson distribution Blue bars denote a histogram of data divided into 1 sec bins. Red curve is a Poisson curve with rate = median count rate of data. |
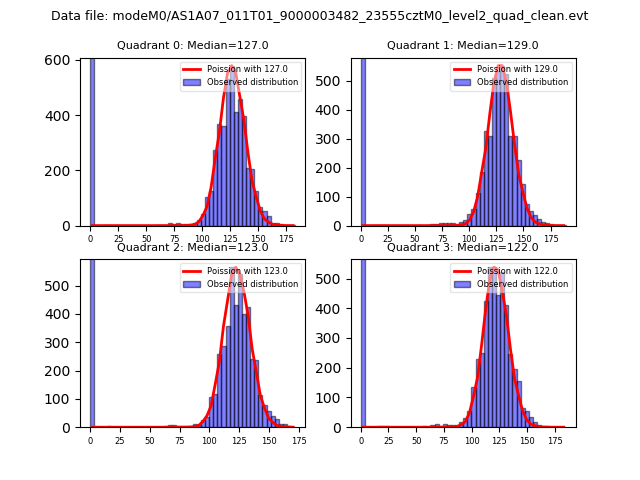 |
 |
| Quadrant-wise count rates Data is divided into 100 sec bins |
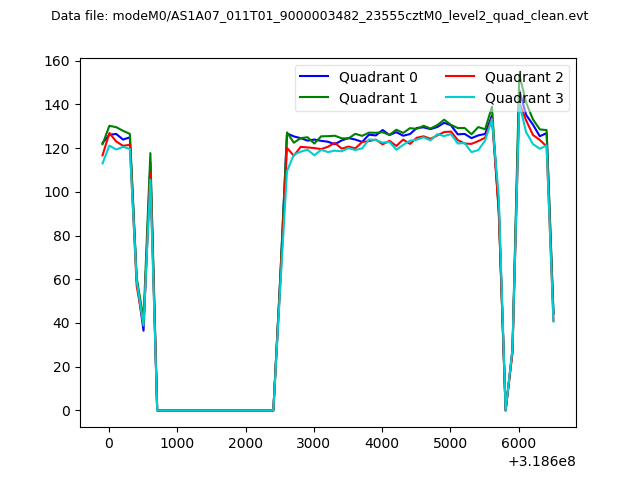 |
|
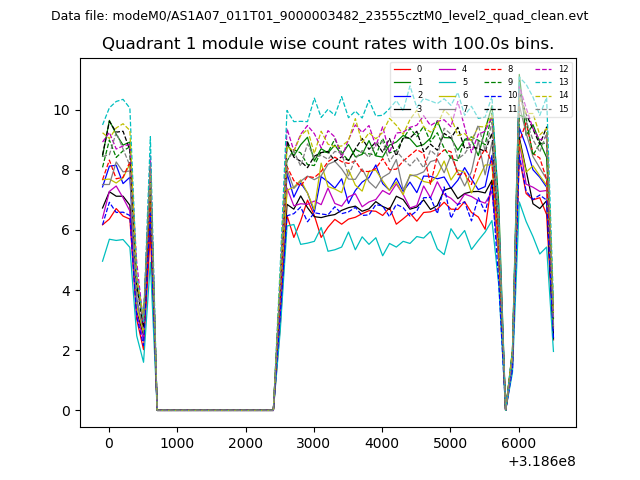
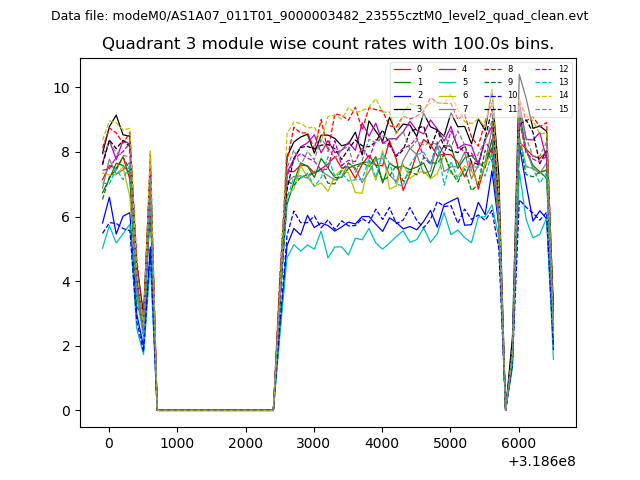
| Module-wise count rates for Quadrant A Data is divided into 100 sec bins |
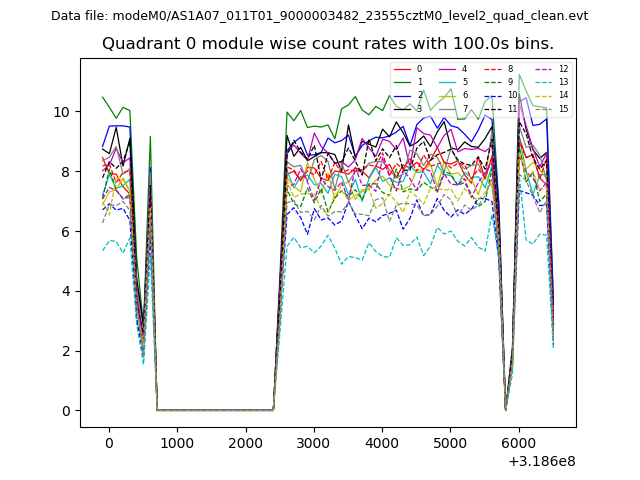 |
 |
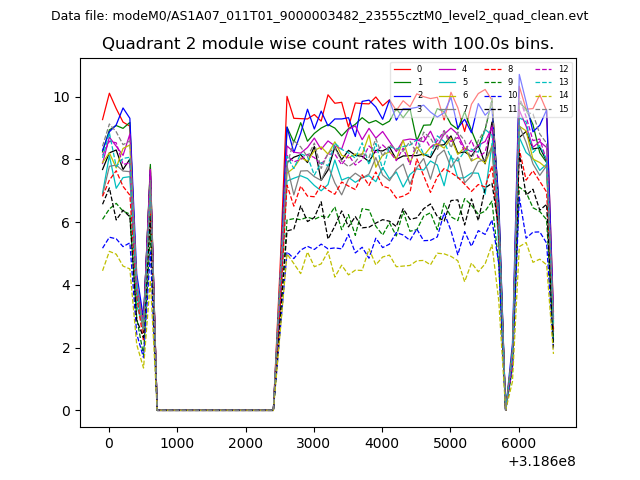
| Module-wise count rates for Quadrant B Data is divided into 100 sec bins |
 |
 |
| Module-wise count rates for Quadrant C Data is divided into 100 sec bins |
 |
 |
| Module-wise count rates for Quadrant D Data is divided into 100 sec bins |
 |
 |
| Parameter | Plot |
|---|---|
| CZT HV Monitor | 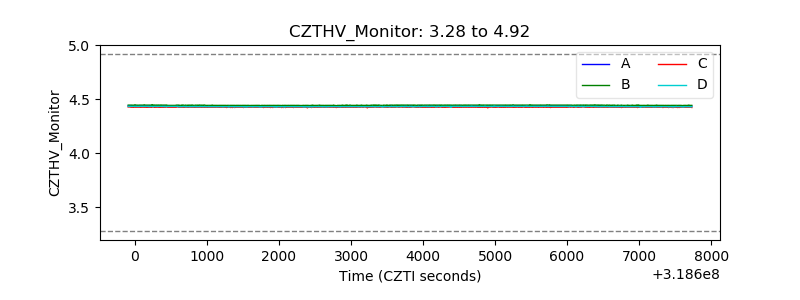 |
| D_VDD | 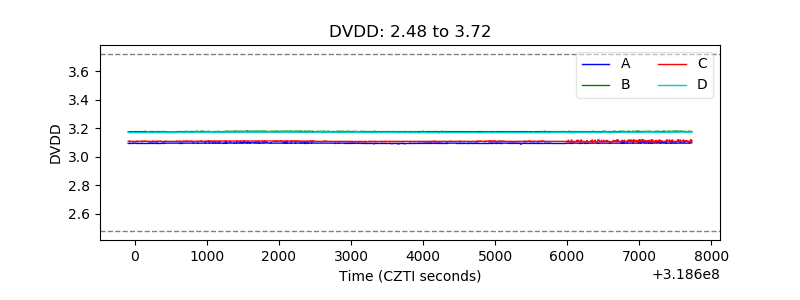 |
| Temperature 1 | 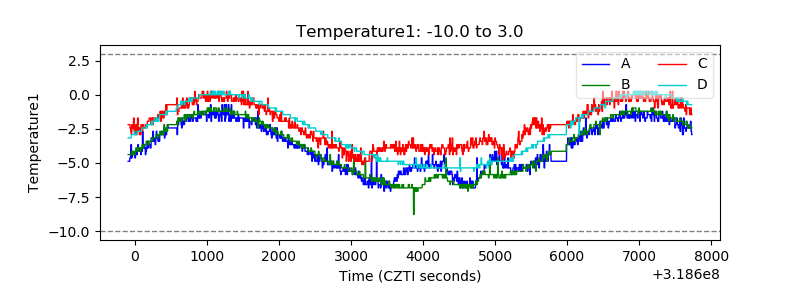 |
| Veto HV Monitor | 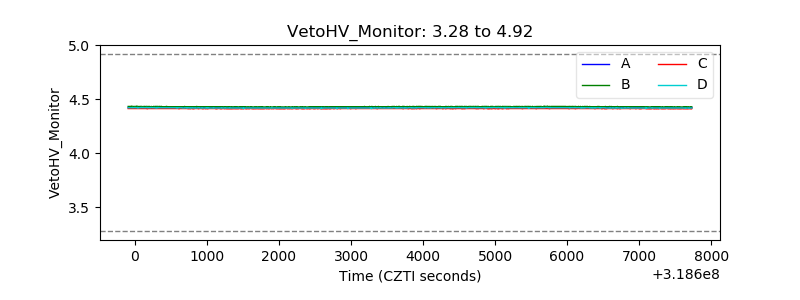 |
| Veto LLD | 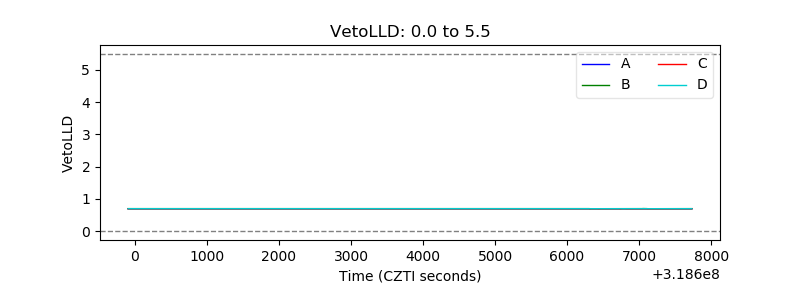 |
| Alpha Counter | 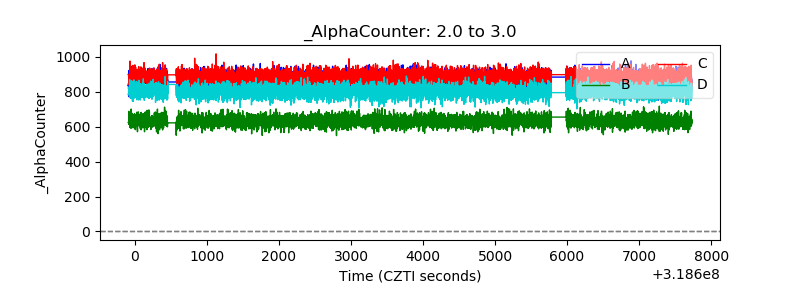 |
| _CPM_Rate |  |
| CZT Counter | 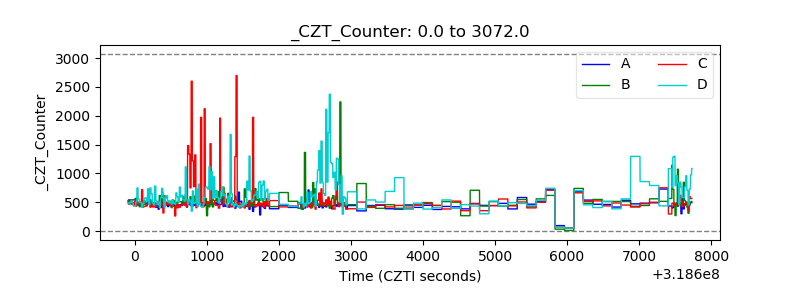 |
| +2.5 Volts monitor |  |
| +5 Volts monitor |  |
| _ROLL_ROT |  |
| _Roll_DEC | 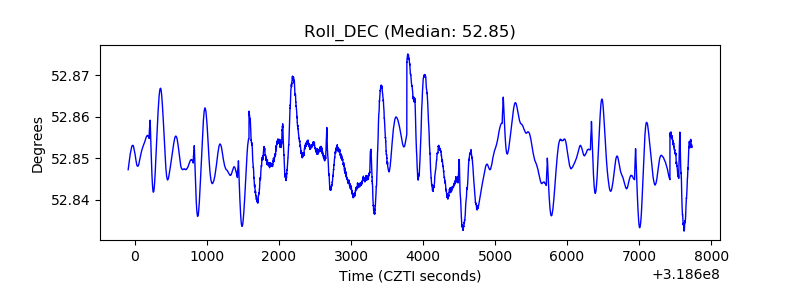 |
| _Roll_RA | 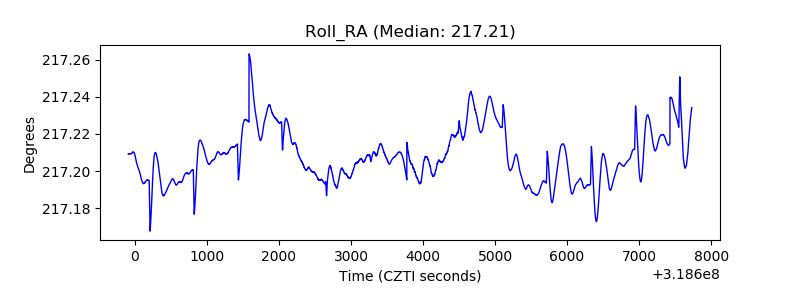 |
| Veto Counter | 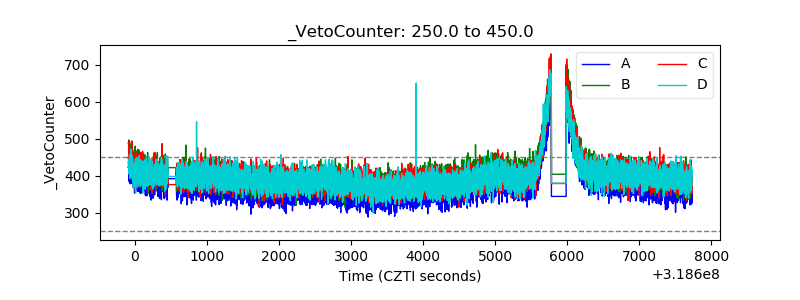 |