| Param | Original file | Final file |
|---|---|---|
| Filename | modeM0/AS1A07_011T01_9000003482_23558cztM0_level2.evt | modeM0/AS1A07_011T01_9000003482_23558cztM0_level2_quad_clean.evt |
| Size (bytes) | 324,760,320 | 50,731,200 |
| Size | 309.7 MB | 48.4 MB |
| Events in quadrant A | 2,271,780 | 301,465 |
| Events in quadrant B | 2,374,531 | 305,386 |
| Events in quadrant C | 2,372,565 | 295,230 |
| Events in quadrant D | 2,481,966 | 289,500 |
| Mode M9 | |||
|---|---|---|---|
| Quadrant | BADHDUFLAG | Total packets | Discarded packets |
| A | 0 | 7 | 0 |
| B | 0 | 7 | 0 |
| C | 0 | 7 | 0 |
| D | 0 | 7 | 0 |
| Mode SS | |||
|---|---|---|---|
| Quadrant | BADHDUFLAG | Total packets | Discarded packets |
| A | 0 | 100 | 0 |
| B | 0 | 100 | 0 |
| C | 0 | 100 | 0 |
| D | 0 | 100 | 0 |
| Mode M0 | |||
|---|---|---|---|
| Quadrant | BADHDUFLAG | Total packets | Discarded packets |
| A | 0 | 10077 | 19 |
| B | 0 | 10222 | 10 |
| C | 0 | 10217 | 14 |
| D | 0 | 10946 | 31 |
| Quadrant | Total seconds | Saturated seconds | Saturation percentage |
|---|---|---|---|
| A | 4907 | 30 | 0.611372% |
| B | 4907 | 41 | 0.835541% |
| C | 4908 | 76 | 1.548492% |
| D | 4897 | 80 | 1.633653% |
Noise dominated data is calculated using 1-second bins in cleaned event files. If a bin has >2000 counts, and if more than 50% of those come from <1% of pixels, then it is considered to be noise-dominated and hence unusable.
| Quadrant | # 1 sec bins | Bins with >0 counts | Bins with >2000 counts | High rate bins dominated by noise | Noise dominated (total time) | Noise dominated (detector-on time) | Marked lightcurve |
|---|---|---|---|---|---|---|---|
| A | 5609 | 4915 | 0 | 0 | 0.00% | 0.00% | 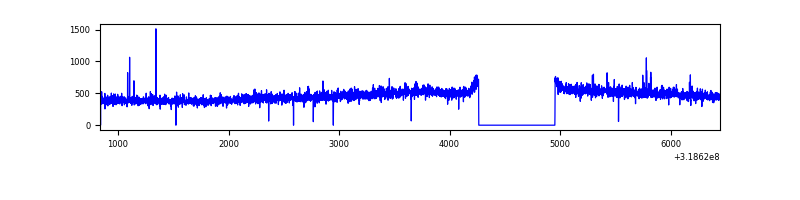 |
| B | 5609 | 4918 | 3 | 3 | 0.05% | 0.06% | 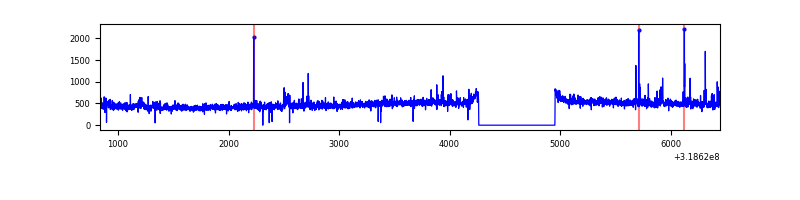 |
| C | 5609 | 4916 | 5 | 5 | 0.09% | 0.10% | 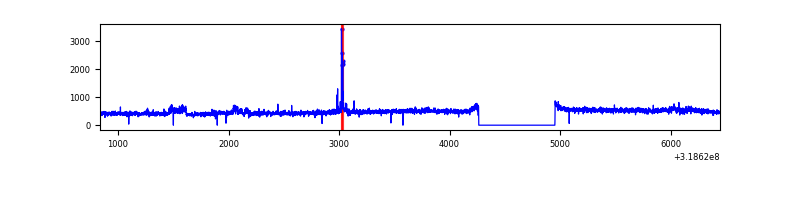 |
| D | 5609 | 4913 | 36 | 36 | 0.64% | 0.73% | 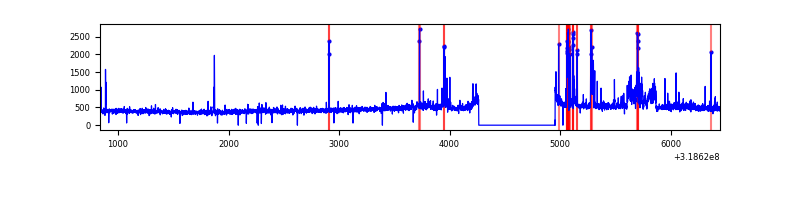 |
Top three noisy pixels from each quadrant. If the there are fewer than three noisy pixels in the level2.evt file, extra rows are filled as -1
| Pixel properties | Quadrant properties | ||||||
|---|---|---|---|---|---|---|---|
| Quadrant | DetID | PixID | Counts | Sigma | Mean | Median | Sigma |
| A | 6 | 16 | 14058 | 112.58 | 584 | 571 | 119.8 |
| A | 13 | 254 | 8651 | 67.45 | 584 | 571 | 119.8 |
| A | 3 | 137 | 5342 | 39.82 | 584 | 571 | 119.8 |
| B | 0 | 189 | 43449 | 382.46 | 580 | 566 | 112.1 |
| B | 12 | 111 | 13850 | 118.48 | 580 | 566 | 112.1 |
| B | 12 | 0 | 13798 | 118.01 | 580 | 566 | 112.1 |
| C | 14 | 238 | 88016 | 666.61 | 558 | 562 | 131.2 |
| C | 3 | 233 | 67570 | 510.76 | 558 | 562 | 131.2 |
| C | 7 | 247 | 33286 | 249.44 | 558 | 562 | 131.2 |
| D | 1 | 52 | 218444 | 1569.55 | 565 | 549 | 138.8 |
| D | 12 | 233 | 35460 | 251.47 | 565 | 549 | 138.8 |
| D | 2 | 234 | 22699 | 159.55 | 565 | 549 | 138.8 |
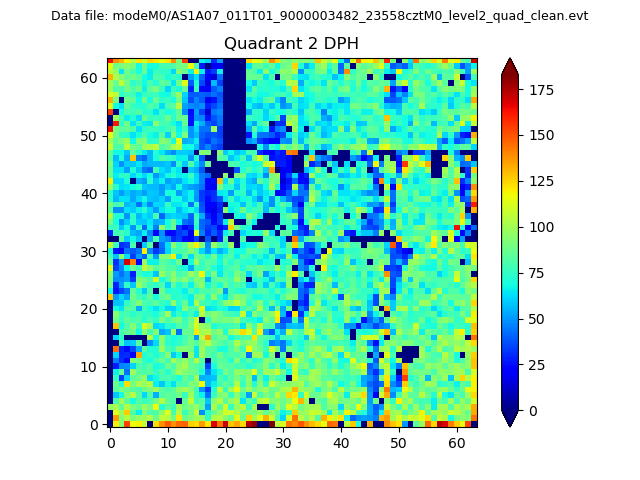
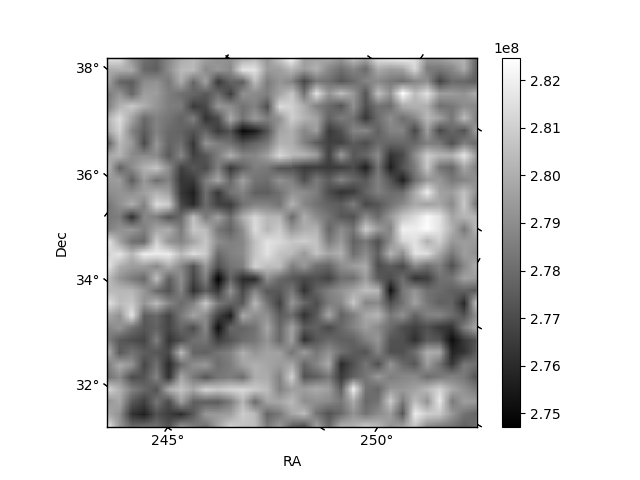
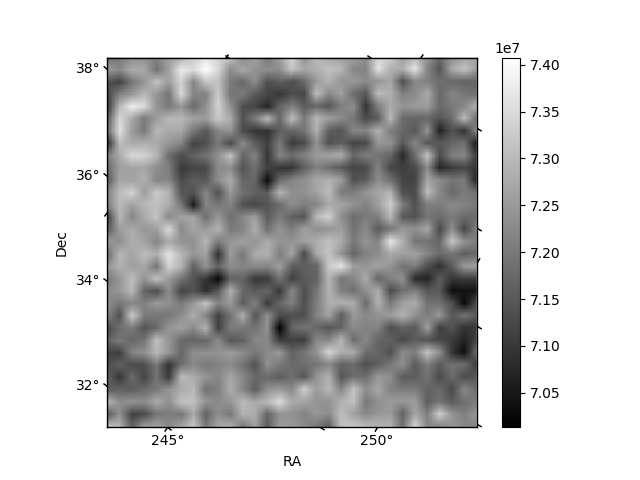
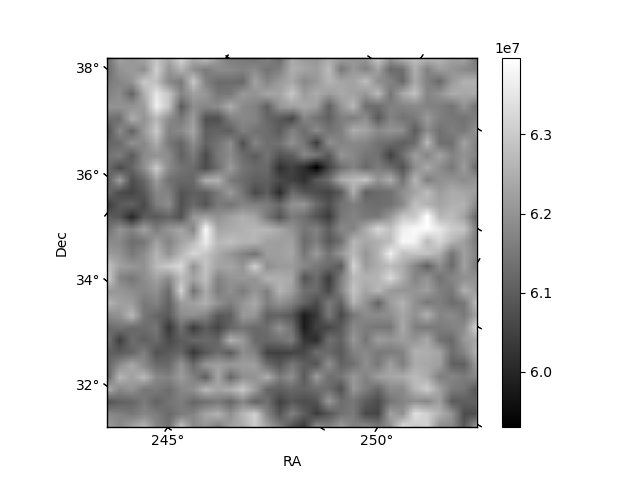
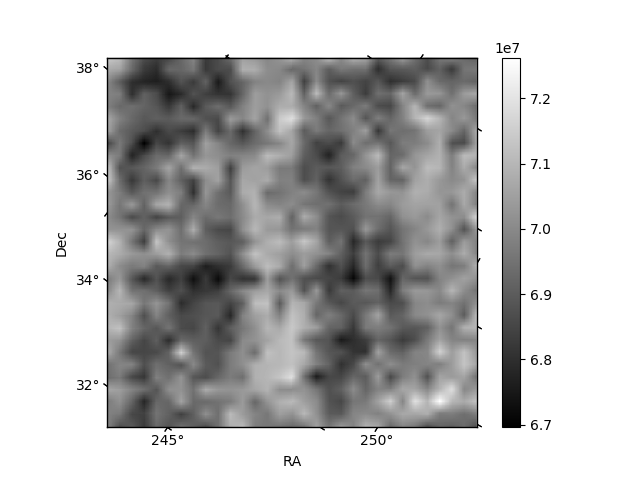
Histogram calculated using DETX and DETY for each event in the final _common_clean file
| Quadrant A | 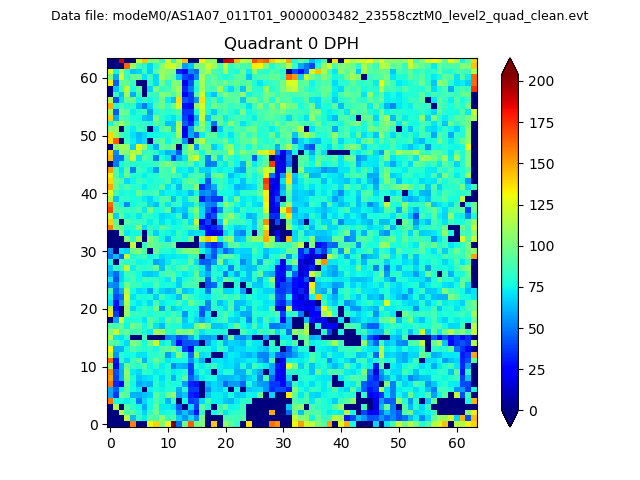 |
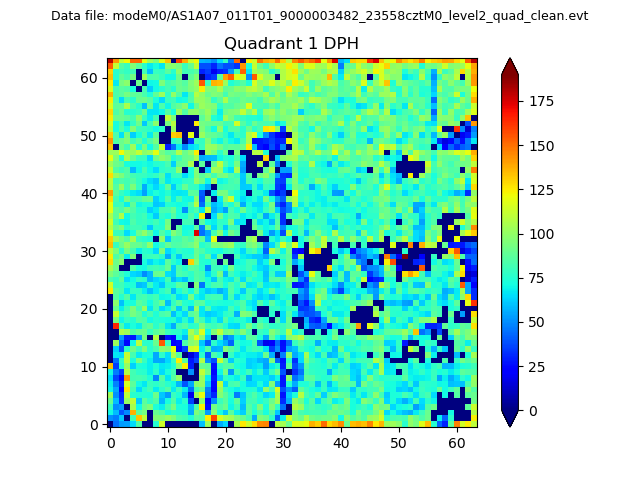 |
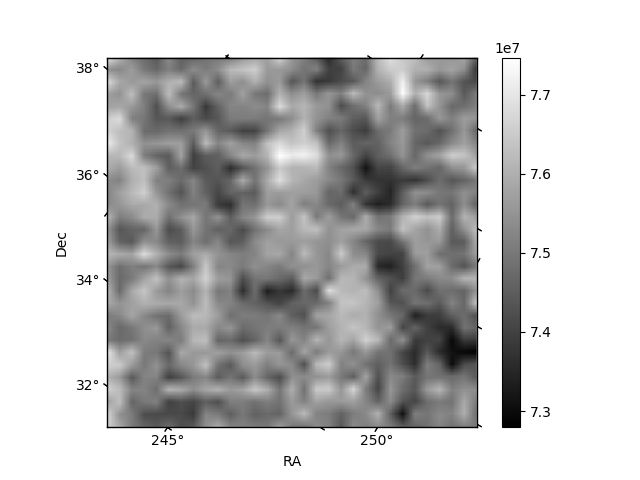
Quadrant B |
|---|---|---|---|
| Quadrant D | 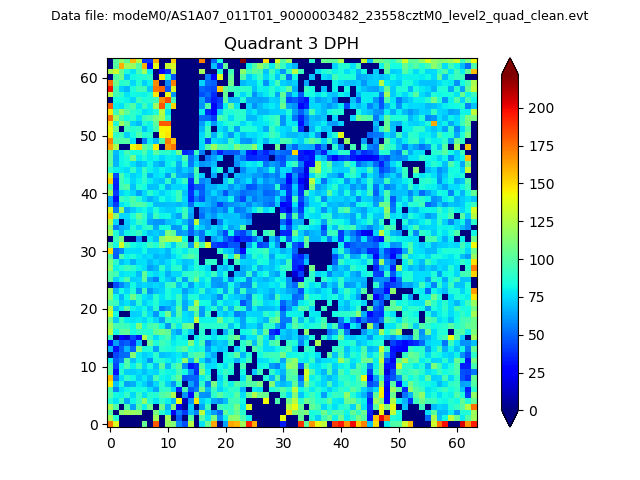 |
 |
Quadrant C |
| Plot type | Count rate plots | Images |
|---|---|---|
| Comparison with Poisson distribution Blue bars denote a histogram of data divided into 1 sec bins. Red curve is a Poisson curve with rate = median count rate of data. |
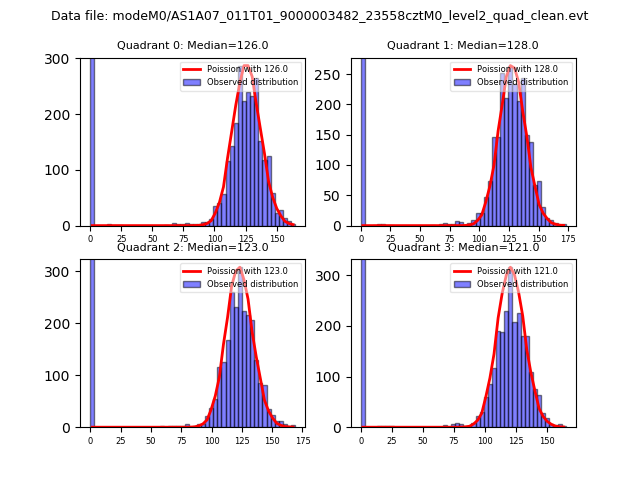 |
 |
| Quadrant-wise count rates Data is divided into 100 sec bins |
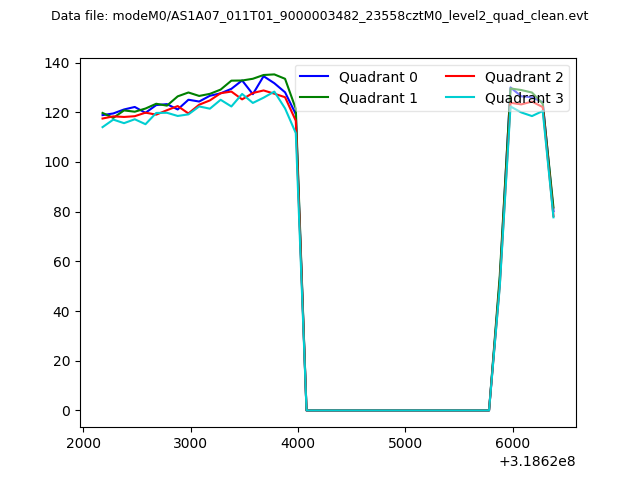 |
|
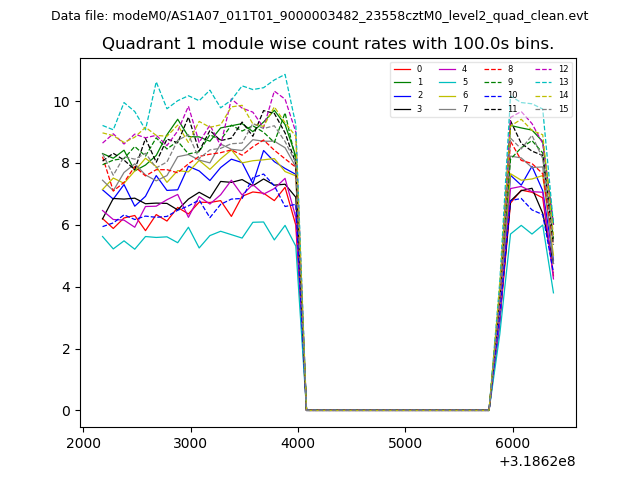
| Module-wise count rates for Quadrant A Data is divided into 100 sec bins |
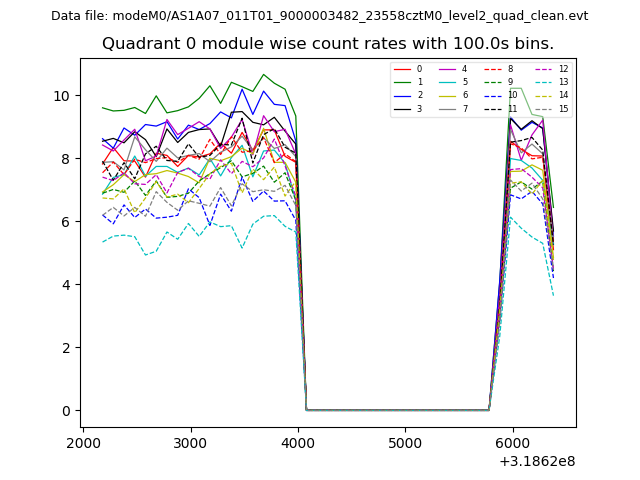 |
 |
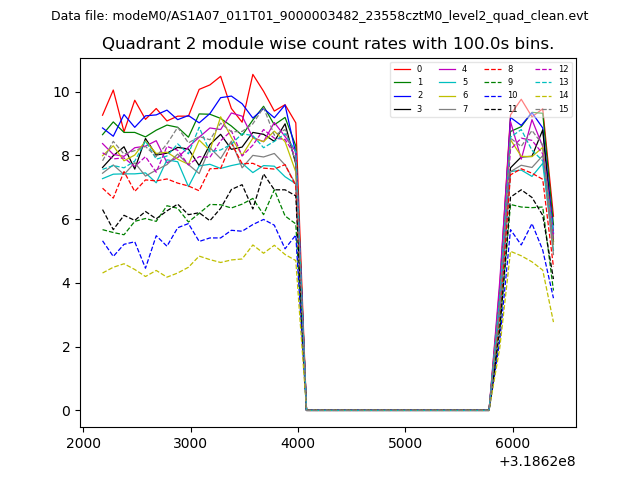
| Module-wise count rates for Quadrant B Data is divided into 100 sec bins |
 |
 |
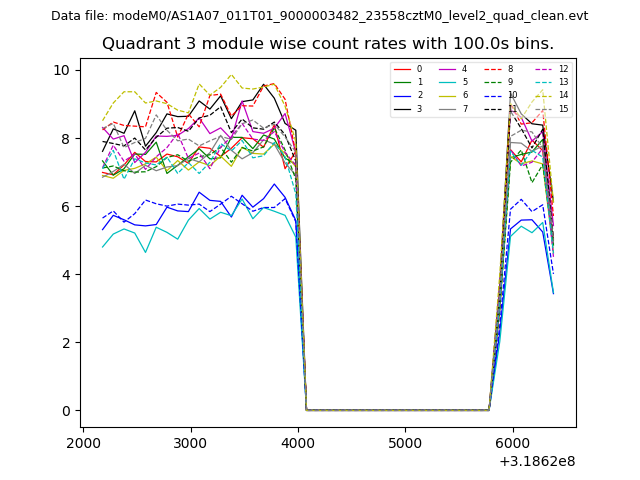
| Module-wise count rates for Quadrant C Data is divided into 100 sec bins |
 |
 |
| Module-wise count rates for Quadrant D Data is divided into 100 sec bins |
 |
 |
| Parameter | Plot |
|---|---|
| CZT HV Monitor |  |
| D_VDD | 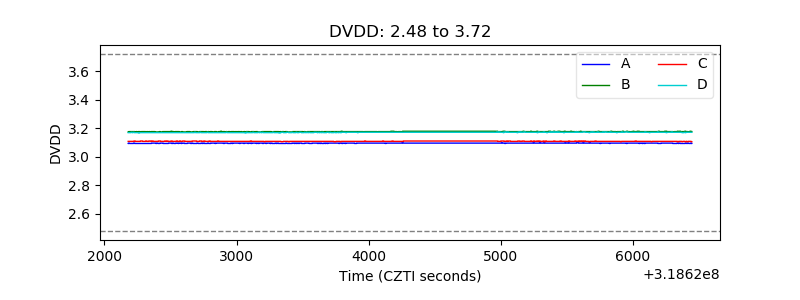 |
| Temperature 1 | 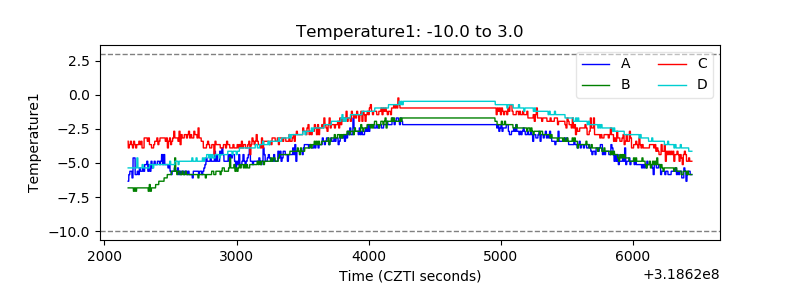 |
| Veto HV Monitor | 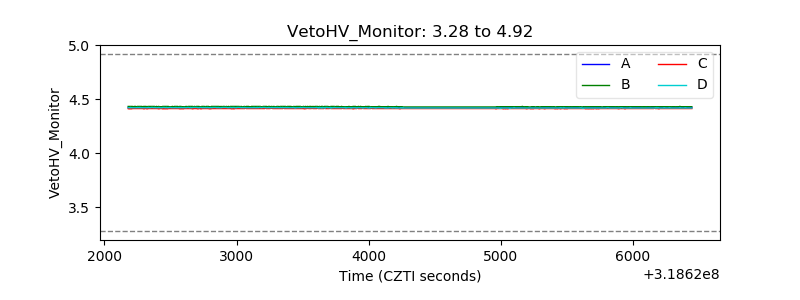 |
| Veto LLD | 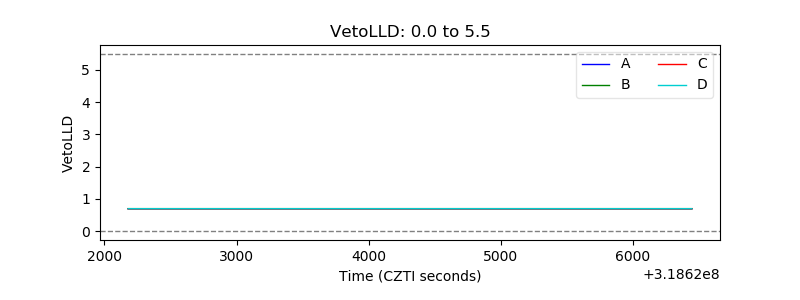 |
| Alpha Counter | 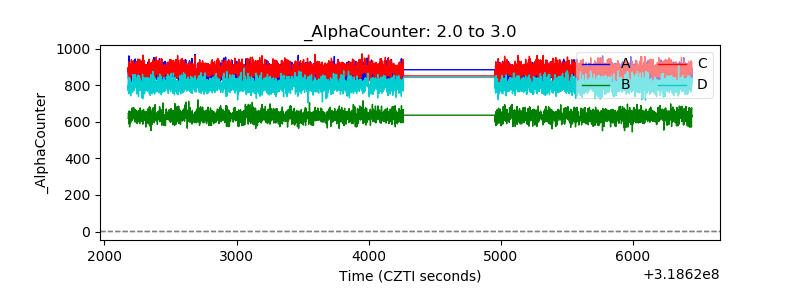 |
| _CPM_Rate | 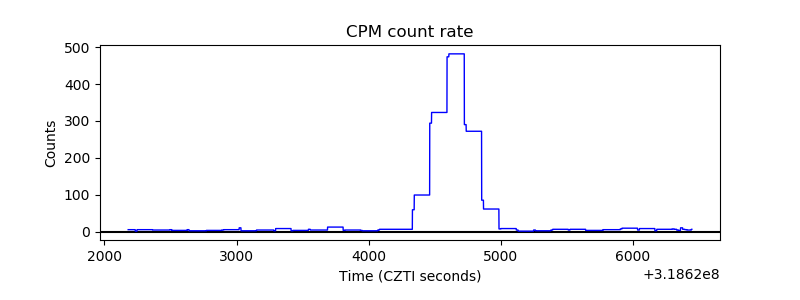 |
| CZT Counter | 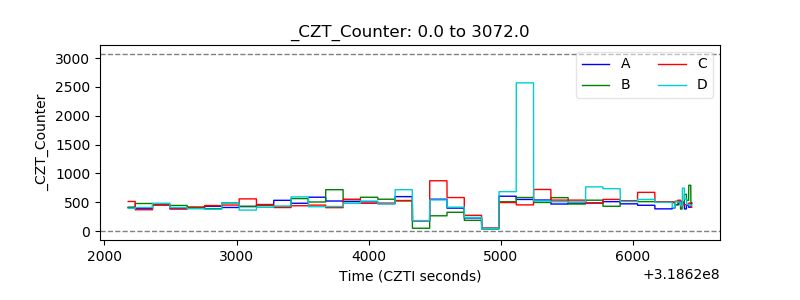 |
| +2.5 Volts monitor |  |
| +5 Volts monitor |  |
| _ROLL_ROT | 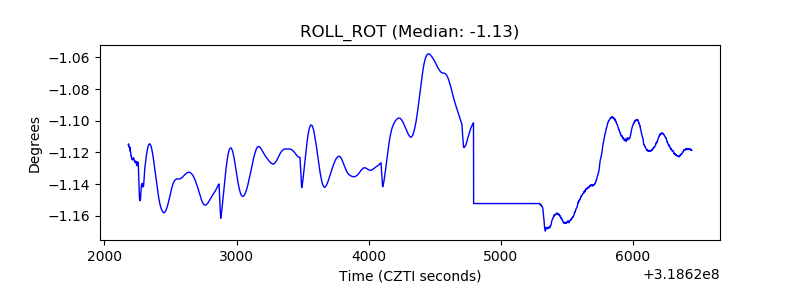 |
| _Roll_DEC | 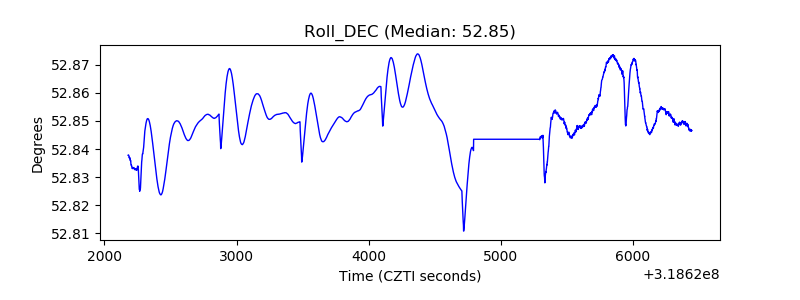 |
| _Roll_RA | 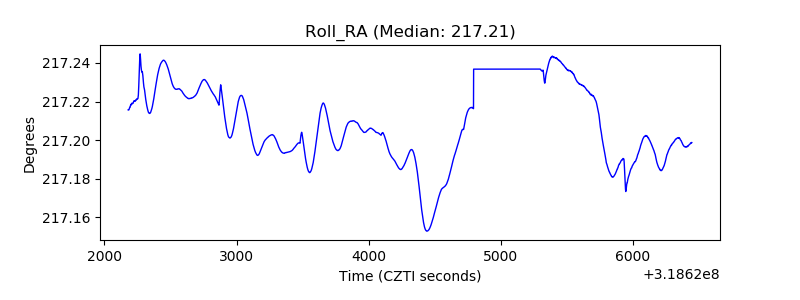 |
| Veto Counter |  |