| Param | Original file | Final file |
|---|---|---|
| Filename | modeM0/AS1A07_011T01_9000003482_23562cztM0_level2.evt | modeM0/AS1A07_011T01_9000003482_23562cztM0_level2_quad_clean.evt |
| Size (bytes) | 422,631,360 | 95,880,960 |
| Size | 403.1 MB | 91.4 MB |
| Events in quadrant A | 2,809,960 | 627,371 |
| Events in quadrant B | 3,068,140 | 646,712 |
| Events in quadrant C | 2,935,290 | 619,327 |
| Events in quadrant D | 3,580,500 | 593,953 |
| Mode M9 | |||
|---|---|---|---|
| Quadrant | BADHDUFLAG | Total packets | Discarded packets |
| A | 0 | 22 | 4 |
| B | 0 | 21 | 1 |
| C | 0 | 21 | 4 |
| D | 0 | 22 | 4 |
| Mode SS | |||
|---|---|---|---|
| Quadrant | BADHDUFLAG | Total packets | Discarded packets |
| A | 0 | 134 | 8 |
| B | 0 | 133 | 7 |
| C | 0 | 135 | 11 |
| D | 0 | 133 | 7 |
| Mode M0 | |||
|---|---|---|---|
| Quadrant | BADHDUFLAG | Total packets | Discarded packets |
| A | 0 | 13630 | 1260 |
| B | 0 | 14489 | 1394 |
| C | 0 | 13939 | 1302 |
| D | 0 | 16310 | 1542 |
| Quadrant | Total seconds | Saturated seconds | Saturation percentage |
|---|---|---|---|
| A | 5957 | 21 | 0.352526% |
| B | 5943 | 90 | 1.514387% |
| C | 5963 | 92 | 1.542848% |
| D | 5947 | 169 | 2.841769% |
Noise dominated data is calculated using 1-second bins in cleaned event files. If a bin has >2000 counts, and if more than 50% of those come from <1% of pixels, then it is considered to be noise-dominated and hence unusable.
| Quadrant | # 1 sec bins | Bins with >0 counts | Bins with >2000 counts | High rate bins dominated by noise | Noise dominated (total time) | Noise dominated (detector-on time) | Marked lightcurve |
|---|---|---|---|---|---|---|---|
| A | 8735 | 6094 | 0 | 0 | 0.00% | 0.00% | 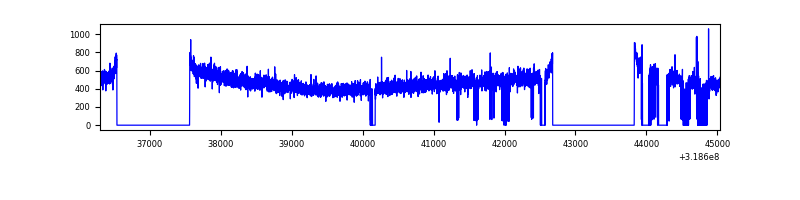 |
| B | 8735 | 6067 | 29 | 29 | 0.33% | 0.48% | 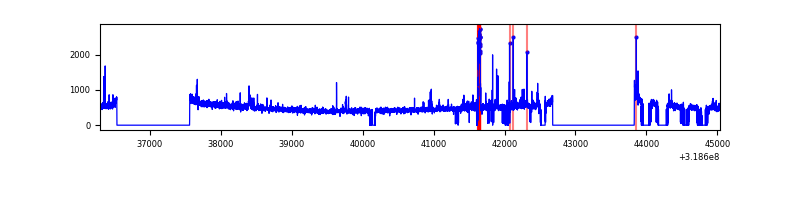 |
| C | 8736 | 6094 | 1 | 1 | 0.01% | 0.02% | 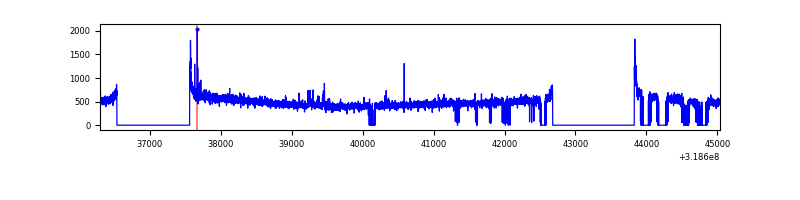 |
| D | 8736 | 6075 | 114 | 114 | 1.30% | 1.88% | 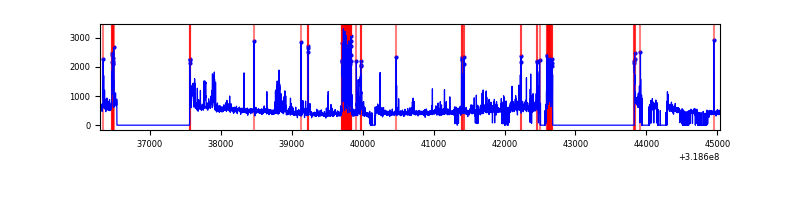 |
Top three noisy pixels from each quadrant. If the there are fewer than three noisy pixels in the level2.evt file, extra rows are filled as -1
| Pixel properties | Quadrant properties | ||||||
|---|---|---|---|---|---|---|---|
| Quadrant | DetID | PixID | Counts | Sigma | Mean | Median | Sigma |
| A | 13 | 254 | 9824 | 62.36 | 728 | 713 | 146.1 |
| A | 3 | 137 | 6378 | 38.77 | 728 | 713 | 146.1 |
| A | 0 | 226 | 6249 | 37.89 | 728 | 713 | 146.1 |
| B | 0 | 189 | 78654 | 558.14 | 729 | 711 | 139.6 |
| B | 10 | 247 | 69807 | 494.79 | 729 | 711 | 139.6 |
| B | 12 | 111 | 16614 | 113.88 | 729 | 711 | 139.6 |
| C | 14 | 238 | 112818 | 683.6 | 707 | 712 | 164.0 |
| C | 10 | 9 | 25955 | 153.93 | 707 | 712 | 164.0 |
| C | 0 | 10 | 25604 | 151.79 | 707 | 712 | 164.0 |
| D | 1 | 52 | 642248 | 3788.88 | 702 | 681 | 169.3 |
| D | 12 | 233 | 113686 | 667.37 | 702 | 681 | 169.3 |
| D | 9 | 85 | 70150 | 410.26 | 702 | 681 | 169.3 |
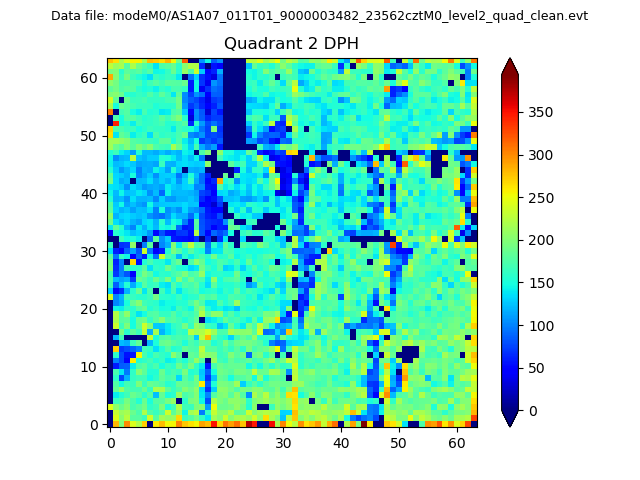
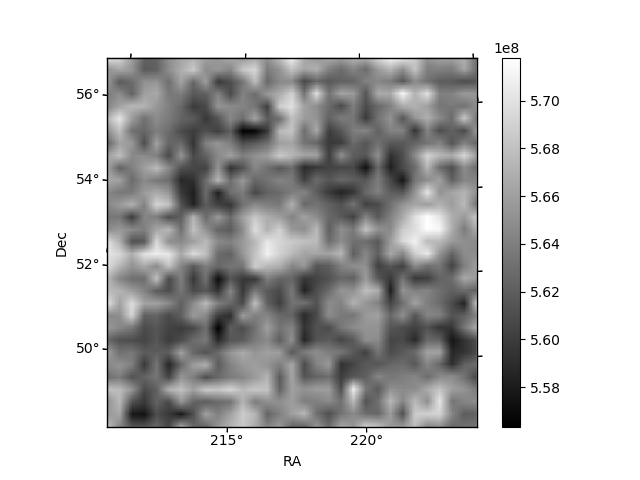
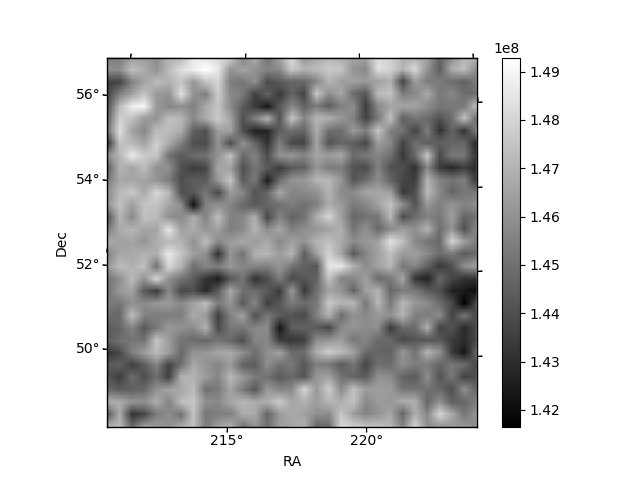
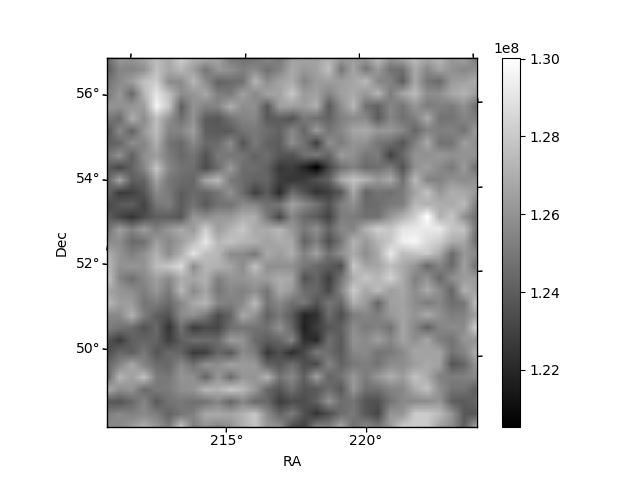
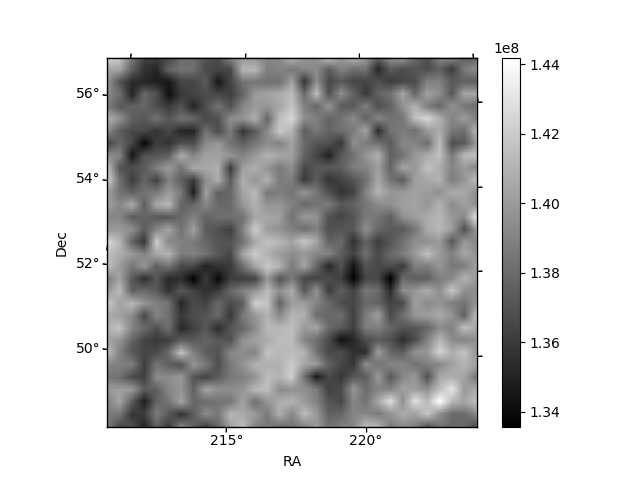
Histogram calculated using DETX and DETY for each event in the final _common_clean file
| Quadrant A | 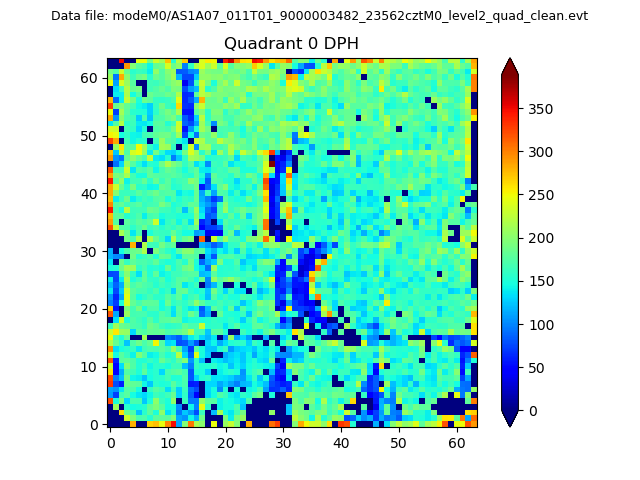 |
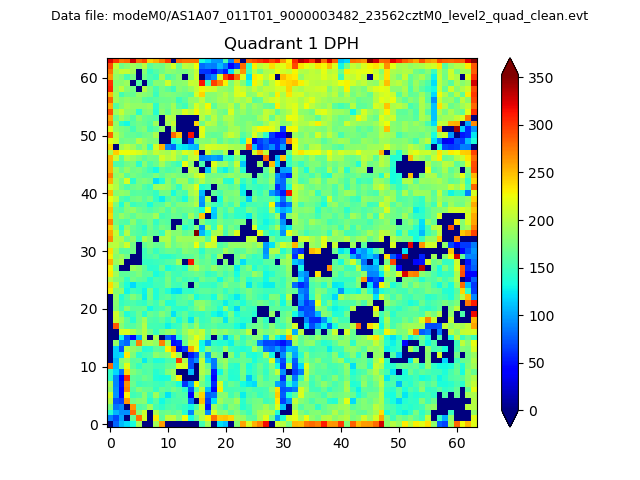 |
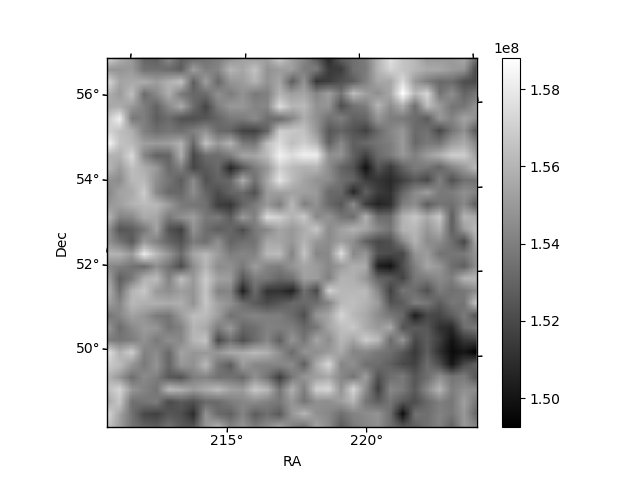
Quadrant B |
|---|---|---|---|
| Quadrant D | 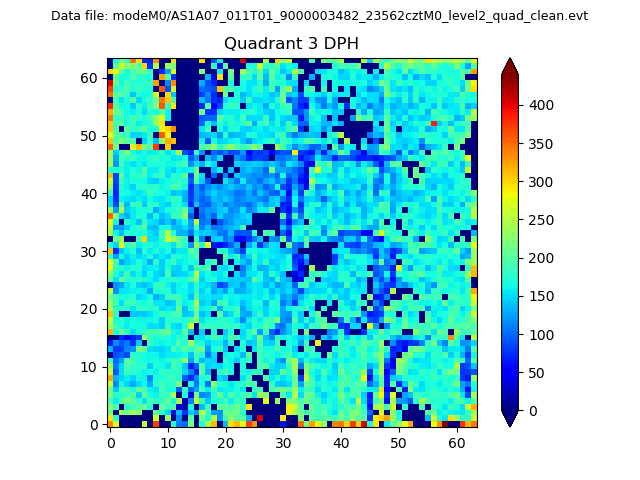 |
 |
Quadrant C |
| Plot type | Count rate plots | Images |
|---|---|---|
| Comparison with Poisson distribution Blue bars denote a histogram of data divided into 1 sec bins. Red curve is a Poisson curve with rate = median count rate of data. |
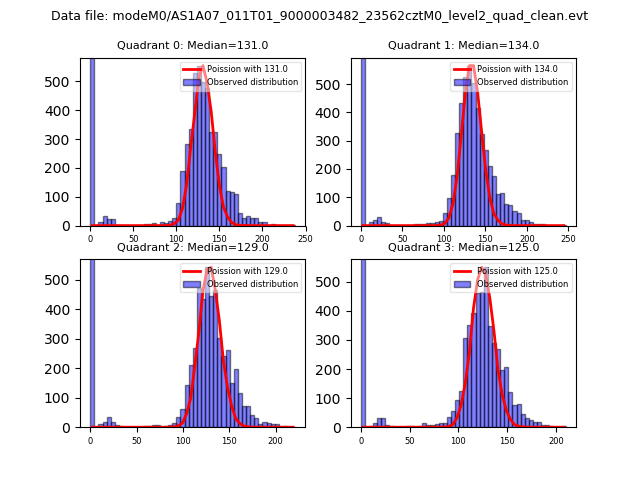 |
 |
| Quadrant-wise count rates Data is divided into 100 sec bins |
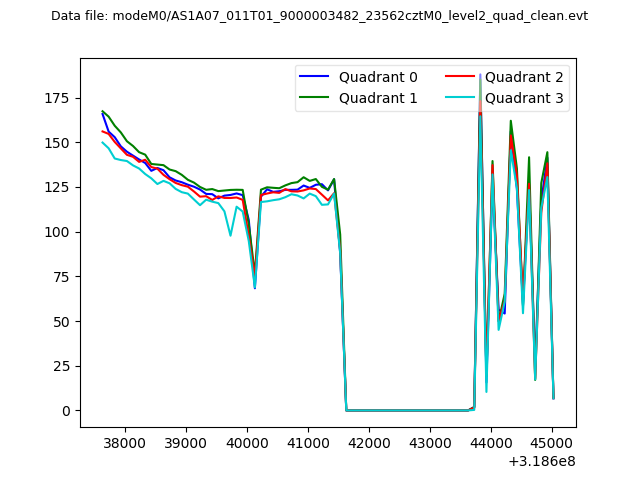 |
|
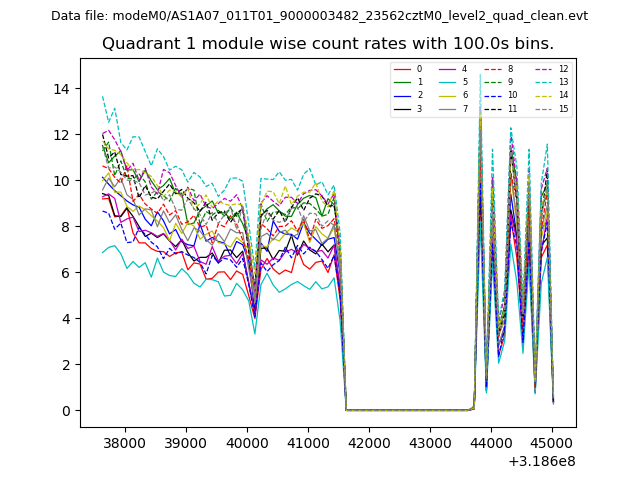
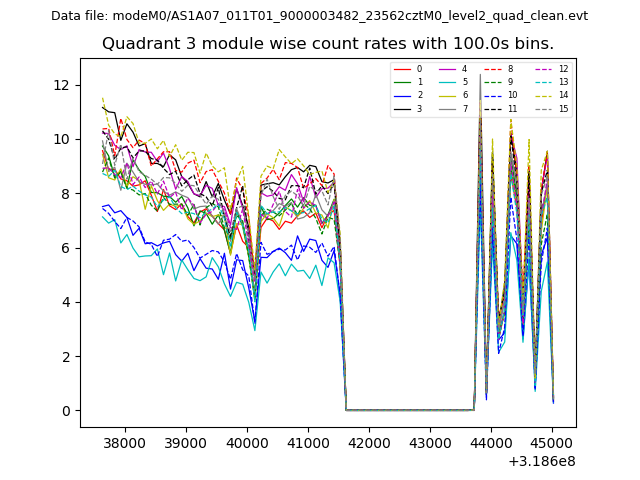
| Module-wise count rates for Quadrant A Data is divided into 100 sec bins |
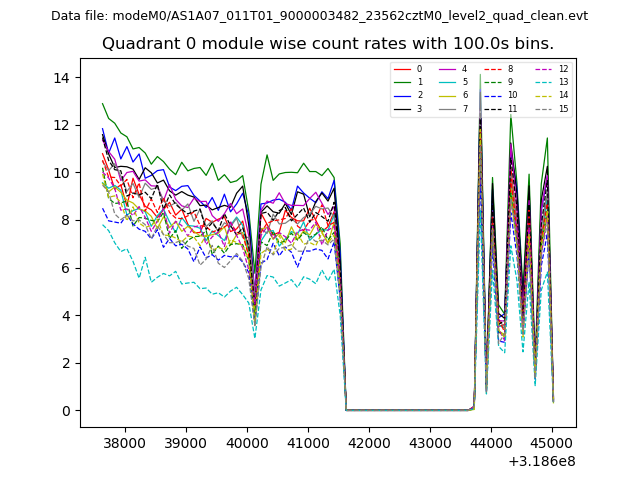 |
 |
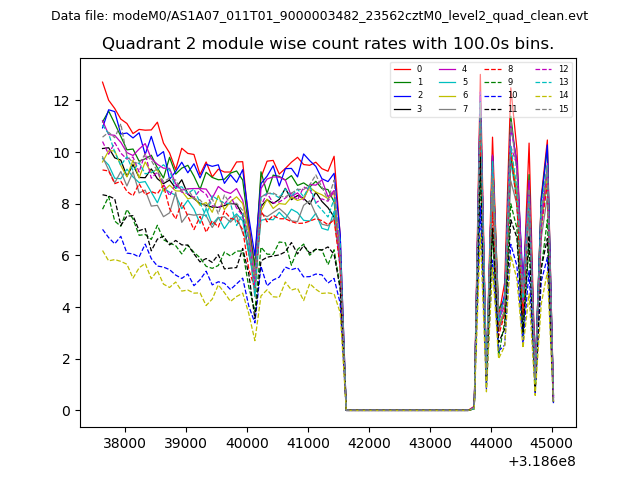
| Module-wise count rates for Quadrant B Data is divided into 100 sec bins |
 |
 |
| Module-wise count rates for Quadrant C Data is divided into 100 sec bins |
 |
 |
| Module-wise count rates for Quadrant D Data is divided into 100 sec bins |
 |
 |
| Parameter | Plot |
|---|---|
| CZT HV Monitor | 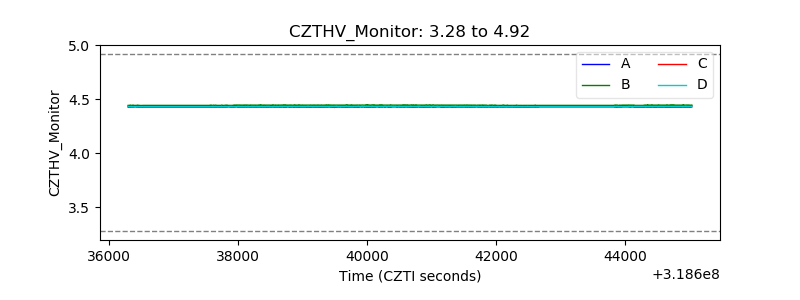 |
| D_VDD | 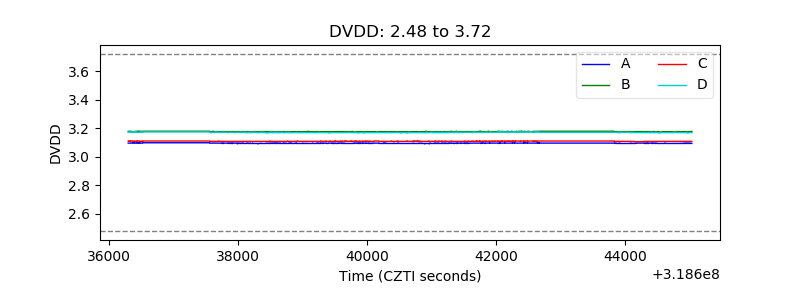 |
| Temperature 1 | 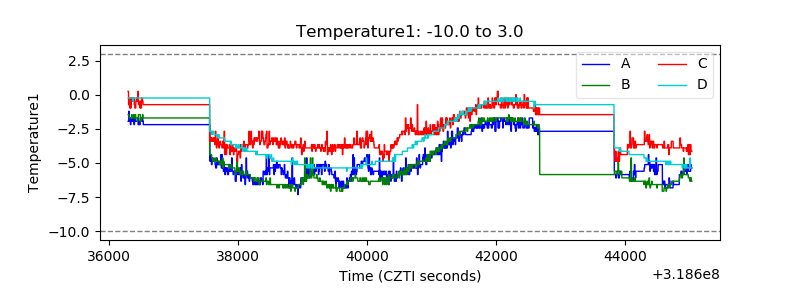 |
| Veto HV Monitor | 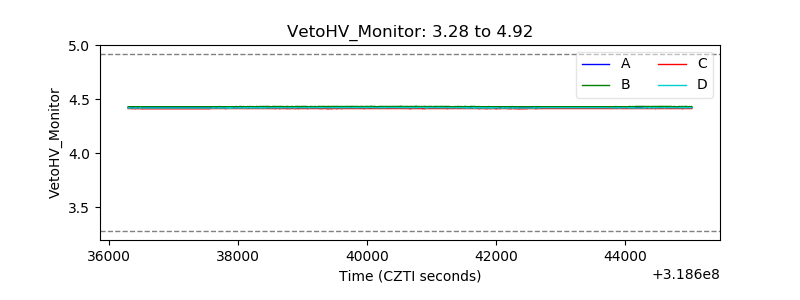 |
| Veto LLD | 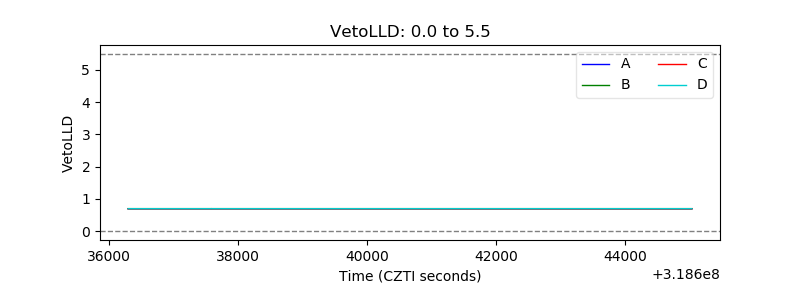 |
| Alpha Counter | 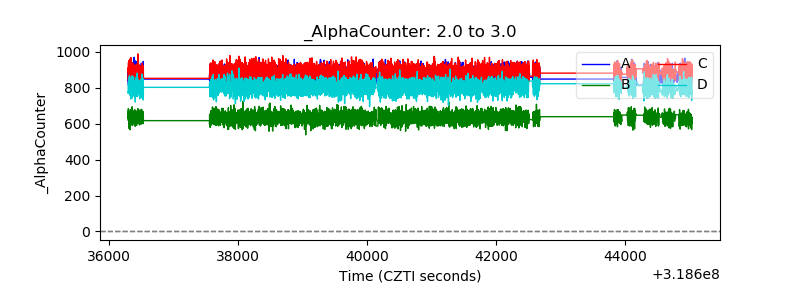 |
| _CPM_Rate | 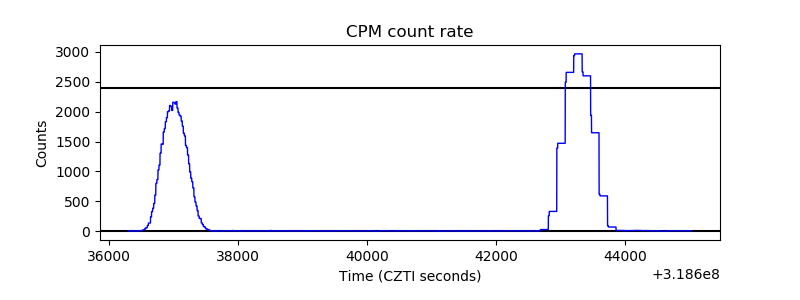 |
| CZT Counter | 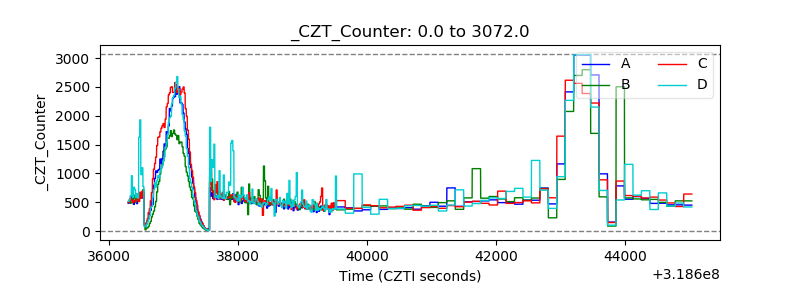 |
| +2.5 Volts monitor |  |
| +5 Volts monitor |  |
| _ROLL_ROT | 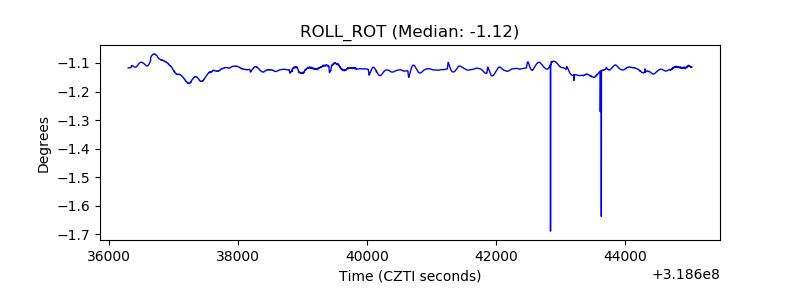 |
| _Roll_DEC | 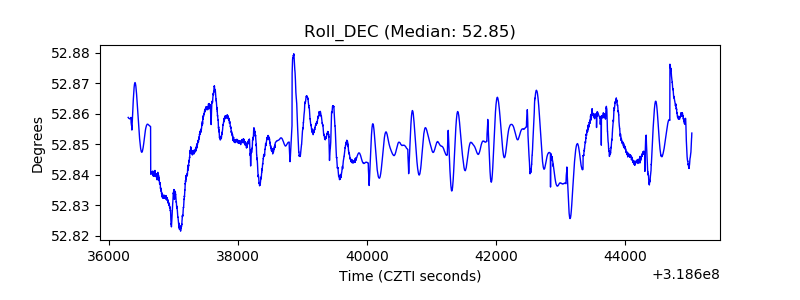 |
| _Roll_RA | 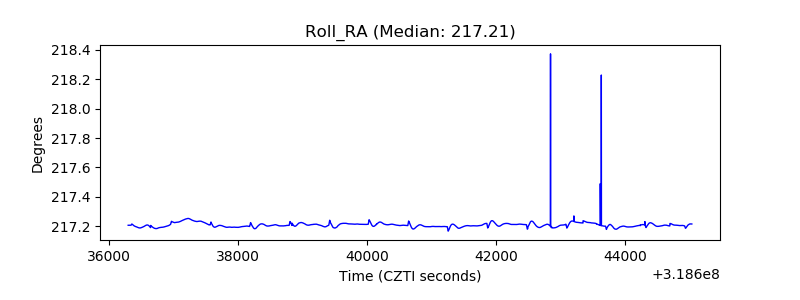 |
| Veto Counter | 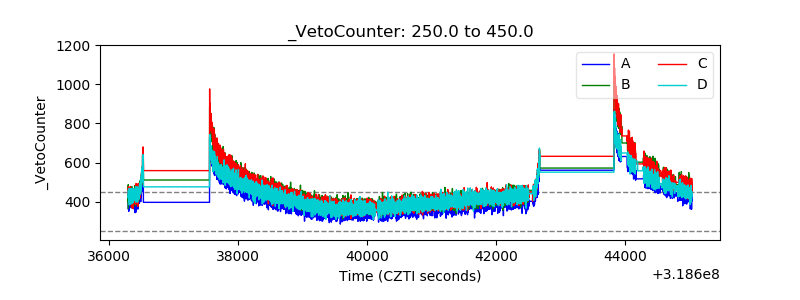 |