| Param | Original file | Final file |
|---|---|---|
| Filename | modeM0/AS1A07_011T01_9000003482_23563cztM0_level2.evt | modeM0/AS1A07_011T01_9000003482_23563cztM0_level2_quad_clean.evt |
| Size (bytes) | 410,690,880 | 100,149,120 |
| Size | 391.7 MB | 95.5 MB |
| Events in quadrant A | 2,895,624 | 659,090 |
| Events in quadrant B | 3,157,662 | 682,810 |
| Events in quadrant C | 2,951,077 | 647,956 |
| Events in quadrant D | 3,025,681 | 624,607 |
| Mode M9 | |||
|---|---|---|---|
| Quadrant | BADHDUFLAG | Total packets | Discarded packets |
| A | 0 | 13 | 0 |
| B | 0 | 13 | 0 |
| C | 0 | 13 | 0 |
| D | 0 | 13 | 0 |
| Mode SS | |||
|---|---|---|---|
| Quadrant | BADHDUFLAG | Total packets | Discarded packets |
| A | 0 | 120 | 0 |
| B | 0 | 120 | 0 |
| C | 0 | 121 | 1 |
| D | 0 | 120 | 0 |
| Mode M0 | |||
|---|---|---|---|
| Quadrant | BADHDUFLAG | Total packets | Discarded packets |
| A | 0 | 12555 | 67 |
| B | 0 | 13322 | 71 |
| C | 0 | 12669 | 69 |
| D | 0 | 13283 | 76 |
| Quadrant | Total seconds | Saturated seconds | Saturation percentage |
|---|---|---|---|
| A | 6001 | 16 | 0.266622% |
| B | 6000 | 71 | 1.183333% |
| C | 6001 | 69 | 1.149808% |
| D | 6000 | 18 | 0.300000% |
Noise dominated data is calculated using 1-second bins in cleaned event files. If a bin has >2000 counts, and if more than 50% of those come from <1% of pixels, then it is considered to be noise-dominated and hence unusable.
| Quadrant | # 1 sec bins | Bins with >0 counts | Bins with >2000 counts | High rate bins dominated by noise | Noise dominated (total time) | Noise dominated (detector-on time) | Marked lightcurve |
|---|---|---|---|---|---|---|---|
| A | 7253 | 6003 | 2 | 2 | 0.03% | 0.03% | 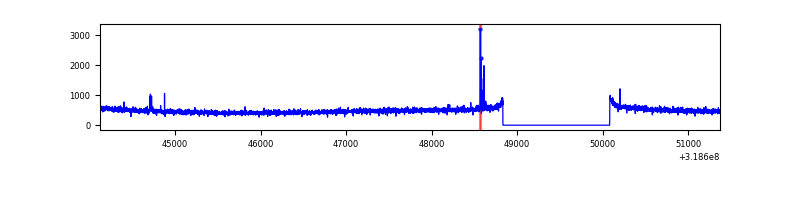 |
| B | 7252 | 6001 | 25 | 25 | 0.34% | 0.42% | 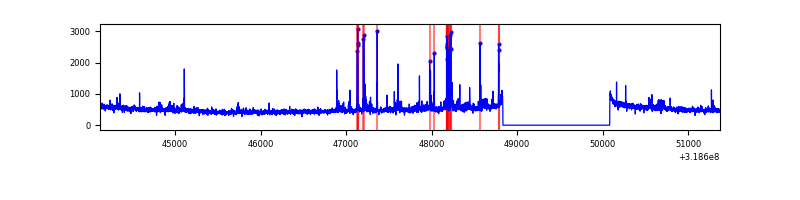 |
| C | 7252 | 6003 | 2 | 2 | 0.03% | 0.03% | 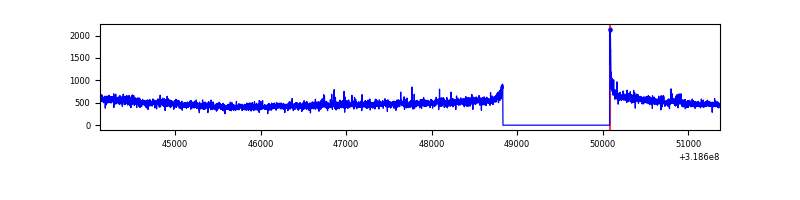 |
| D | 7251 | 6002 | 8 | 8 | 0.11% | 0.13% | 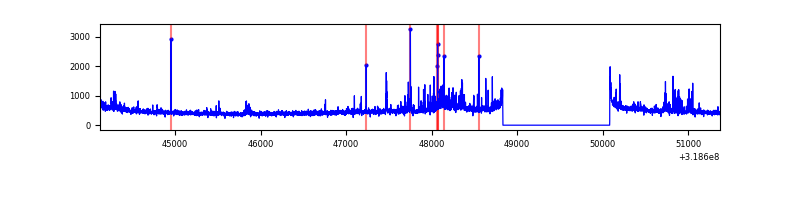 |
Top three noisy pixels from each quadrant. If the there are fewer than three noisy pixels in the level2.evt file, extra rows are filled as -1
| Pixel properties | Quadrant properties | ||||||
|---|---|---|---|---|---|---|---|
| Quadrant | DetID | PixID | Counts | Sigma | Mean | Median | Sigma |
| A | 6 | 16 | 30392 | 201.51 | 743 | 729 | 147.2 |
| A | 13 | 254 | 9317 | 58.34 | 743 | 729 | 147.2 |
| A | 0 | 226 | 6414 | 38.62 | 743 | 729 | 147.2 |
| B | 0 | 189 | 117940 | 839.66 | 746 | 728 | 139.6 |
| B | 3 | 64 | 64632 | 457.78 | 746 | 728 | 139.6 |
| B | 4 | 216 | 50441 | 356.13 | 746 | 728 | 139.6 |
| C | 14 | 238 | 115462 | 702.56 | 715 | 722 | 163.3 |
| C | 0 | 10 | 18860 | 111.06 | 715 | 722 | 163.3 |
| C | 10 | 9 | 15603 | 91.12 | 715 | 722 | 163.3 |
| D | 1 | 52 | 165649 | 955.91 | 714 | 693 | 172.6 |
| D | 12 | 233 | 72866 | 418.24 | 714 | 693 | 172.6 |
| D | 9 | 85 | 67445 | 386.82 | 714 | 693 | 172.6 |
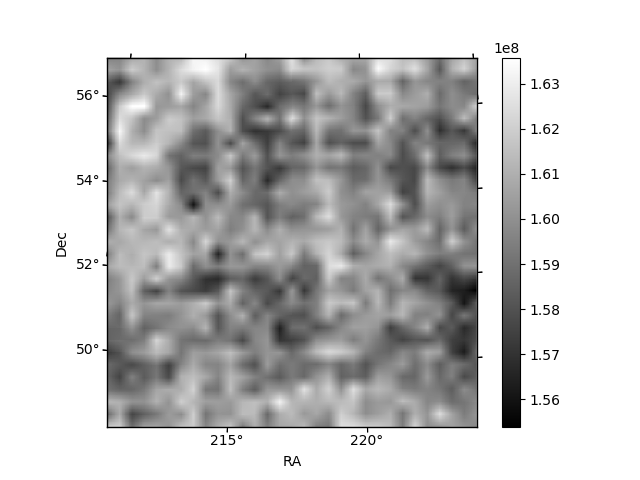
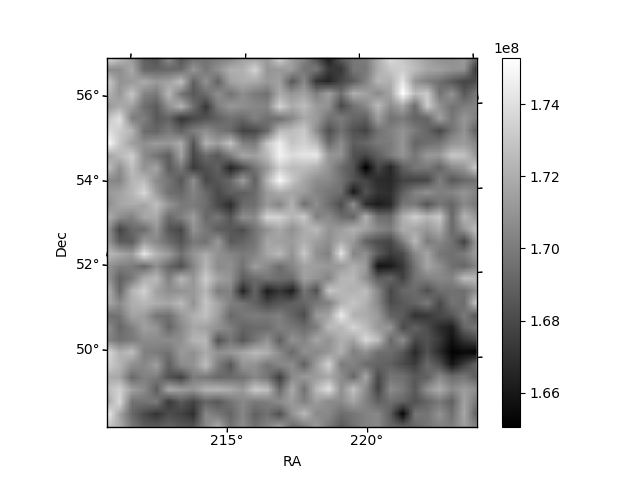
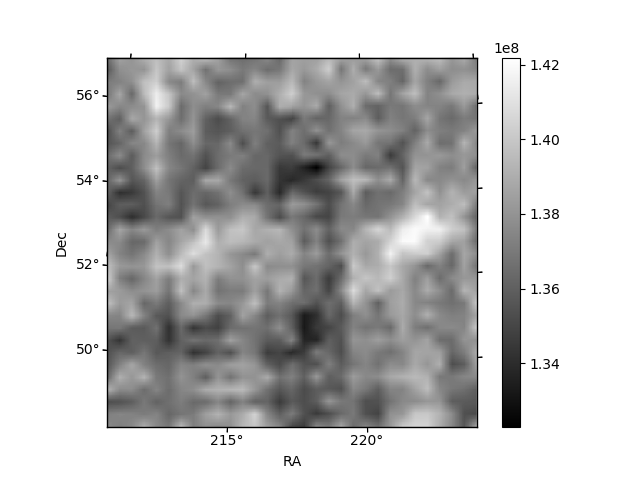
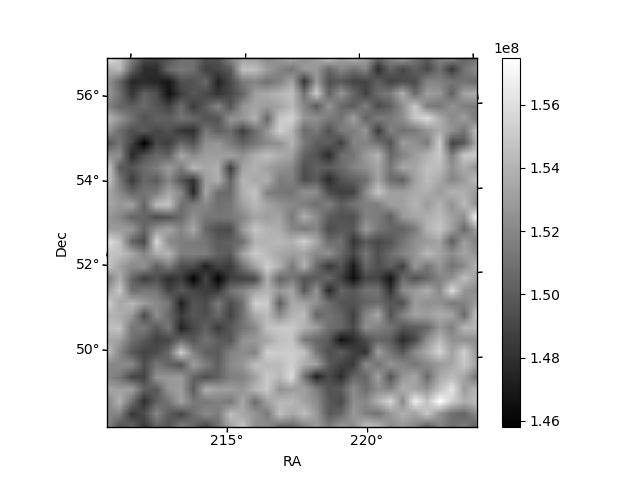
Histogram calculated using DETX and DETY for each event in the final _common_clean file
| Quadrant A | 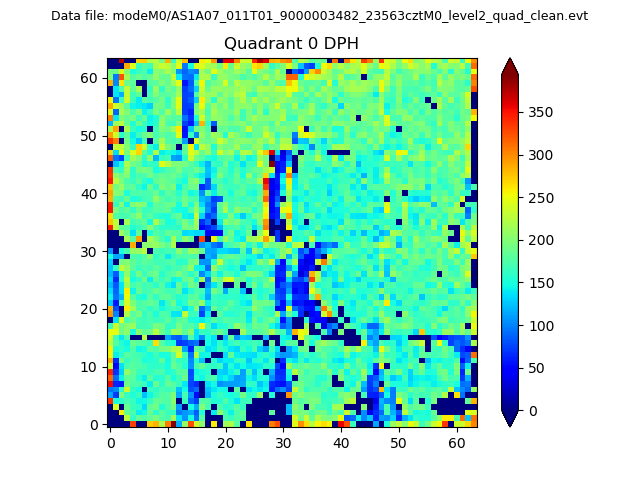 |
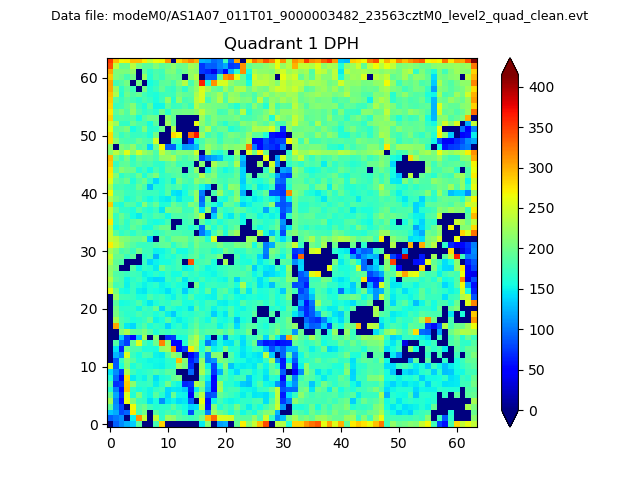 |
Quadrant B |
|---|---|---|---|
| Quadrant D |  |
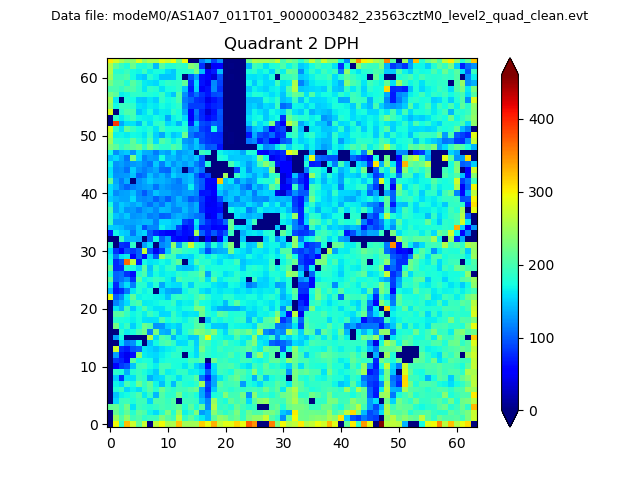 |
Quadrant C |
| Plot type | Count rate plots | Images |
|---|---|---|
| Comparison with Poisson distribution Blue bars denote a histogram of data divided into 1 sec bins. Red curve is a Poisson curve with rate = median count rate of data. |
 |
 |
| Quadrant-wise count rates Data is divided into 100 sec bins |
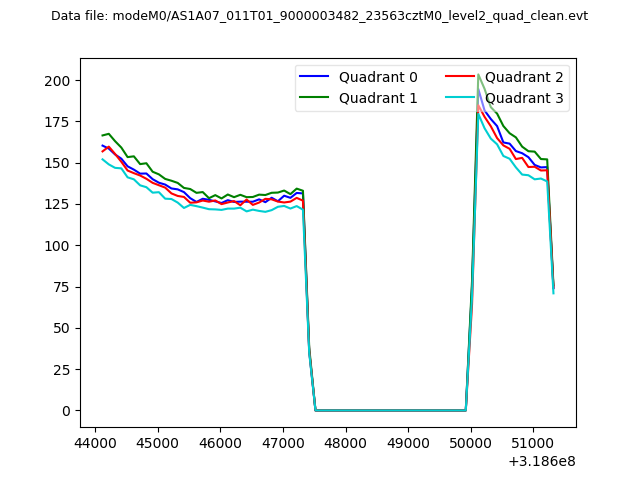 |
|
| Module-wise count rates for Quadrant A Data is divided into 100 sec bins |
 |
 |
| Module-wise count rates for Quadrant B Data is divided into 100 sec bins |
 |
 |
| Module-wise count rates for Quadrant C Data is divided into 100 sec bins |
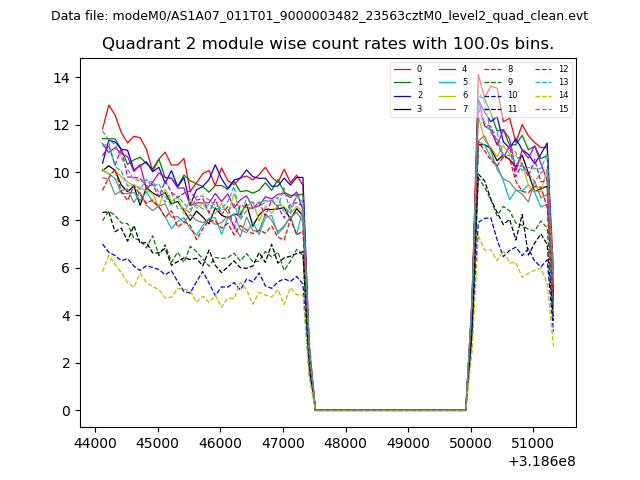 |
 |
| Module-wise count rates for Quadrant D Data is divided into 100 sec bins |
 |
 |
| Parameter | Plot |
|---|---|
| CZT HV Monitor | 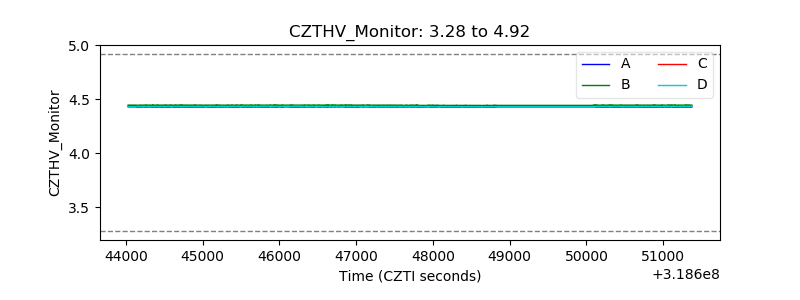 |
| D_VDD | 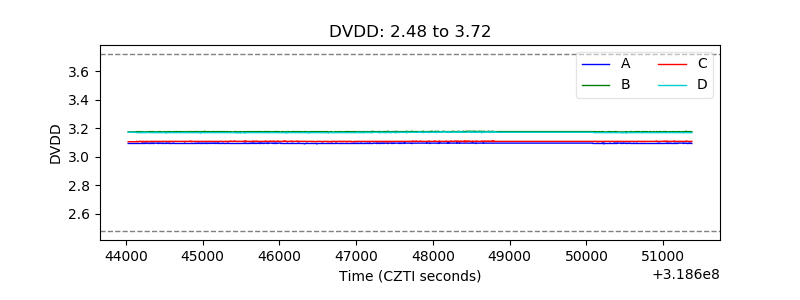 |
| Temperature 1 | 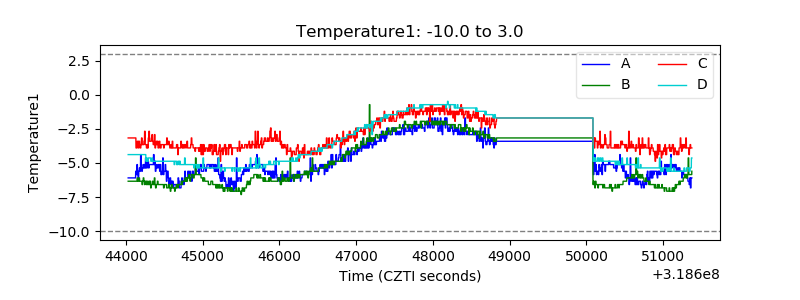 |
| Veto HV Monitor |  |
| Veto LLD | 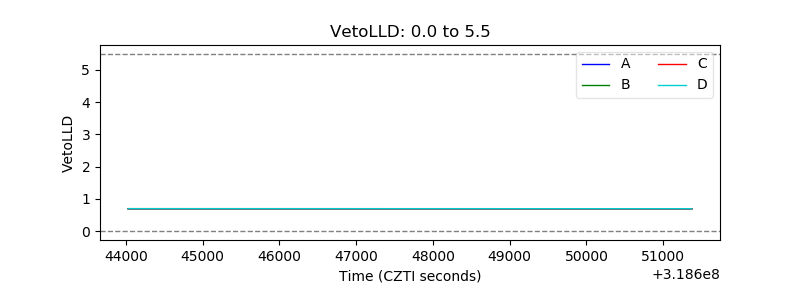 |
| Alpha Counter | 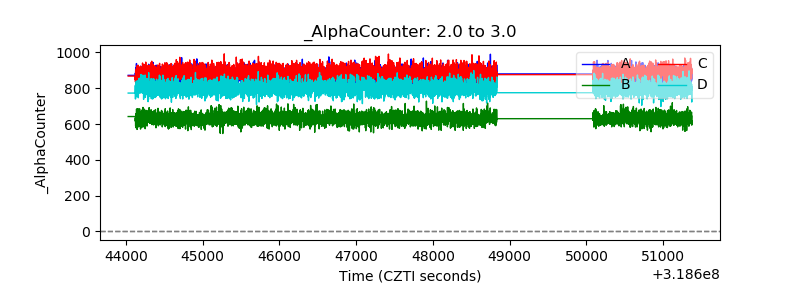 |
| _CPM_Rate | 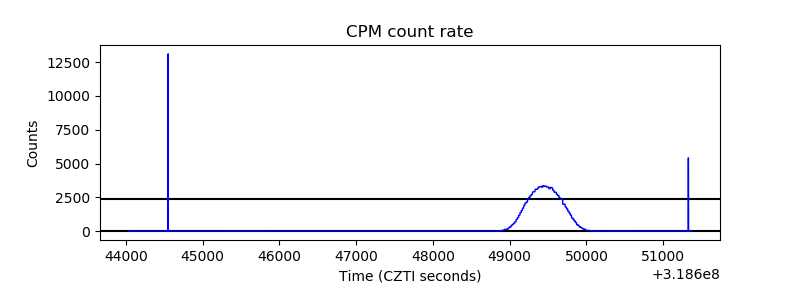 |
| CZT Counter | 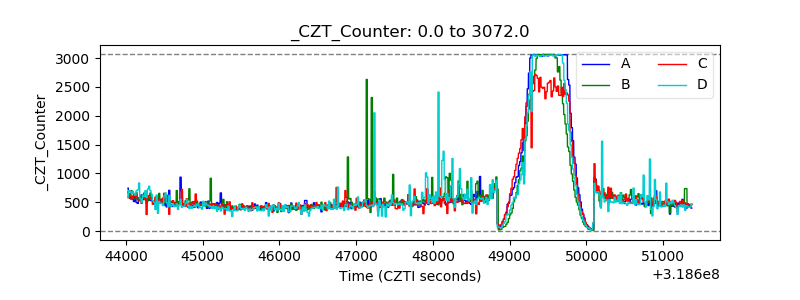 |
| +2.5 Volts monitor |  |
| +5 Volts monitor |  |
| _ROLL_ROT | 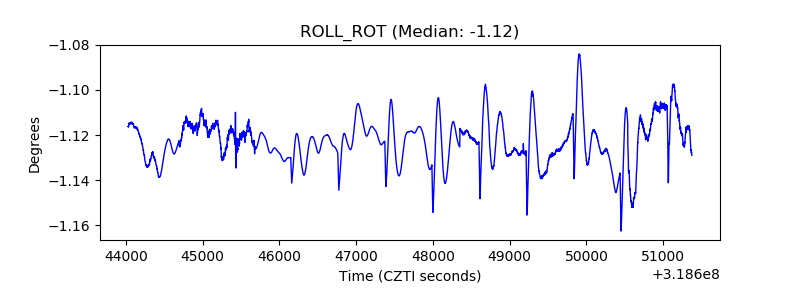 |
| _Roll_DEC | 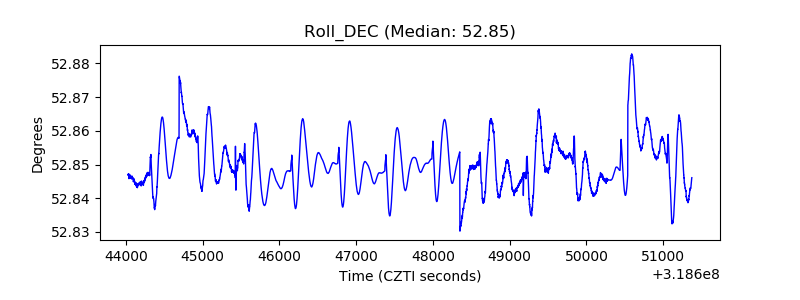 |
| _Roll_RA | 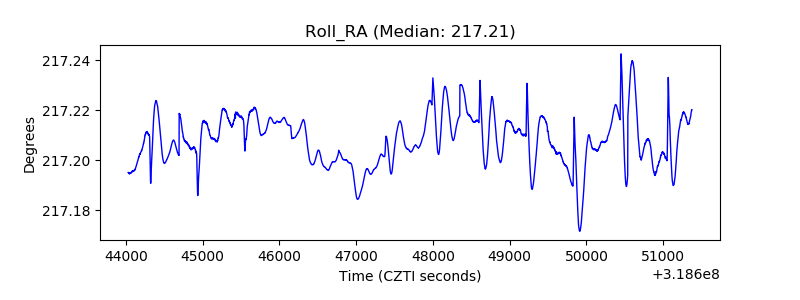 |
| Veto Counter | 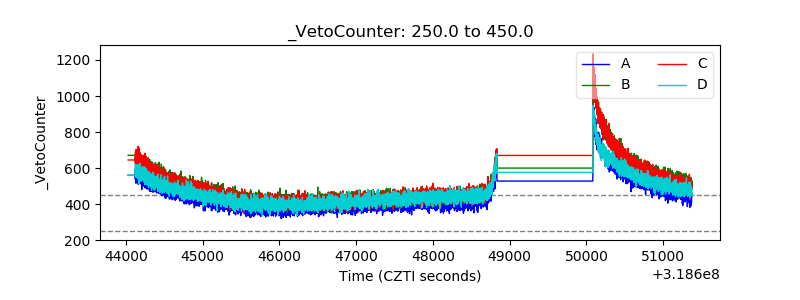 |