| Param | Original file | Final file |
|---|---|---|
| Filename | modeM0/AS1A07_011T01_9000003482_23564cztM0_level2.evt | modeM0/AS1A07_011T01_9000003482_23564cztM0_level2_quad_clean.evt |
| Size (bytes) | 1,898,043,840 | 414,734,400 |
| Size | 1.8 GB | 395.5 MB |
| Events in quadrant A | 12,602,713 | 2,716,535 |
| Events in quadrant B | 13,698,911 | 2,782,692 |
| Events in quadrant C | 14,145,109 | 2,642,320 |
| Events in quadrant D | 15,225,991 | 2,578,701 |
| Mode M9 | |||
|---|---|---|---|
| Quadrant | BADHDUFLAG | Total packets | Discarded packets |
| A | 0 | 57 | 0 |
| B | 0 | 57 | 0 |
| C | 0 | 57 | 0 |
| D | 0 | 57 | 0 |
| Mode SS | |||
|---|---|---|---|
| Quadrant | BADHDUFLAG | Total packets | Discarded packets |
| A | 0 | 544 | 0 |
| B | 0 | 544 | 0 |
| C | 0 | 544 | 0 |
| D | 0 | 544 | 0 |
| Mode M0 | |||
|---|---|---|---|
| Quadrant | BADHDUFLAG | Total packets | Discarded packets |
| A | 0 | 55267 | 3 |
| B | 0 | 58443 | 3 |
| C | 0 | 59573 | 3 |
| D | 0 | 63895 | 3 |
| Quadrant | Total seconds | Saturated seconds | Saturation percentage |
|---|---|---|---|
| A | 26799 | 116 | 0.432852% |
| B | 26800 | 340 | 1.268657% |
| C | 26800 | 739 | 2.757463% |
| D | 26800 | 674 | 2.514925% |
Noise dominated data is calculated using 1-second bins in cleaned event files. If a bin has >2000 counts, and if more than 50% of those come from <1% of pixels, then it is considered to be noise-dominated and hence unusable.
| Quadrant | # 1 sec bins | Bins with >0 counts | Bins with >2000 counts | High rate bins dominated by noise | Noise dominated (total time) | Noise dominated (detector-on time) | Marked lightcurve |
|---|---|---|---|---|---|---|---|
| A | 32414 | 26803 | 2 | 2 | 0.01% | 0.01% |  |
| B | 32415 | 26801 | 93 | 93 | 0.29% | 0.35% | 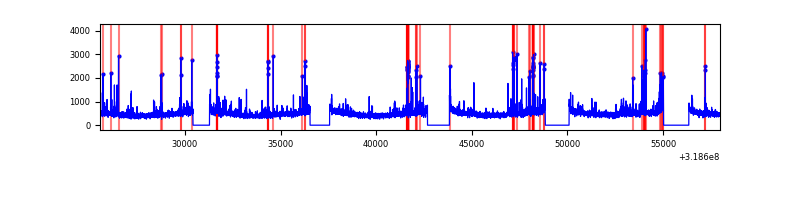 |
| C | 32415 | 26803 | 376 | 376 | 1.16% | 1.40% | 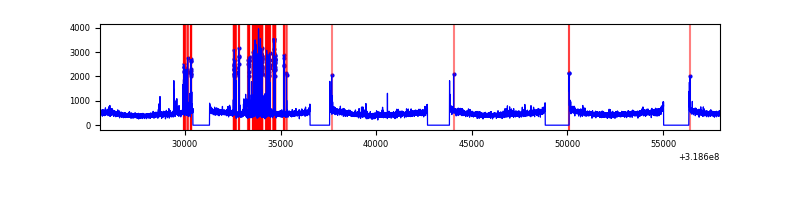 |
| D | 32415 | 26802 | 564 | 564 | 1.74% | 2.10% | 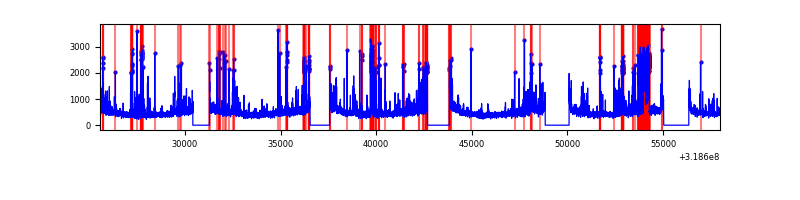 |
Top three noisy pixels from each quadrant. If the there are fewer than three noisy pixels in the level2.evt file, extra rows are filled as -1
| Pixel properties | Quadrant properties | ||||||
|---|---|---|---|---|---|---|---|
| Quadrant | DetID | PixID | Counts | Sigma | Mean | Median | Sigma |
| A | 6 | 16 | 65054 | 95.94 | 3248 | 3188 | 644.9 |
| A | 13 | 254 | 43558 | 62.6 | 3248 | 3188 | 644.9 |
| A | 3 | 137 | 28189 | 38.77 | 3248 | 3188 | 644.9 |
| B | 0 | 189 | 490203 | 804.66 | 3235 | 3156 | 605.3 |
| B | 3 | 64 | 146466 | 236.76 | 3235 | 3156 | 605.3 |
| B | 4 | 216 | 118560 | 190.66 | 3235 | 3156 | 605.3 |
| C | 10 | 9 | 1426249 | 2012.91 | 3092 | 3116 | 707.0 |
| C | 14 | 238 | 497571 | 699.37 | 3092 | 3116 | 707.0 |
| C | 0 | 10 | 63113 | 84.86 | 3092 | 3116 | 707.0 |
| D | 1 | 52 | 1915135 | 2555.32 | 3107 | 3020 | 748.3 |
| D | 12 | 233 | 1018635 | 1357.25 | 3107 | 3020 | 748.3 |
| D | 7 | 238 | 206445 | 271.85 | 3107 | 3020 | 748.3 |
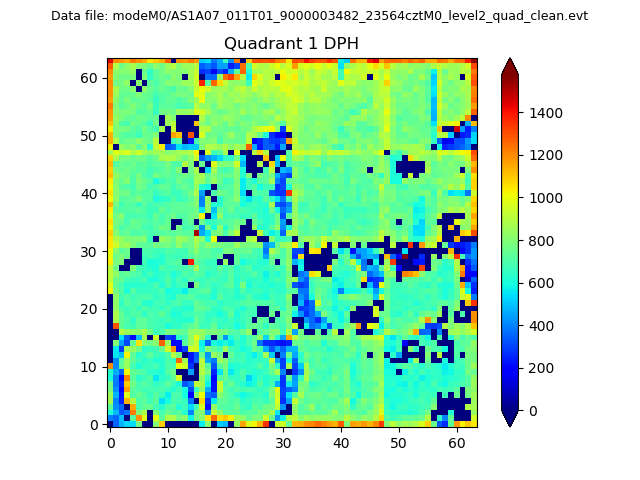
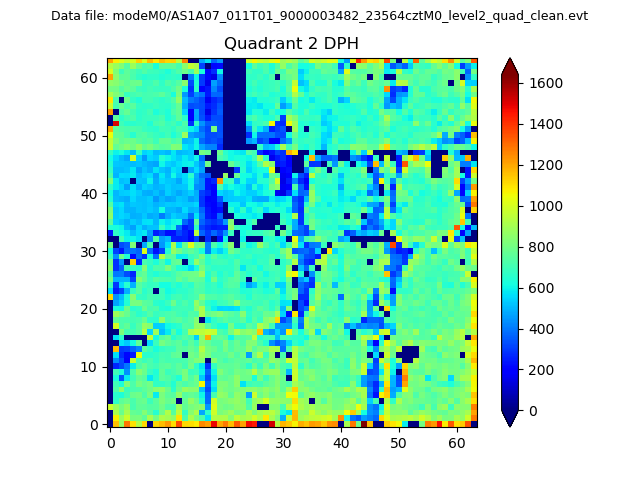
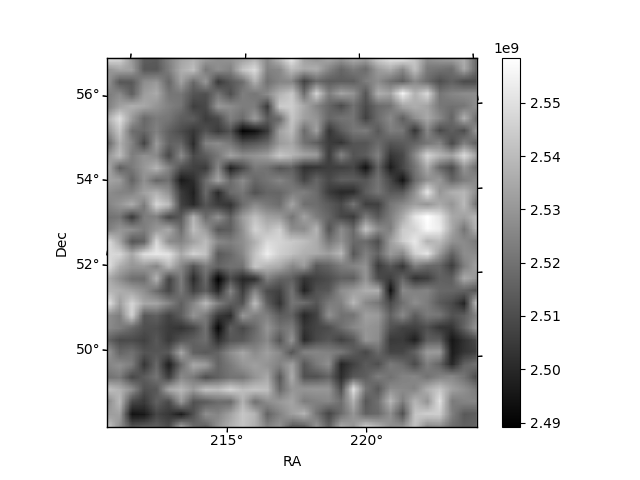
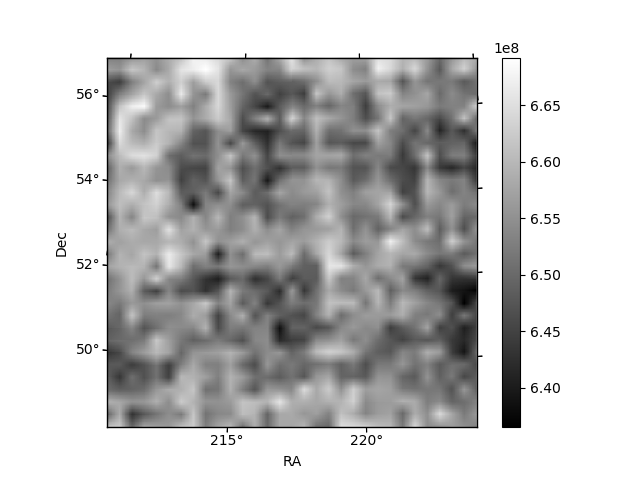
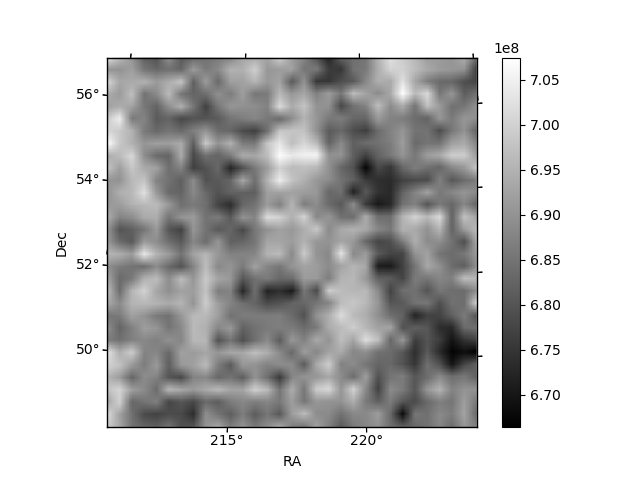
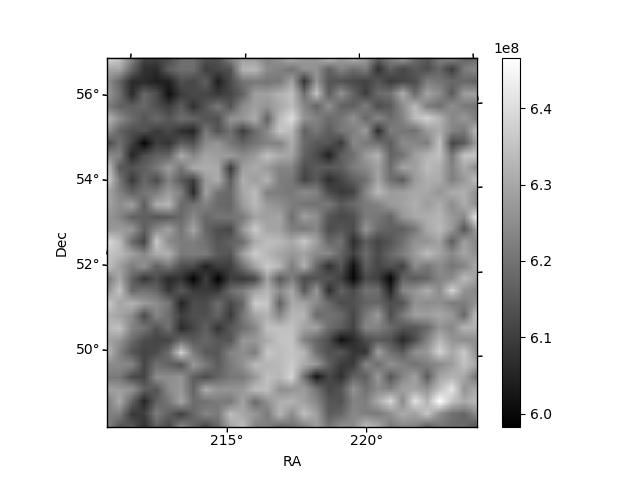
Histogram calculated using DETX and DETY for each event in the final _common_clean file
| Quadrant A | 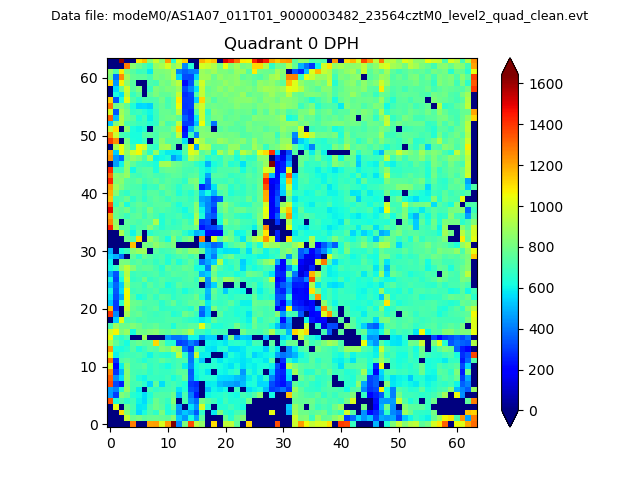 |
 |
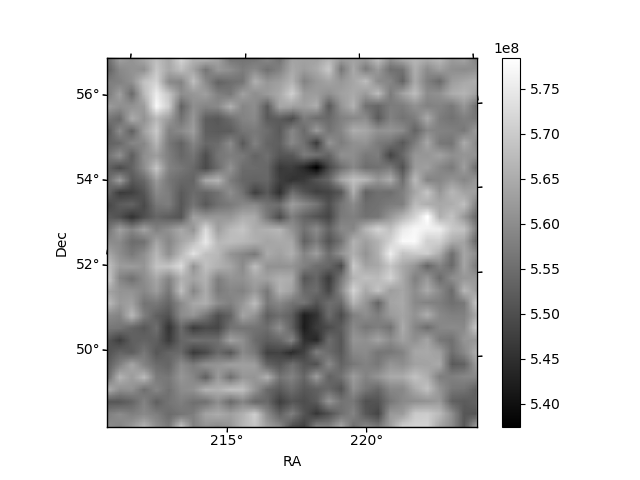
Quadrant B |
|---|---|---|---|
| Quadrant D | 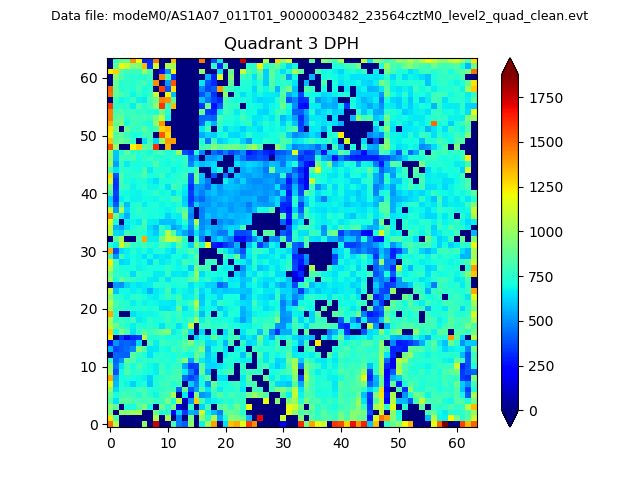 |
 |
Quadrant C |
| Plot type | Count rate plots | Images |
|---|---|---|
| Comparison with Poisson distribution Blue bars denote a histogram of data divided into 1 sec bins. Red curve is a Poisson curve with rate = median count rate of data. |
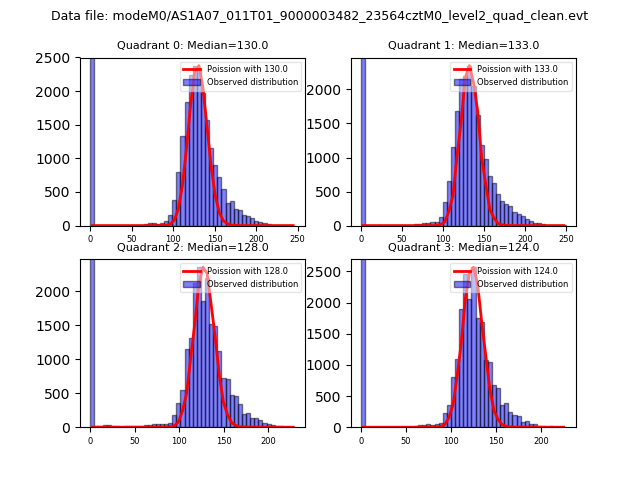 |
 |
| Quadrant-wise count rates Data is divided into 100 sec bins |
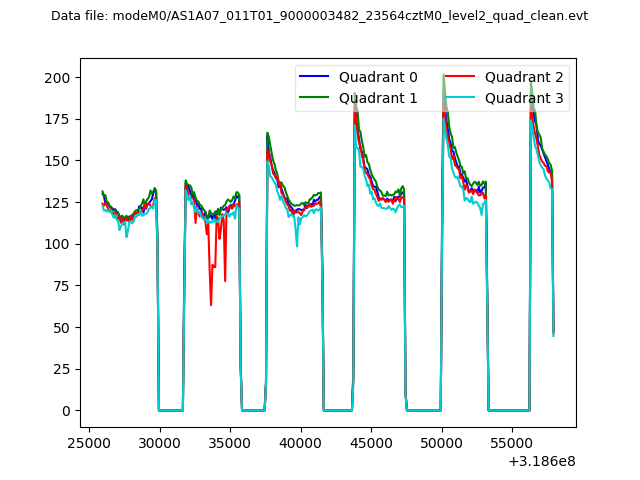 |
|
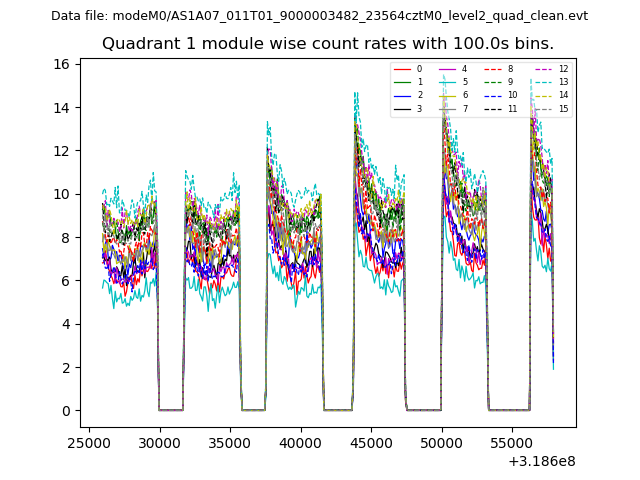
| Module-wise count rates for Quadrant A Data is divided into 100 sec bins |
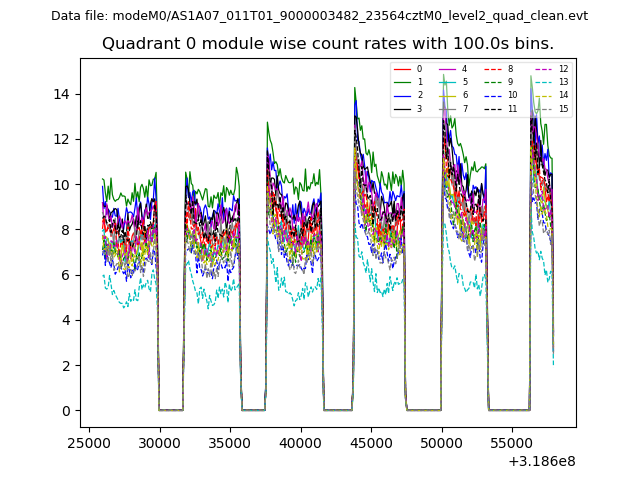 |
 |
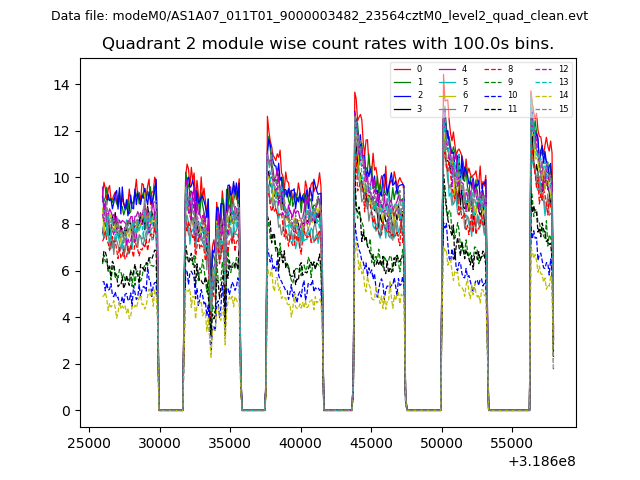
| Module-wise count rates for Quadrant B Data is divided into 100 sec bins |
 |
 |
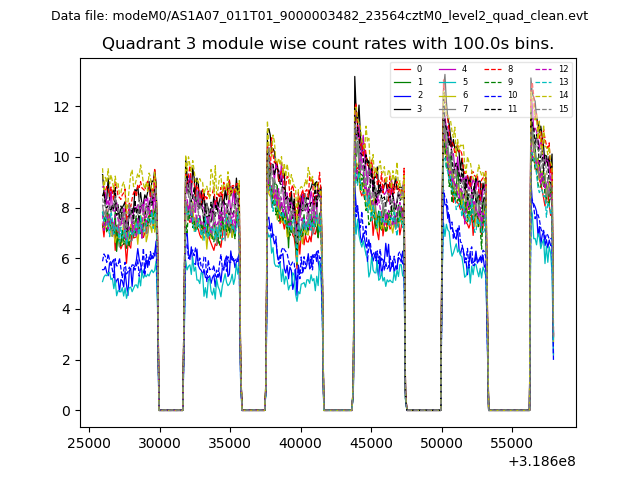
| Module-wise count rates for Quadrant C Data is divided into 100 sec bins |
 |
 |
| Module-wise count rates for Quadrant D Data is divided into 100 sec bins |
 |
 |
| Parameter | Plot |
|---|---|
| CZT HV Monitor |  |
| D_VDD | 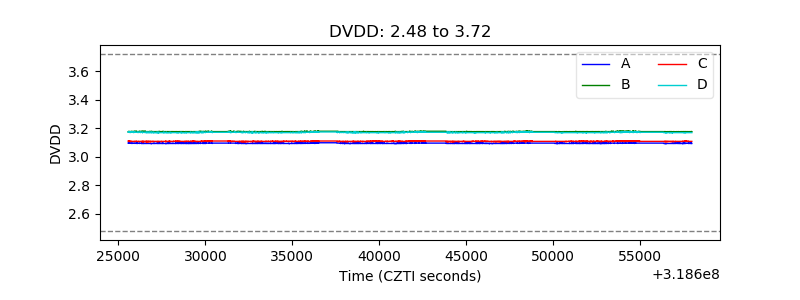 |
| Temperature 1 | 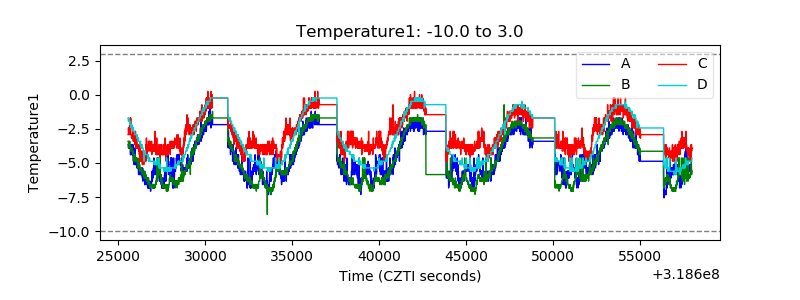 |
| Veto HV Monitor | 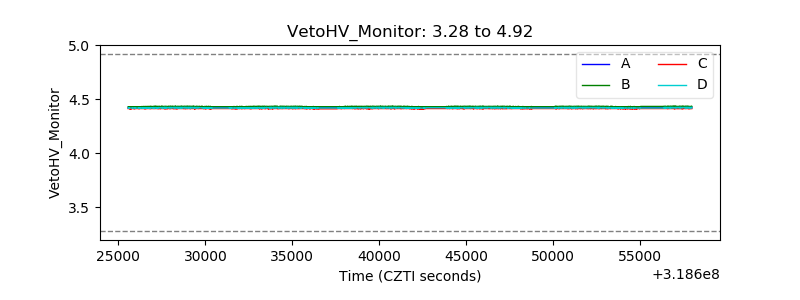 |
| Veto LLD | 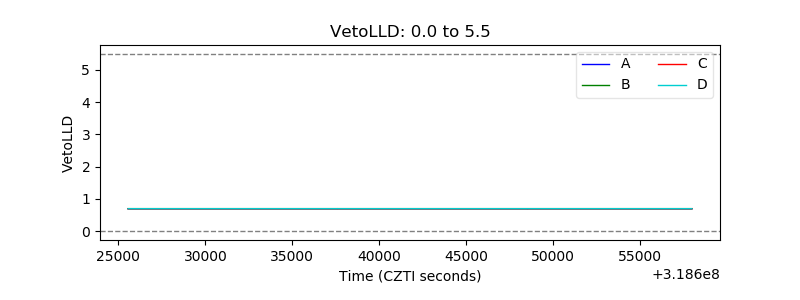 |
| Alpha Counter | 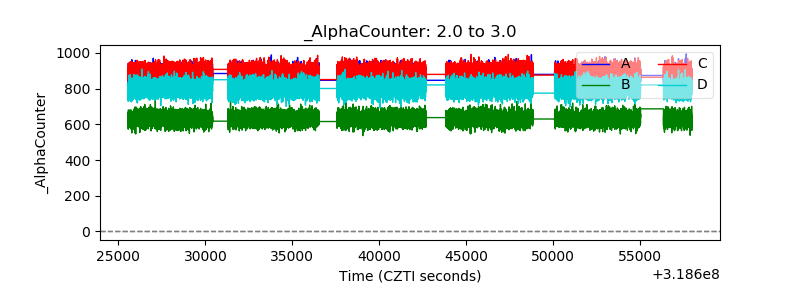 |
| _CPM_Rate |  |
| CZT Counter | 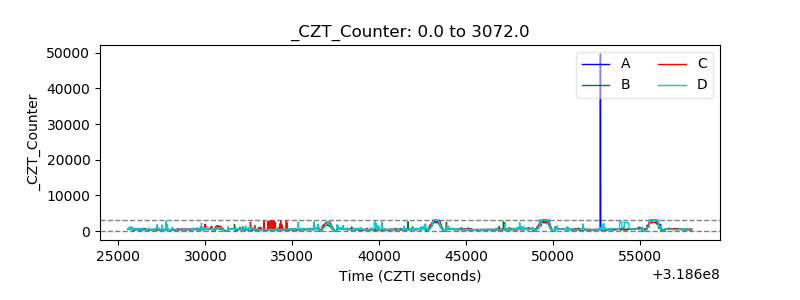 |
| +2.5 Volts monitor | 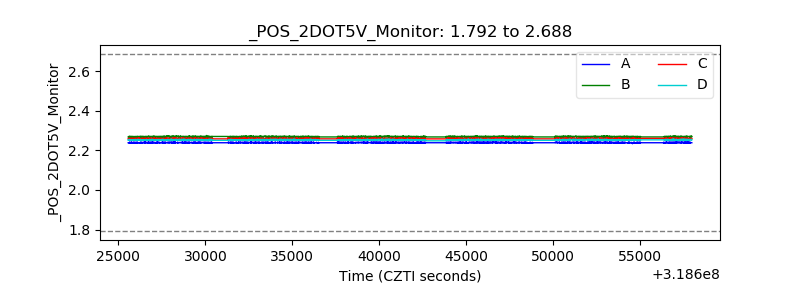 |
| +5 Volts monitor |  |
| _ROLL_ROT | 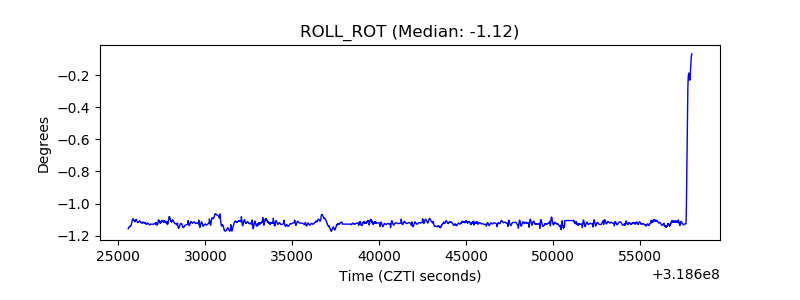 |
| _Roll_DEC | 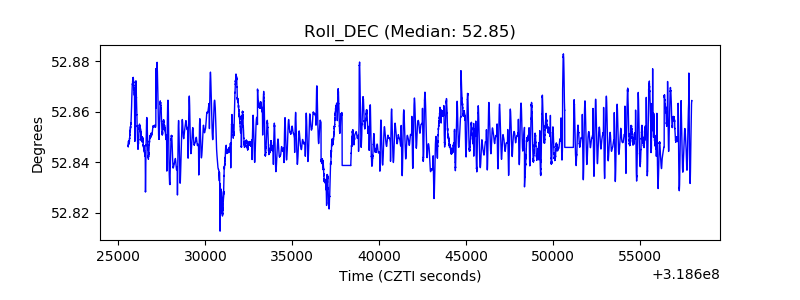 |
| _Roll_RA | 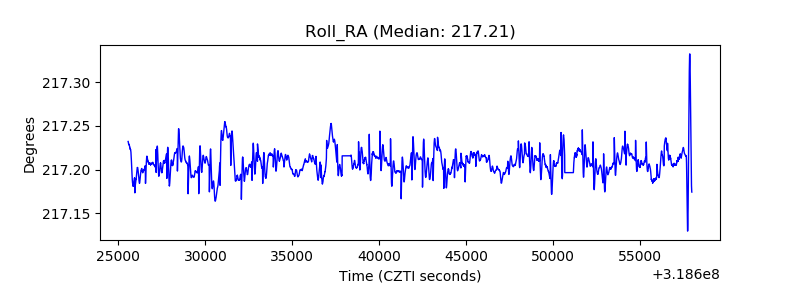 |
| Veto Counter | 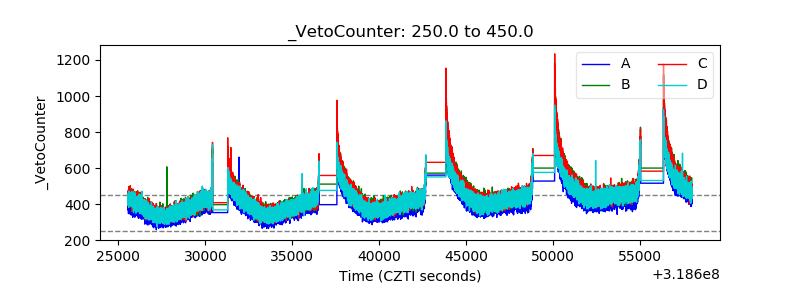 |