| Param | Original file | Final file |
|---|---|---|
| Filename | modeM0/AS1A07_011T01_9000003482_23567cztM0_level2.evt | modeM0/AS1A07_011T01_9000003482_23567cztM0_level2_quad_clean.evt |
| Size (bytes) | 444,476,160 | 92,232,000 |
| Size | 423.9 MB | 88.0 MB |
| Events in quadrant A | 2,979,307 | 597,967 |
| Events in quadrant B | 3,371,061 | 607,582 |
| Events in quadrant C | 3,042,814 | 580,545 |
| Events in quadrant D | 3,640,683 | 568,380 |
| Mode M9 | |||
|---|---|---|---|
| Quadrant | BADHDUFLAG | Total packets | Discarded packets |
| A | 0 | 10 | 0 |
| B | 0 | 10 | 0 |
| C | 0 | 10 | 0 |
| D | 0 | 10 | 0 |
| Mode SS | |||
|---|---|---|---|
| Quadrant | BADHDUFLAG | Total packets | Discarded packets |
| A | 0 | 128 | 0 |
| B | 0 | 128 | 0 |
| C | 0 | 128 | 0 |
| D | 0 | 128 | 0 |
| Mode M0 | |||
|---|---|---|---|
| Quadrant | BADHDUFLAG | Total packets | Discarded packets |
| A | 0 | 12774 | 1 |
| B | 0 | 13844 | 1 |
| C | 0 | 12977 | 1 |
| D | 0 | 15156 | 1 |
| Quadrant | Total seconds | Saturated seconds | Saturation percentage |
|---|---|---|---|
| A | 6284 | 47 | 0.747931% |
| B | 6285 | 112 | 1.782021% |
| C | 6285 | 63 | 1.002387% |
| D | 6285 | 68 | 1.081941% |
Noise dominated data is calculated using 1-second bins in cleaned event files. If a bin has >2000 counts, and if more than 50% of those come from <1% of pixels, then it is considered to be noise-dominated and hence unusable.
| Quadrant | # 1 sec bins | Bins with >0 counts | Bins with >2000 counts | High rate bins dominated by noise | Noise dominated (total time) | Noise dominated (detector-on time) | Marked lightcurve |
|---|---|---|---|---|---|---|---|
| A | 7289 | 6284 | 0 | 0 | 0.00% | 0.00% | 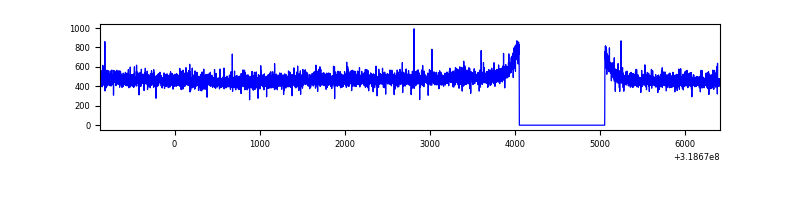 |
| B | 7290 | 6286 | 49 | 49 | 0.67% | 0.78% | 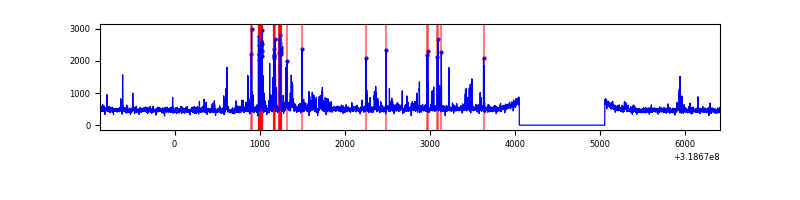 |
| C | 7290 | 6286 | 0 | 0 | 0.00% | 0.00% | 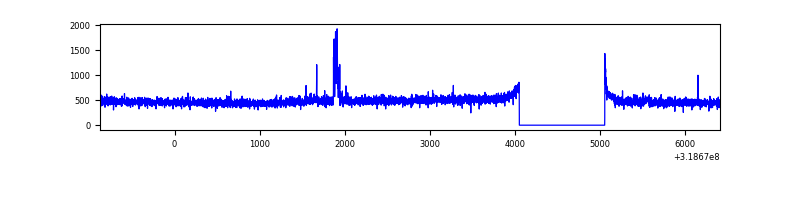 |
| D | 7290 | 6286 | 31 | 31 | 0.43% | 0.49% | 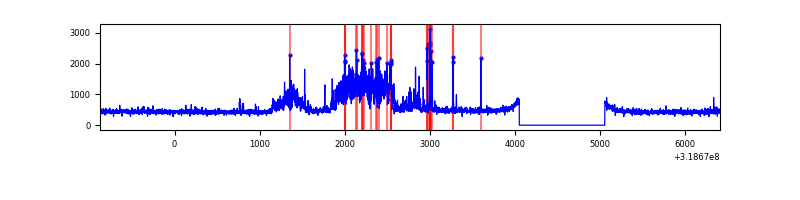 |
Top three noisy pixels from each quadrant. If the there are fewer than three noisy pixels in the level2.evt file, extra rows are filled as -1
| Pixel properties | Quadrant properties | ||||||
|---|---|---|---|---|---|---|---|
| Quadrant | DetID | PixID | Counts | Sigma | Mean | Median | Sigma |
| A | 13 | 254 | 10797 | 64.96 | 772 | 757 | 154.6 |
| A | 0 | 226 | 6719 | 38.58 | 772 | 757 | 154.6 |
| A | 3 | 137 | 6463 | 36.92 | 772 | 757 | 154.6 |
| B | 0 | 189 | 255880 | 1769.92 | 760 | 740 | 144.2 |
| B | 0 | 230 | 34381 | 233.37 | 760 | 740 | 144.2 |
| B | 15 | 33 | 33237 | 225.43 | 760 | 740 | 144.2 |
| C | 14 | 238 | 118107 | 696.54 | 727 | 732 | 168.5 |
| C | 0 | 239 | 51772 | 302.89 | 727 | 732 | 168.5 |
| C | 3 | 233 | 16360 | 92.74 | 727 | 732 | 168.5 |
| D | 9 | 85 | 587134 | 3239.28 | 743 | 722 | 181.0 |
| D | 7 | 38 | 125292 | 688.11 | 743 | 722 | 181.0 |
| D | 12 | 233 | 43655 | 237.16 | 743 | 722 | 181.0 |
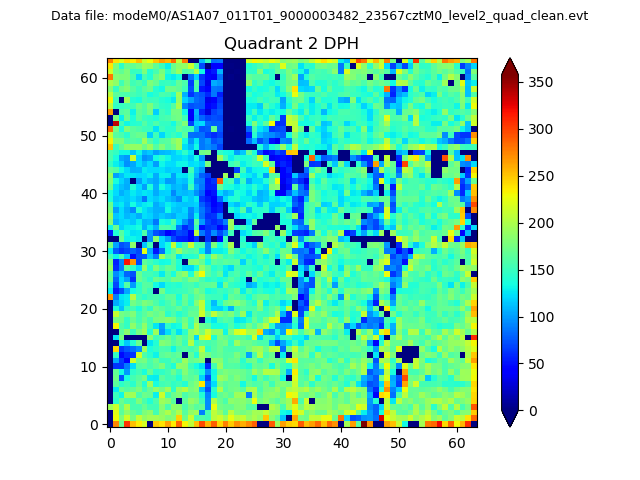
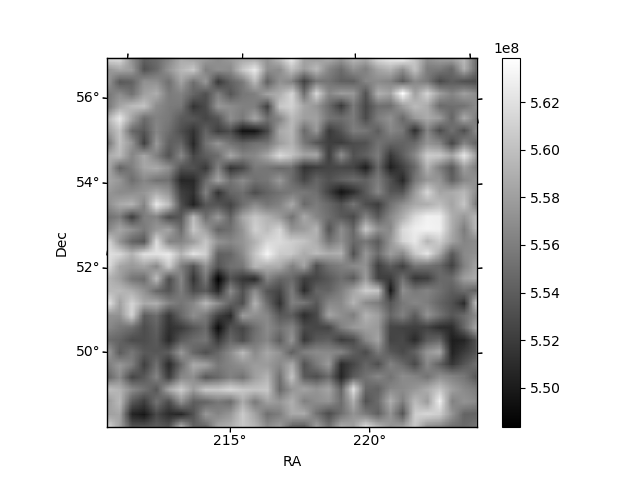
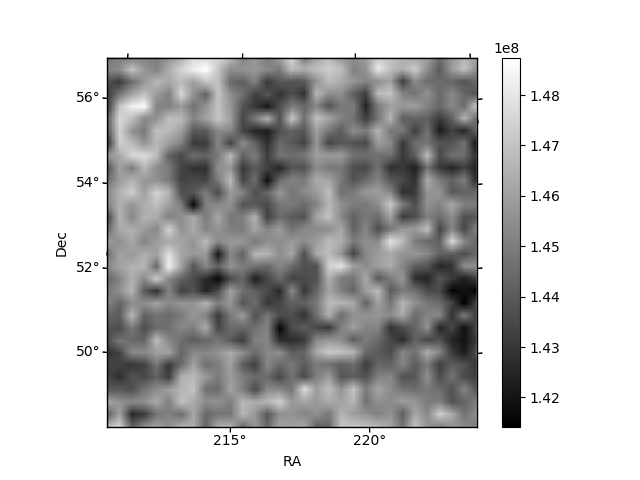
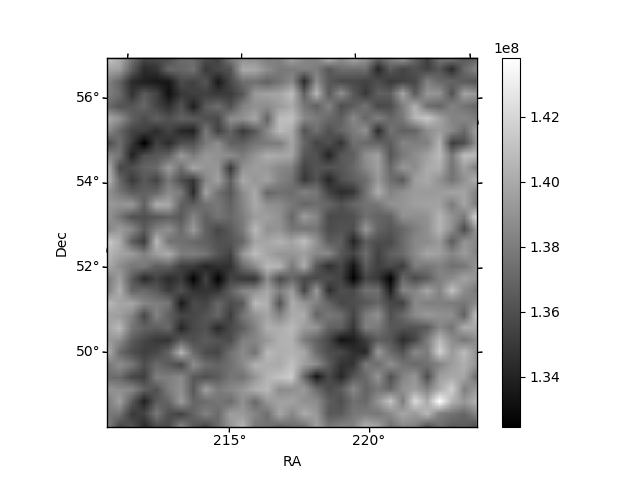
Histogram calculated using DETX and DETY for each event in the final _common_clean file
| Quadrant A | 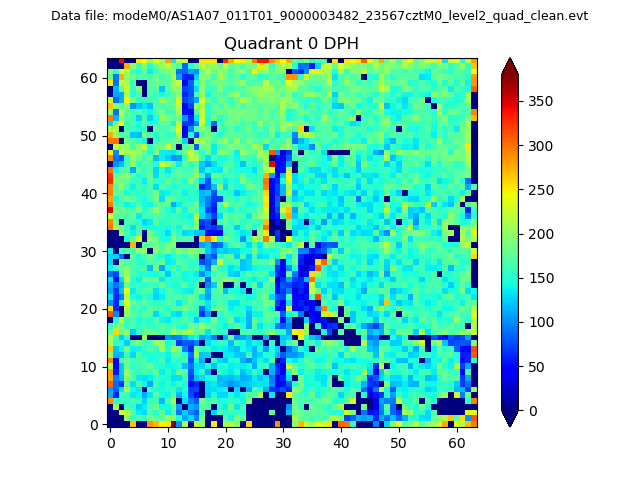 |
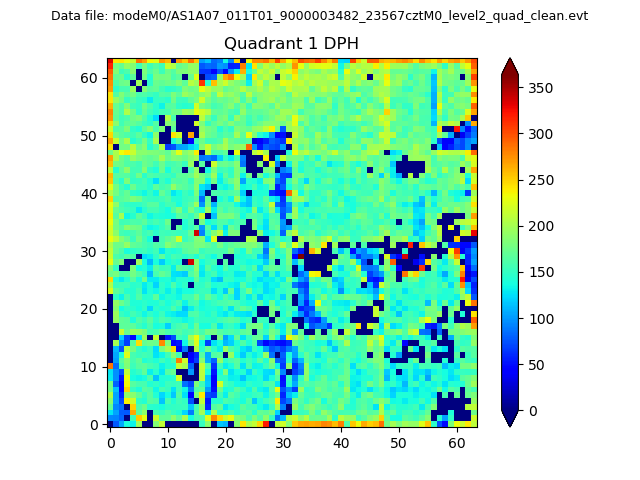 |
Quadrant B |
|---|---|---|---|
| Quadrant D | 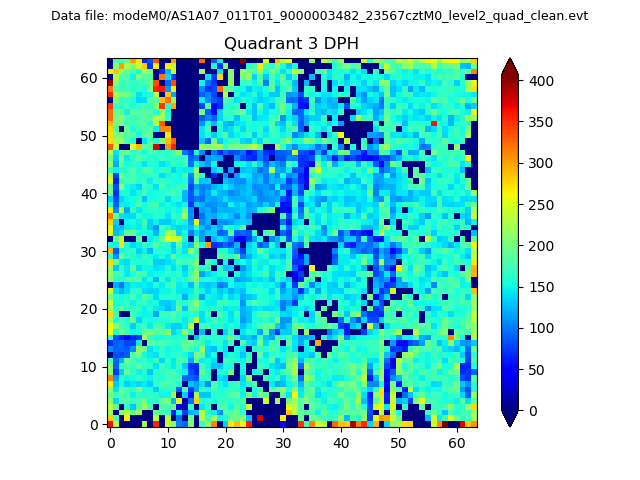 |
 |
Quadrant C |
| Plot type | Count rate plots | Images |
|---|---|---|
| Comparison with Poisson distribution Blue bars denote a histogram of data divided into 1 sec bins. Red curve is a Poisson curve with rate = median count rate of data. |
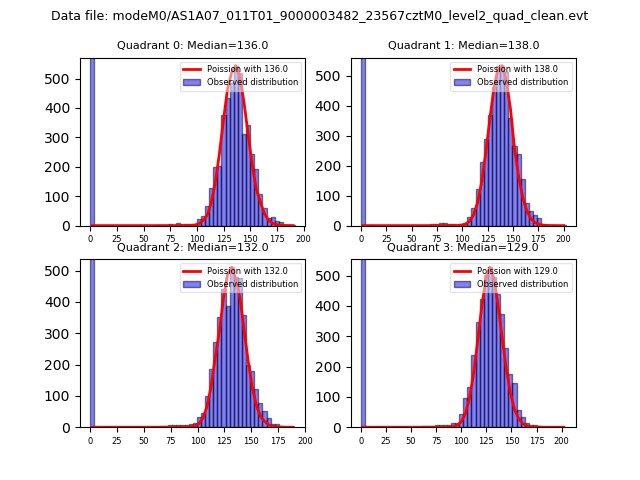 |
 |
| Quadrant-wise count rates Data is divided into 100 sec bins |
 |
|
| Module-wise count rates for Quadrant A Data is divided into 100 sec bins |
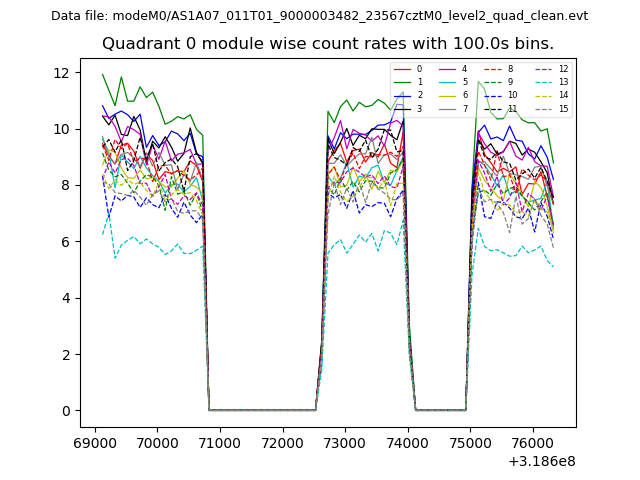 |
 |
| Module-wise count rates for Quadrant B Data is divided into 100 sec bins |
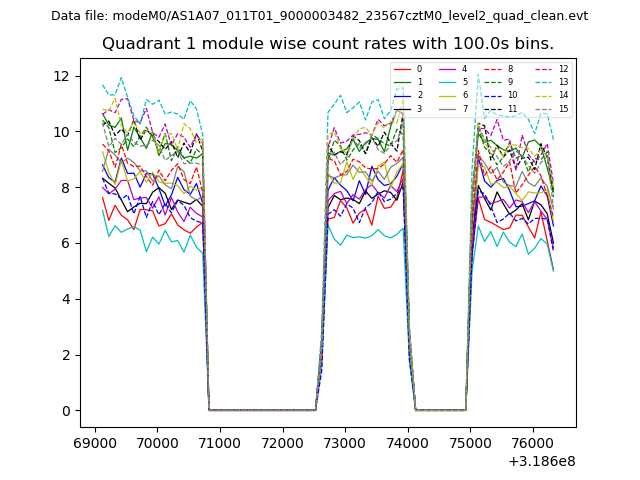 |
 |
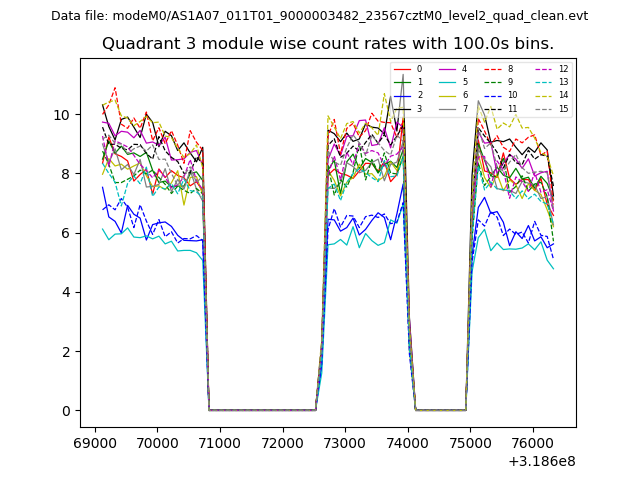
| Module-wise count rates for Quadrant C Data is divided into 100 sec bins |
 |
 |
| Module-wise count rates for Quadrant D Data is divided into 100 sec bins |
 |
 |
| Parameter | Plot |
|---|---|
| CZT HV Monitor | 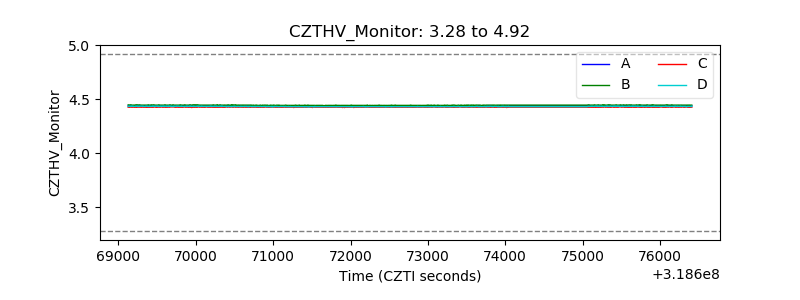 |
| D_VDD | 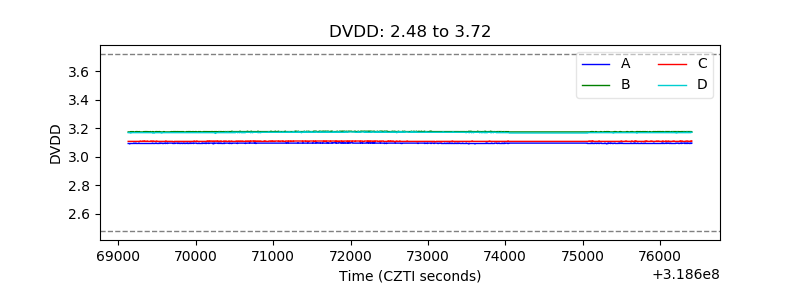 |
| Temperature 1 | 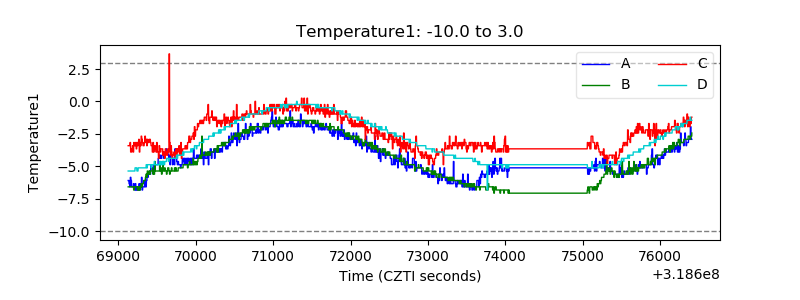 |
| Veto HV Monitor | 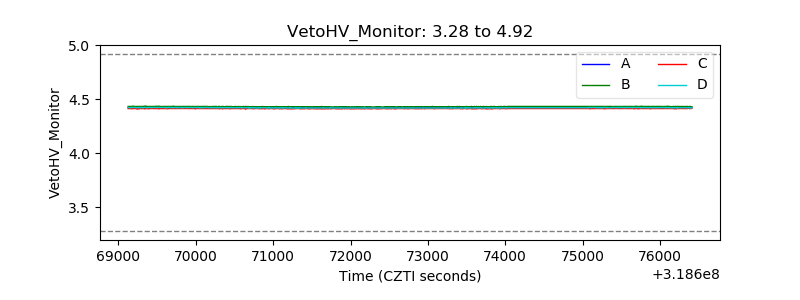 |
| Veto LLD | 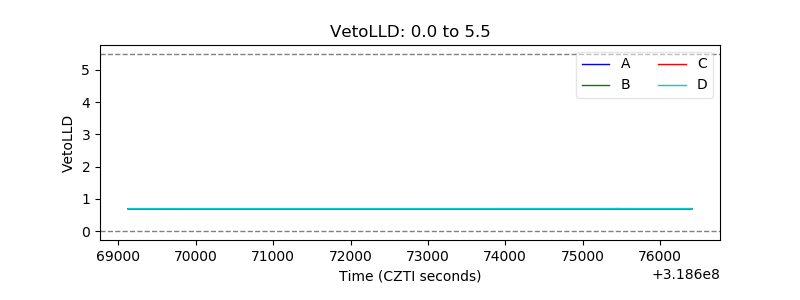 |
| Alpha Counter |  |
| _CPM_Rate | 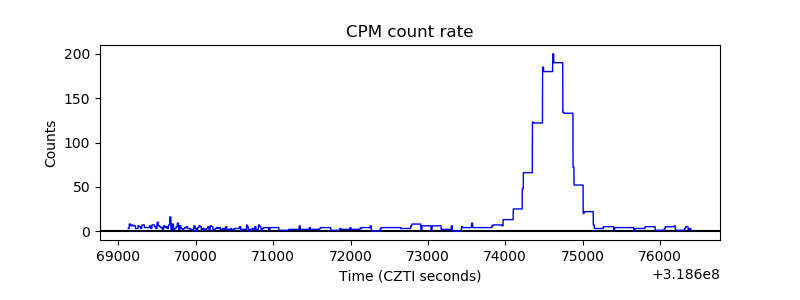 |
| CZT Counter | 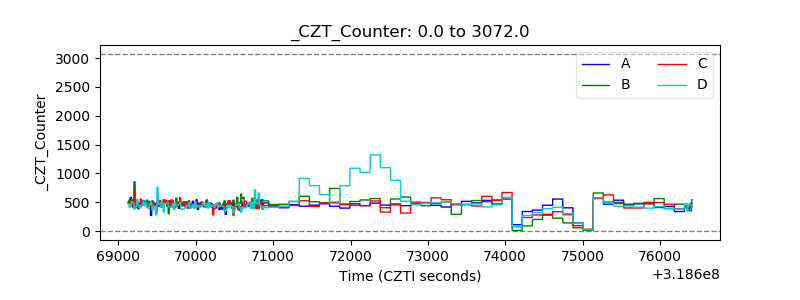 |
| +2.5 Volts monitor |  |
| +5 Volts monitor |  |
| _ROLL_ROT | 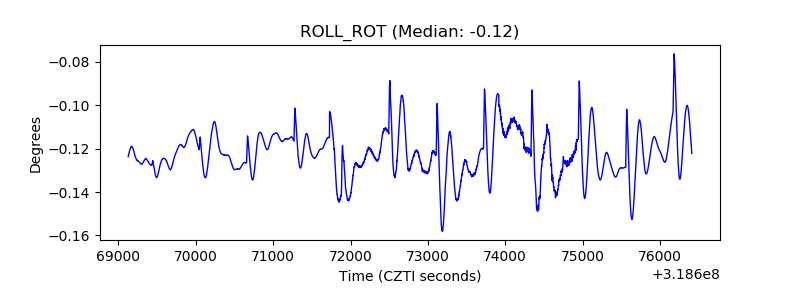 |
| _Roll_DEC | 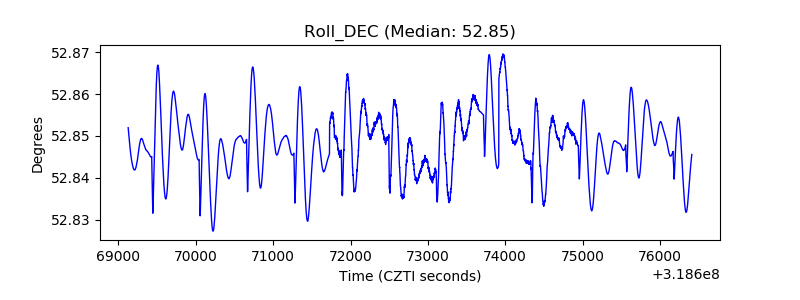 |
| _Roll_RA | 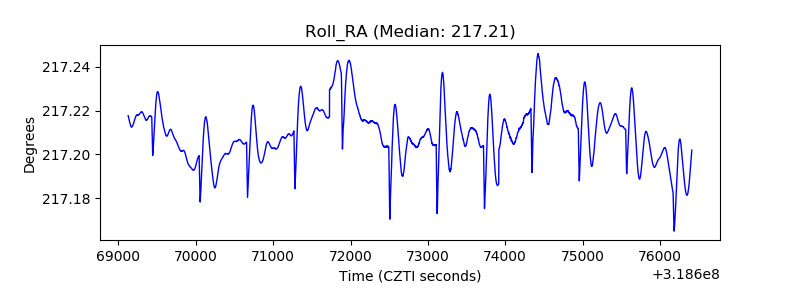 |
| Veto Counter | 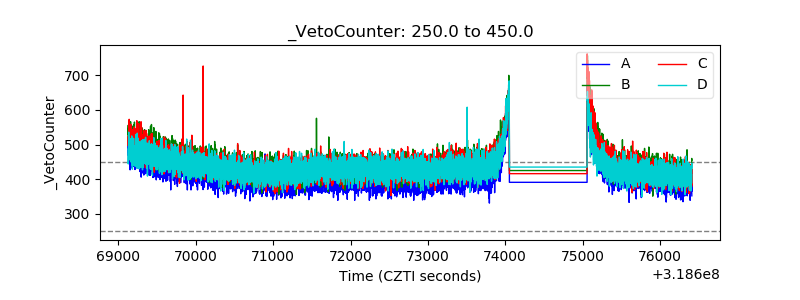 |