| Param | Original file | Final file |
|---|---|---|
| Filename | modeM0/AS1A07_011T01_9000003482_23570cztM0_level2.evt | modeM0/AS1A07_011T01_9000003482_23570cztM0_level2_quad_clean.evt |
| Size (bytes) | 485,262,720 | 82,615,680 |
| Size | 462.8 MB | 78.8 MB |
| Events in quadrant A | 3,260,367 | 511,090 |
| Events in quadrant B | 3,590,695 | 515,303 |
| Events in quadrant C | 3,315,529 | 494,912 |
| Events in quadrant D | 4,050,054 | 488,968 |
| Mode M9 | |||
|---|---|---|---|
| Quadrant | BADHDUFLAG | Total packets | Discarded packets |
| A | 0 | 3 | 0 |
| B | 0 | 3 | 0 |
| C | 0 | 3 | 0 |
| D | 0 | 3 | 0 |
| Mode SS | |||
|---|---|---|---|
| Quadrant | BADHDUFLAG | Total packets | Discarded packets |
| A | 0 | 146 | 0 |
| B | 0 | 146 | 0 |
| C | 0 | 146 | 0 |
| D | 0 | 146 | 0 |
| Mode M0 | |||
|---|---|---|---|
| Quadrant | BADHDUFLAG | Total packets | Discarded packets |
| A | 0 | 14518 | 180 |
| B | 0 | 15363 | 224 |
| C | 0 | 14620 | 174 |
| D | 0 | 17239 | 477 |
| Quadrant | Total seconds | Saturated seconds | Saturation percentage |
|---|---|---|---|
| A | 7047 | 78 | 1.106854% |
| B | 7041 | 127 | 1.803721% |
| C | 7053 | 109 | 1.545442% |
| D | 7043 | 156 | 2.214965% |
Noise dominated data is calculated using 1-second bins in cleaned event files. If a bin has >2000 counts, and if more than 50% of those come from <1% of pixels, then it is considered to be noise-dominated and hence unusable.
| Quadrant | # 1 sec bins | Bins with >0 counts | Bins with >2000 counts | High rate bins dominated by noise | Noise dominated (total time) | Noise dominated (detector-on time) | Marked lightcurve |
|---|---|---|---|---|---|---|---|
| A | 7543 | 7069 | 0 | 0 | 0.00% | 0.00% | 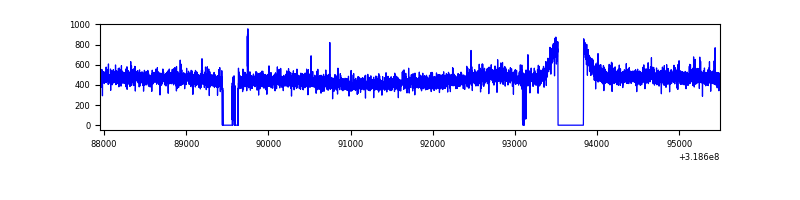 |
| B | 7543 | 7058 | 11 | 11 | 0.15% | 0.16% | 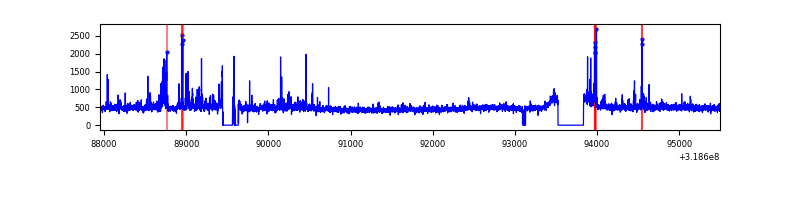 |
| C | 7543 | 7073 | 0 | 0 | 0.00% | 0.00% | 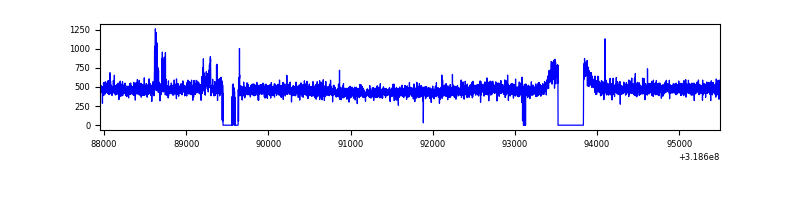 |
| D | 7543 | 7061 | 89 | 89 | 1.18% | 1.26% | 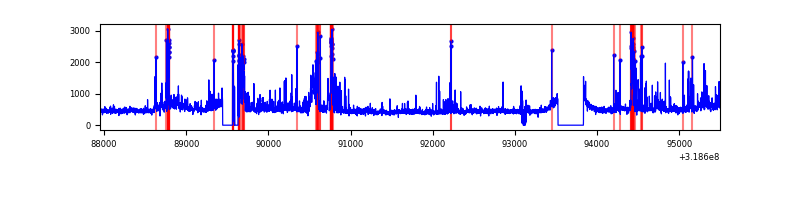 |
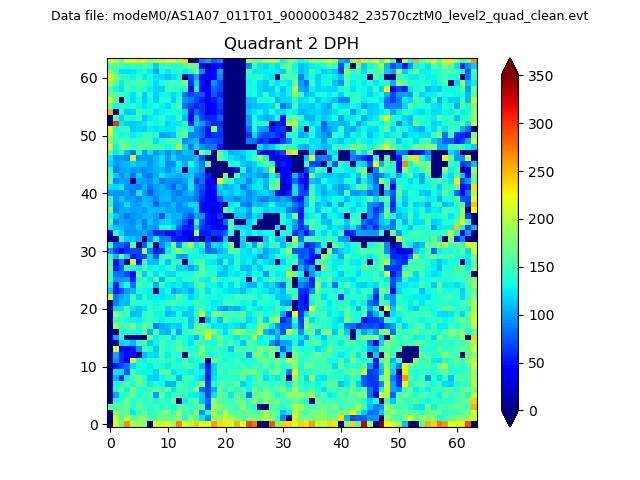
Top three noisy pixels from each quadrant. If the there are fewer than three noisy pixels in the level2.evt file, extra rows are filled as -1
| Pixel properties | Quadrant properties | ||||||
|---|---|---|---|---|---|---|---|
| Quadrant | DetID | PixID | Counts | Sigma | Mean | Median | Sigma |
| A | 13 | 254 | 12353 | 67.15 | 843 | 826 | 171.7 |
| A | 3 | 137 | 7650 | 39.75 | 843 | 826 | 171.7 |
| A | 0 | 226 | 7417 | 38.39 | 843 | 826 | 171.7 |
| B | 0 | 189 | 221929 | 1364.46 | 834 | 810 | 162.1 |
| B | 0 | 229 | 24104 | 143.74 | 834 | 810 | 162.1 |
| B | 0 | 230 | 21214 | 125.91 | 834 | 810 | 162.1 |
| C | 14 | 238 | 126674 | 672.38 | 800 | 805 | 187.2 |
| C | 10 | 9 | 41364 | 216.66 | 800 | 805 | 187.2 |
| C | 7 | 247 | 19905 | 102.03 | 800 | 805 | 187.2 |
| D | 7 | 38 | 245226 | 1231.57 | 813 | 789 | 198.5 |
| D | 9 | 85 | 174583 | 875.64 | 813 | 789 | 198.5 |
| D | 12 | 233 | 136810 | 685.33 | 813 | 789 | 198.5 |
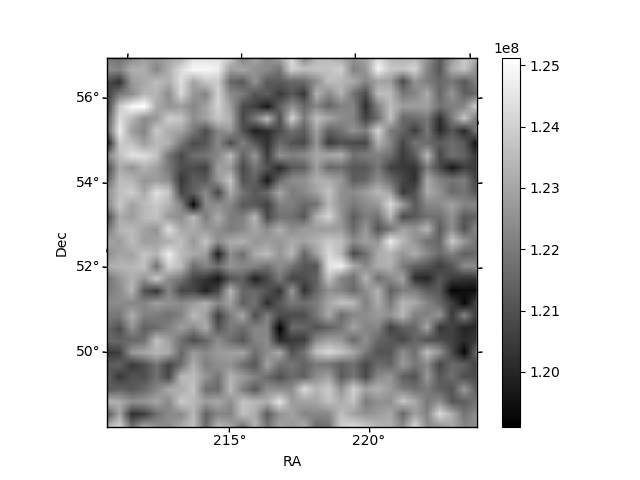
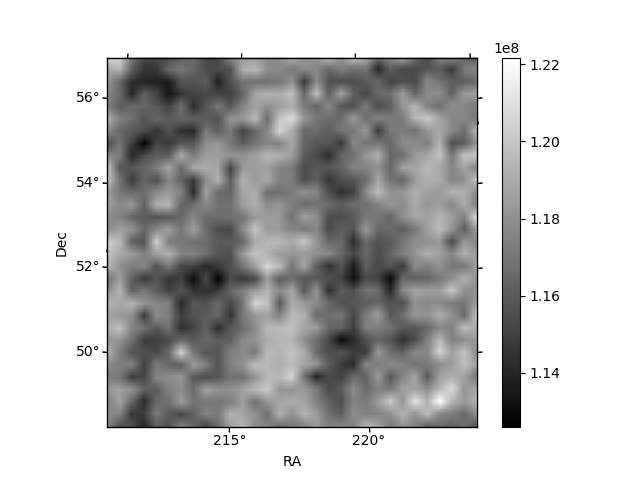
Histogram calculated using DETX and DETY for each event in the final _common_clean file
| Quadrant A |  |
 |
Quadrant B |
|---|---|---|---|
| Quadrant D | 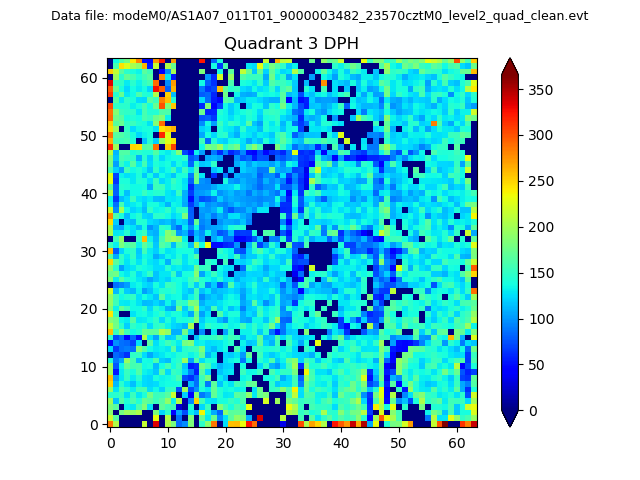 |
 |
Quadrant C |
| Plot type | Count rate plots | Images |
|---|---|---|
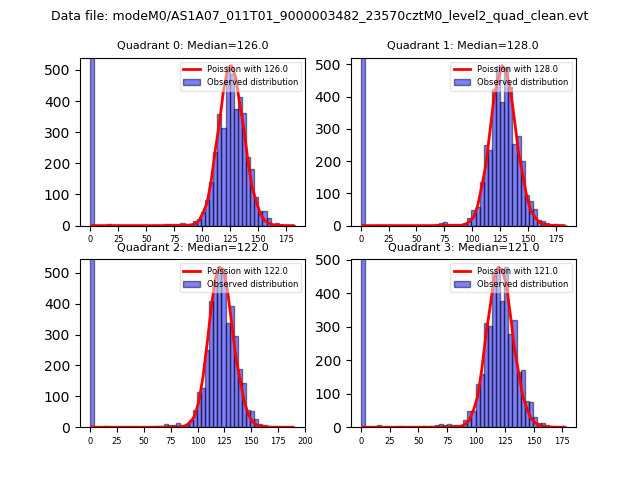
| Comparison with Poisson distribution Blue bars denote a histogram of data divided into 1 sec bins. Red curve is a Poisson curve with rate = median count rate of data. |
 |
 |
| Quadrant-wise count rates Data is divided into 100 sec bins |
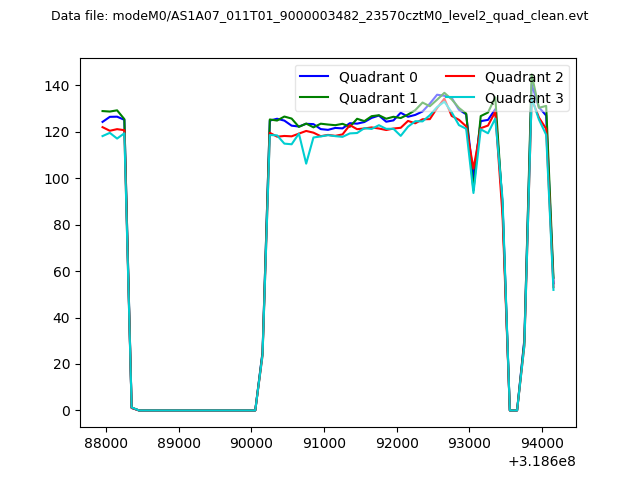 |
|
| Module-wise count rates for Quadrant A Data is divided into 100 sec bins |
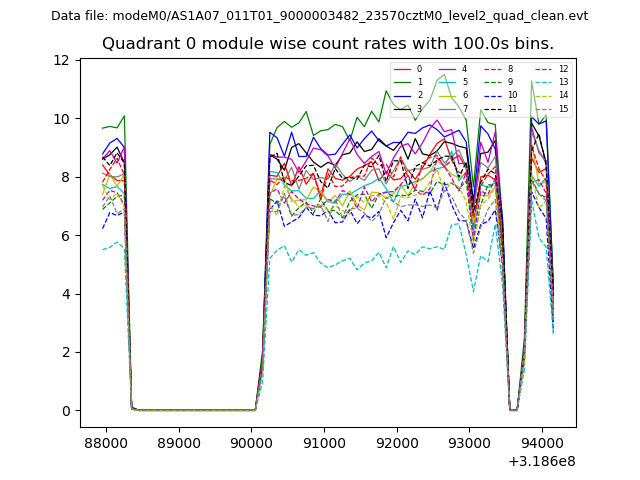 |
 |
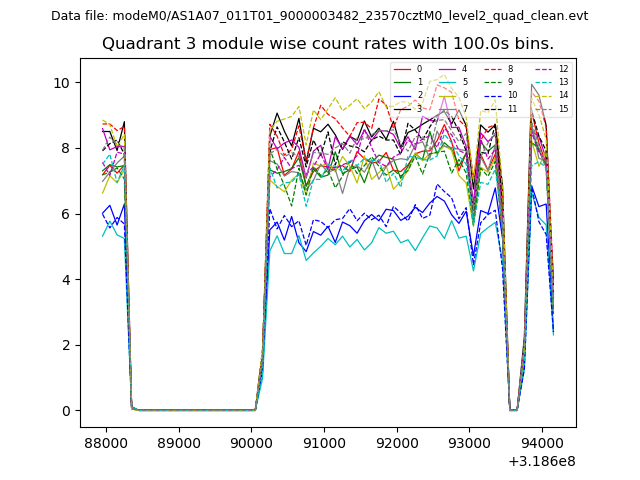
| Module-wise count rates for Quadrant B Data is divided into 100 sec bins |
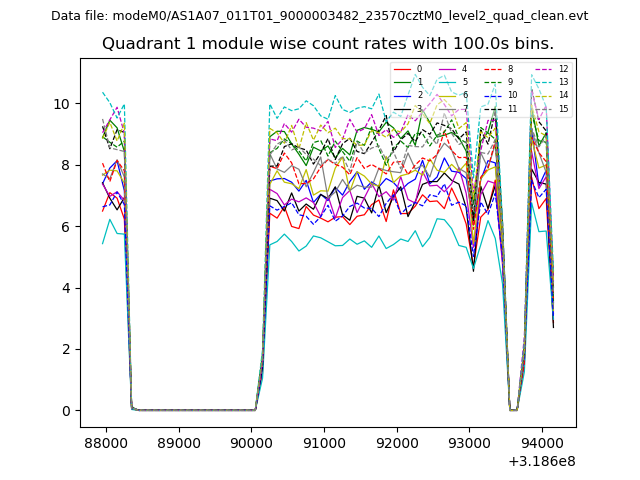 |
 |
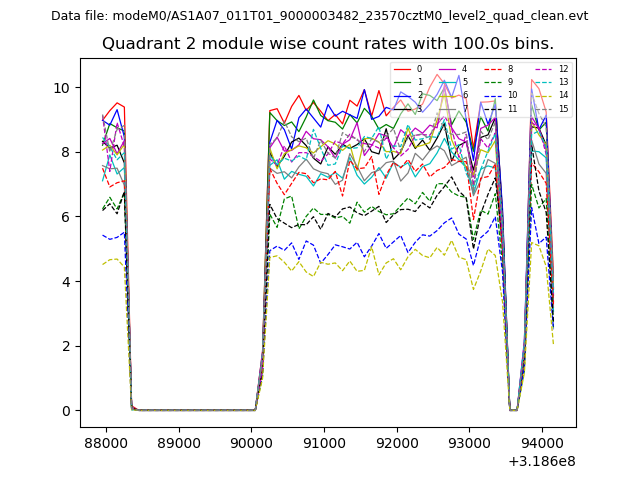
| Module-wise count rates for Quadrant C Data is divided into 100 sec bins |
 |
 |
| Module-wise count rates for Quadrant D Data is divided into 100 sec bins |
 |
 |
| Parameter | Plot |
|---|---|
| CZT HV Monitor | 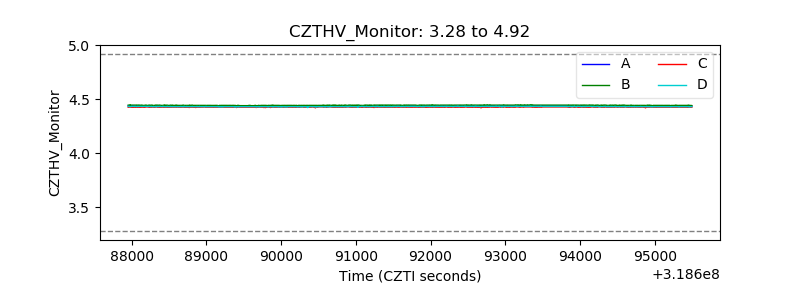 |
| D_VDD | 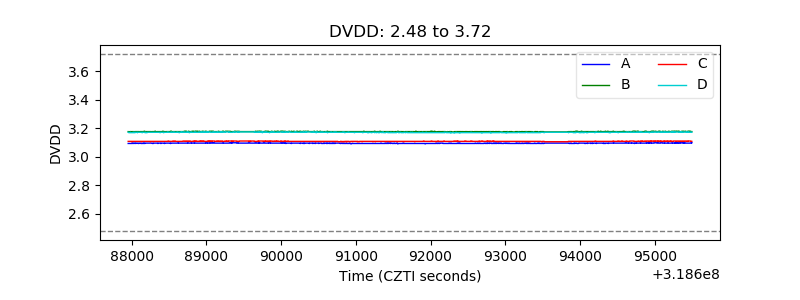 |
| Temperature 1 | 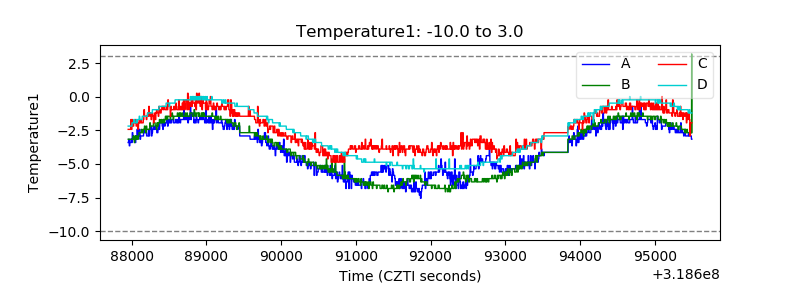 |
| Veto HV Monitor |  |
| Veto LLD | 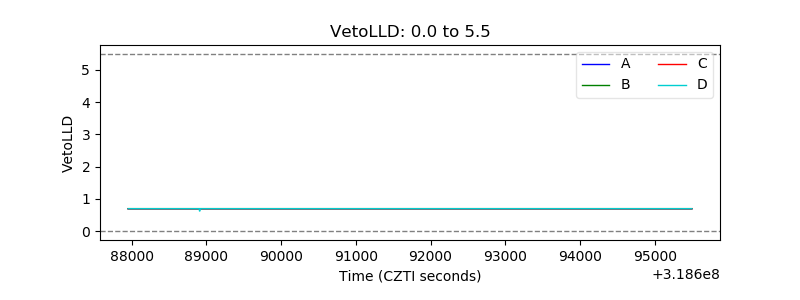 |
| Alpha Counter | 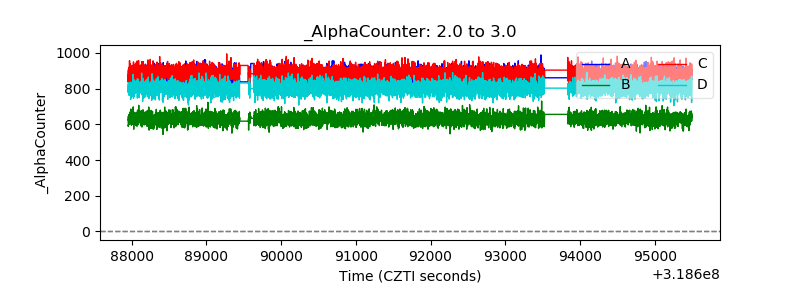 |
| _CPM_Rate | 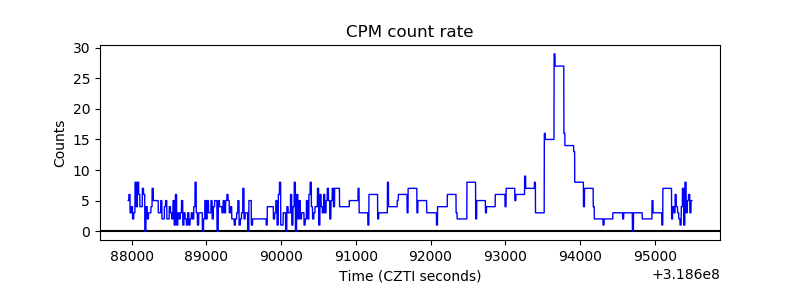 |
| CZT Counter | 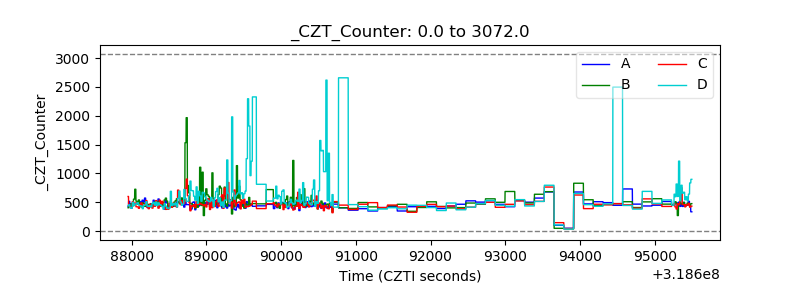 |
| +2.5 Volts monitor |  |
| +5 Volts monitor |  |
| _ROLL_ROT | 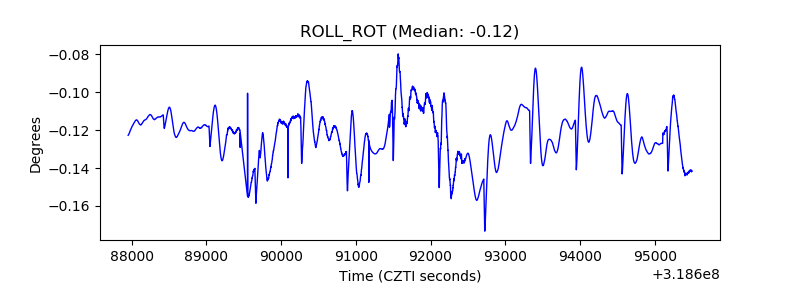 |
| _Roll_DEC | 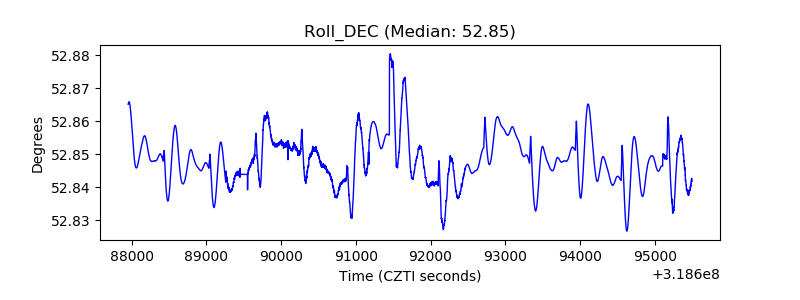 |
| _Roll_RA | 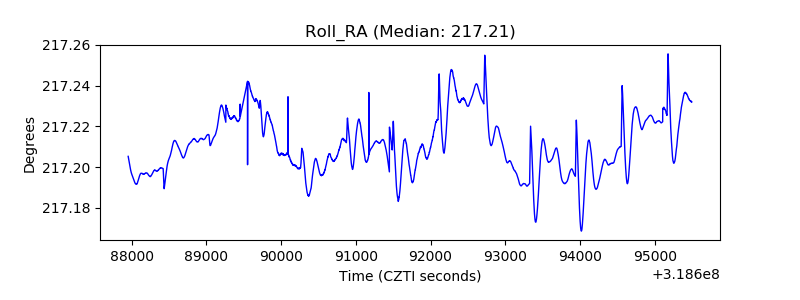 |
| Veto Counter | 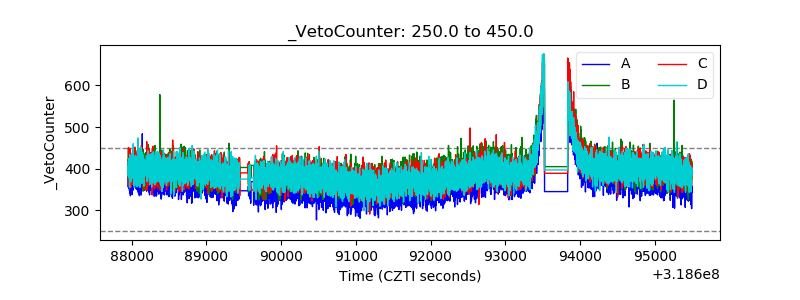 |