| Param | Original file | Final file |
|---|---|---|
| Filename | modeM0/AS1A07_011T01_9000003482_23574cztM0_level2.evt | modeM0/AS1A07_011T01_9000003482_23574cztM0_level2_quad_clean.evt |
| Size (bytes) | 1,744,355,520 | 351,054,720 |
| Size | 1.6 GB | 334.8 MB |
| Events in quadrant A | 11,579,687 | 2,256,682 |
| Events in quadrant B | 12,520,117 | 2,279,844 |
| Events in quadrant C | 12,073,612 | 2,205,402 |
| Events in quadrant D | 14,955,013 | 2,160,972 |
| Mode M9 | |||
|---|---|---|---|
| Quadrant | BADHDUFLAG | Total packets | Discarded packets |
| A | 0 | 30 | 1 |
| B | 0 | 31 | 2 |
| C | 0 | 30 | 2 |
| D | 0 | 30 | 1 |
| Mode SS | |||
|---|---|---|---|
| Quadrant | BADHDUFLAG | Total packets | Discarded packets |
| A | 0 | 516 | 0 |
| B | 0 | 516 | 0 |
| C | 0 | 516 | 0 |
| D | 0 | 517 | 1 |
| Mode M0 | |||
|---|---|---|---|
| Quadrant | BADHDUFLAG | Total packets | Discarded packets |
| A | 0 | 51691 | 307 |
| B | 0 | 53968 | 301 |
| C | 0 | 52706 | 302 |
| D | 0 | 62483 | 481 |
| Quadrant | Total seconds | Saturated seconds | Saturation percentage |
|---|---|---|---|
| A | 25140 | 238 | 0.946698% |
| B | 25144 | 363 | 1.443684% |
| C | 25151 | 452 | 1.797145% |
| D | 25130 | 775 | 3.083963% |
Noise dominated data is calculated using 1-second bins in cleaned event files. If a bin has >2000 counts, and if more than 50% of those come from <1% of pixels, then it is considered to be noise-dominated and hence unusable.
| Quadrant | # 1 sec bins | Bins with >0 counts | Bins with >2000 counts | High rate bins dominated by noise | Noise dominated (total time) | Noise dominated (detector-on time) | Marked lightcurve |
|---|---|---|---|---|---|---|---|
| A | 28508 | 25203 | 2 | 2 | 0.01% | 0.01% | 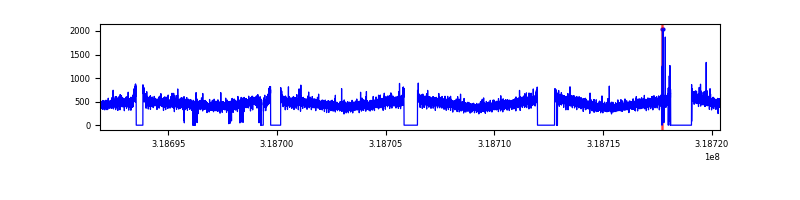 |
| B | 28501 | 25203 | 61 | 61 | 0.21% | 0.24% | 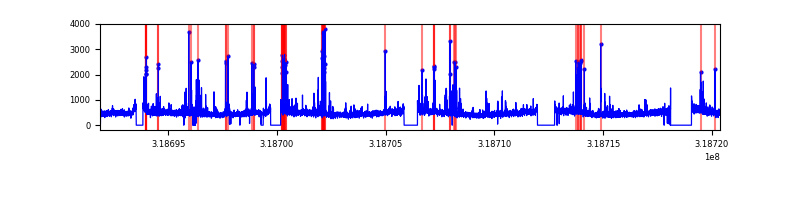 |
| C | 28499 | 25200 | 66 | 66 | 0.23% | 0.26% | 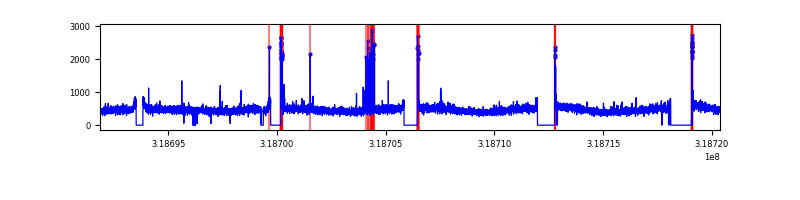 |
| D | 28507 | 25183 | 455 | 455 | 1.60% | 1.81% | 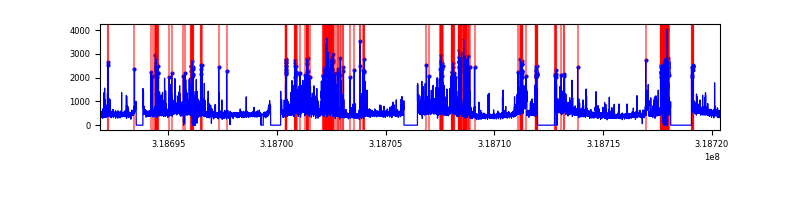 |
Top three noisy pixels from each quadrant. If the there are fewer than three noisy pixels in the level2.evt file, extra rows are filled as -1
| Pixel properties | Quadrant properties | ||||||
|---|---|---|---|---|---|---|---|
| Quadrant | DetID | PixID | Counts | Sigma | Mean | Median | Sigma |
| A | 13 | 254 | 44302 | 69.02 | 2991 | 2922 | 599.5 |
| A | 3 | 137 | 27146 | 40.41 | 2991 | 2922 | 599.5 |
| A | 0 | 226 | 25718 | 38.02 | 2991 | 2922 | 599.5 |
| B | 0 | 189 | 358501 | 633.63 | 2971 | 2901 | 561.2 |
| B | 4 | 216 | 185079 | 324.62 | 2971 | 2901 | 561.2 |
| B | 0 | 230 | 77034 | 132.1 | 2971 | 2901 | 561.2 |
| C | 14 | 238 | 451575 | 677.66 | 2852 | 2863 | 662.1 |
| C | 0 | 10 | 291821 | 436.39 | 2852 | 2863 | 662.1 |
| C | 10 | 9 | 150949 | 223.64 | 2852 | 2863 | 662.1 |
| D | 1 | 52 | 2112248 | 3028.37 | 2869 | 2787 | 696.6 |
| D | 7 | 38 | 686911 | 982.14 | 2869 | 2787 | 696.6 |
| D | 12 | 233 | 502794 | 717.82 | 2869 | 2787 | 696.6 |
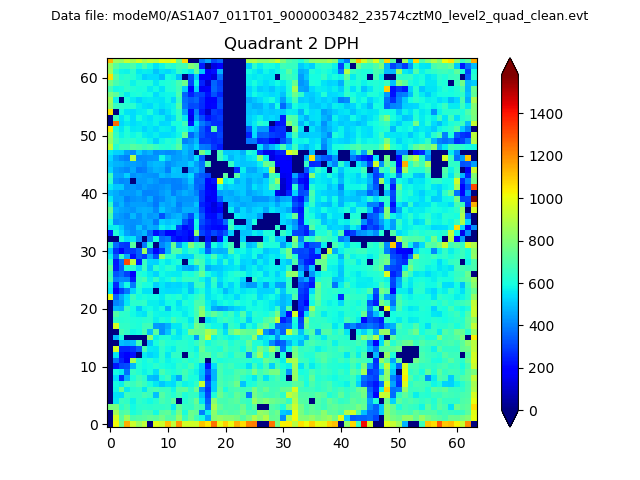
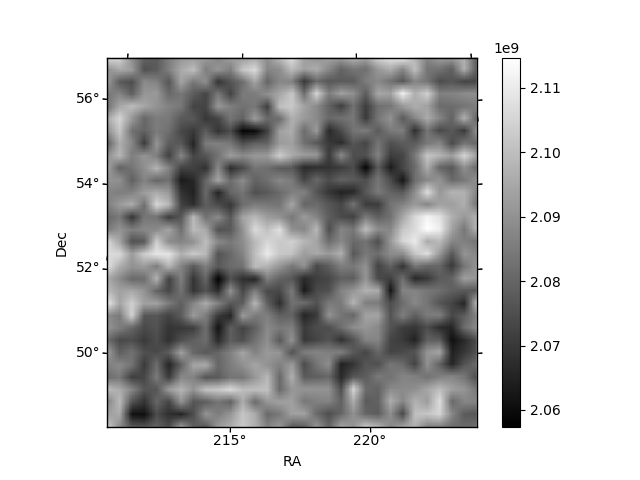
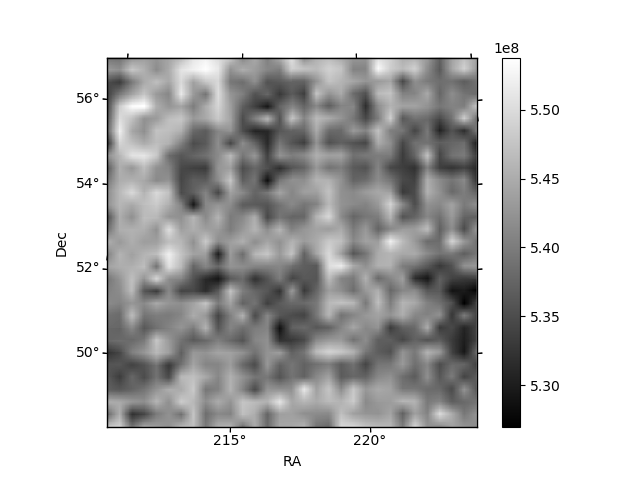
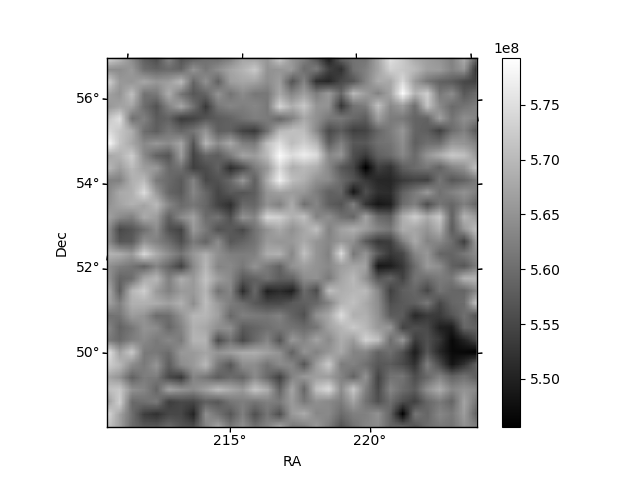
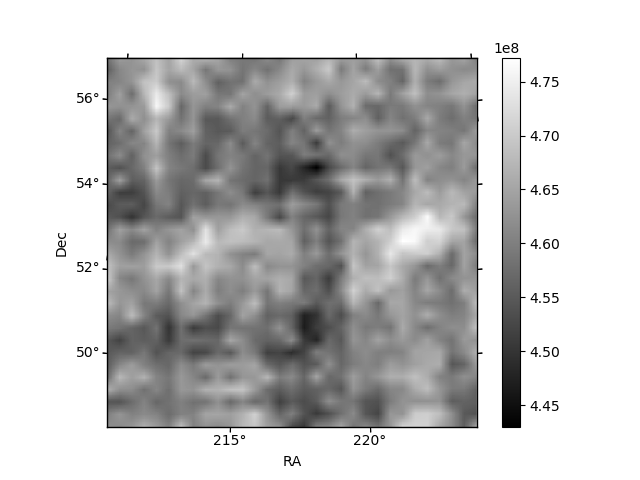
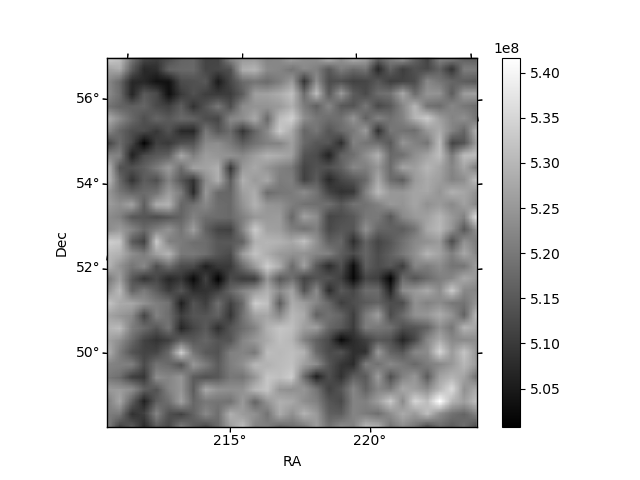
Histogram calculated using DETX and DETY for each event in the final _common_clean file
| Quadrant A | 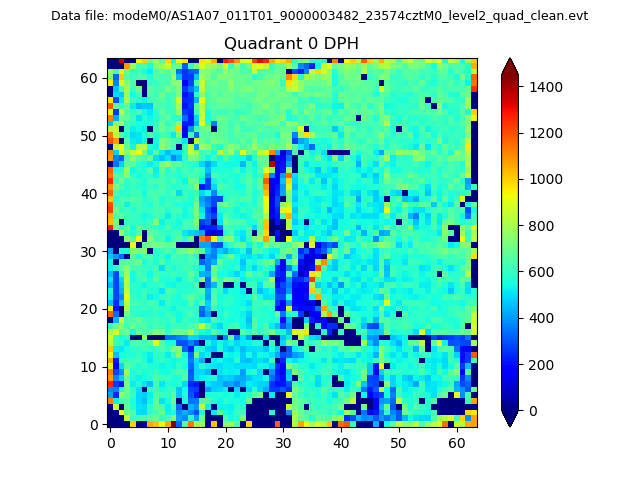 |
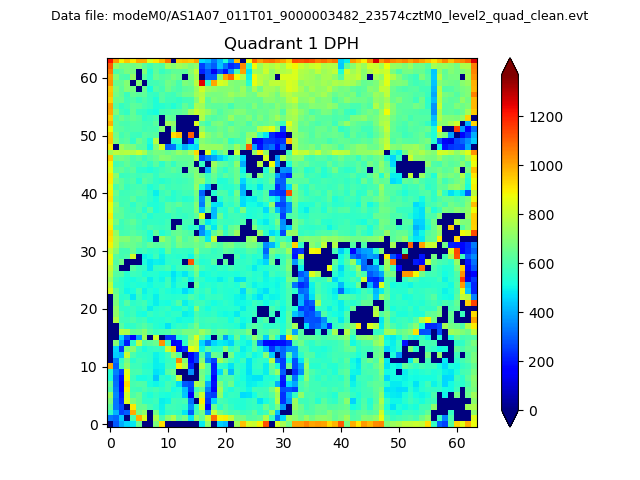 |
Quadrant B |
|---|---|---|---|
| Quadrant D | 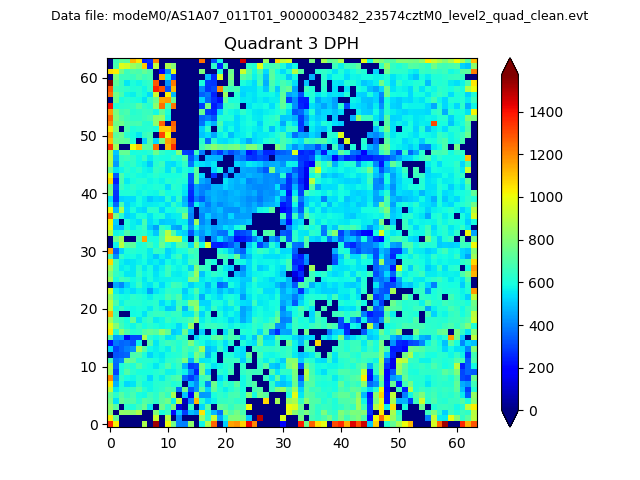 |
 |
Quadrant C |
| Plot type | Count rate plots | Images |
|---|---|---|
| Comparison with Poisson distribution Blue bars denote a histogram of data divided into 1 sec bins. Red curve is a Poisson curve with rate = median count rate of data. |
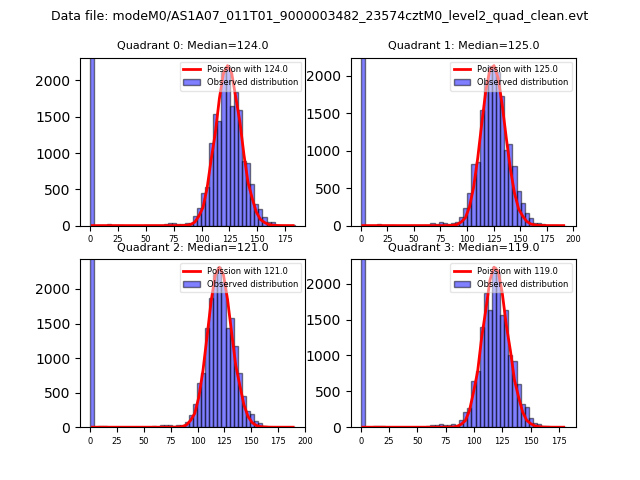 |
 |
| Quadrant-wise count rates Data is divided into 100 sec bins |
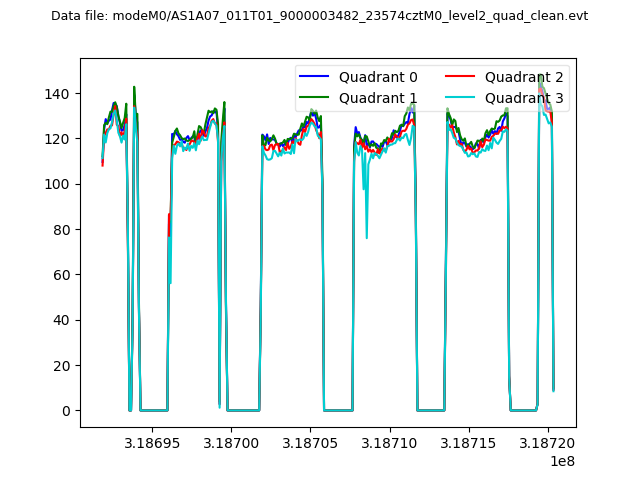 |
|
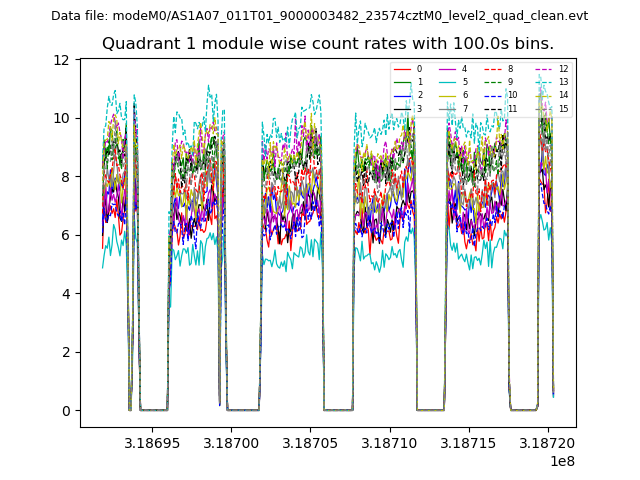
| Module-wise count rates for Quadrant A Data is divided into 100 sec bins |
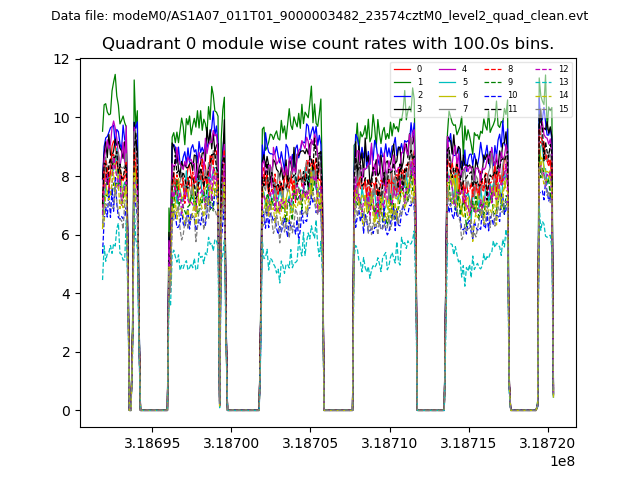 |
 |
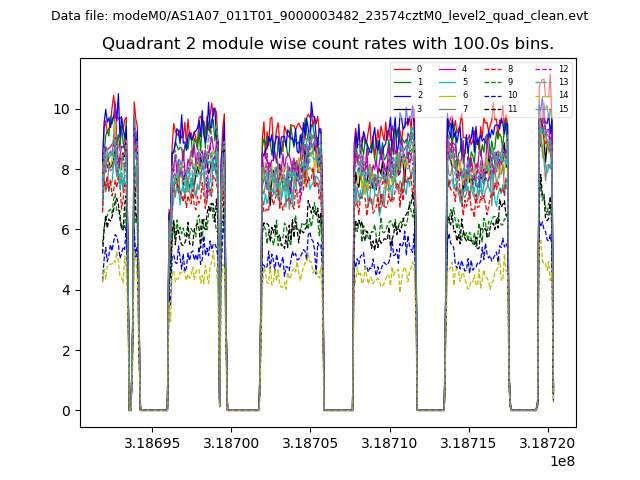
| Module-wise count rates for Quadrant B Data is divided into 100 sec bins |
 |
 |
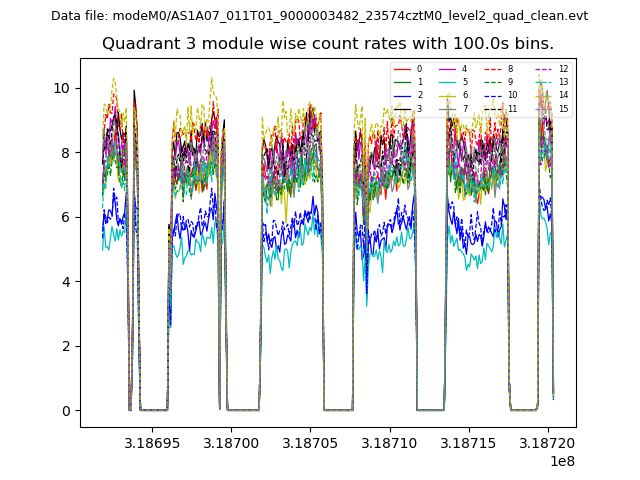
| Module-wise count rates for Quadrant C Data is divided into 100 sec bins |
 |
 |
| Module-wise count rates for Quadrant D Data is divided into 100 sec bins |
 |
 |
| Parameter | Plot |
|---|---|
| CZT HV Monitor | 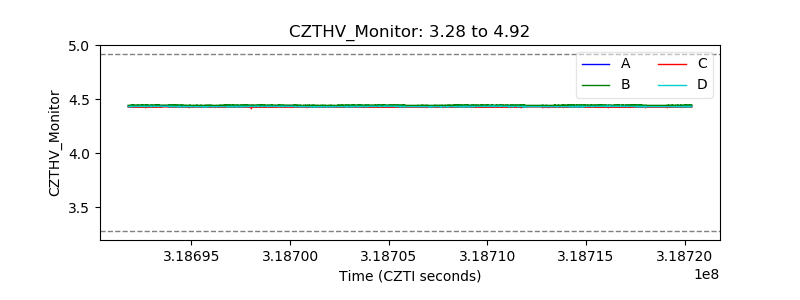 |
| D_VDD | 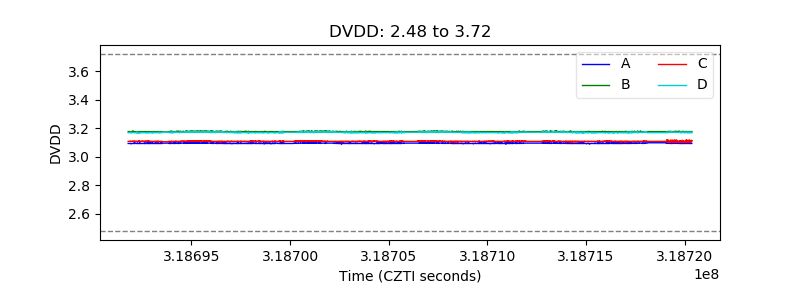 |
| Temperature 1 | 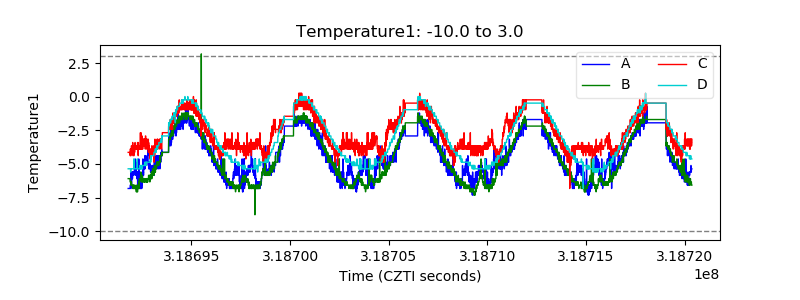 |
| Veto HV Monitor |  |
| Veto LLD | 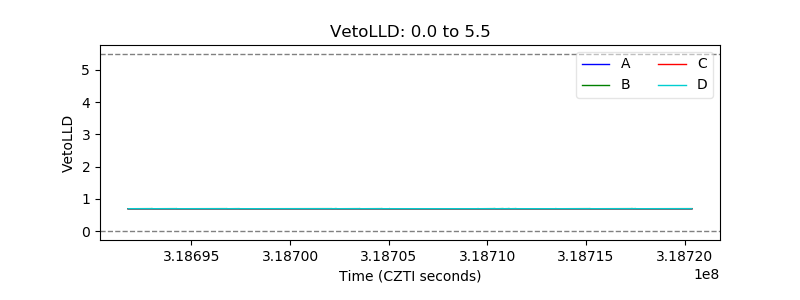 |
| Alpha Counter | 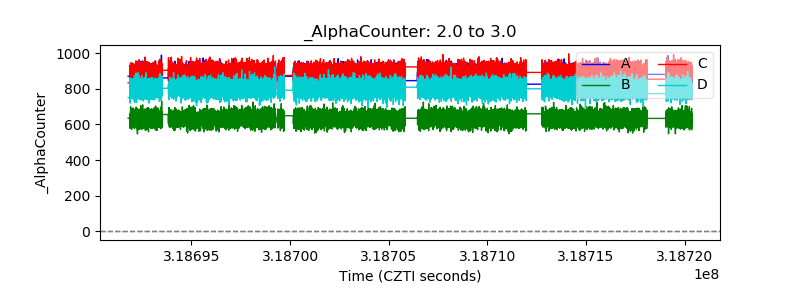 |
| _CPM_Rate | 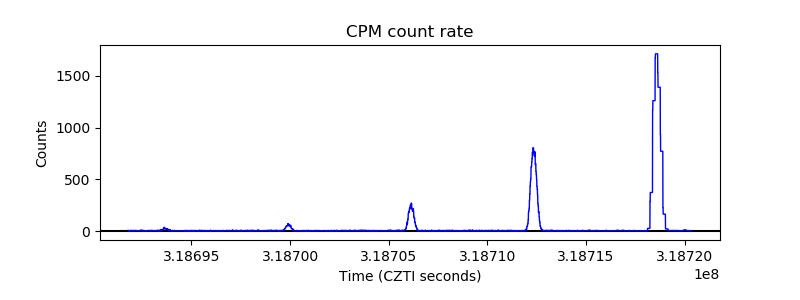 |
| CZT Counter | 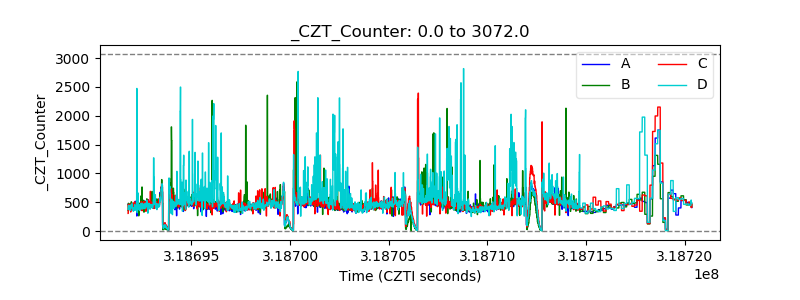 |
| +2.5 Volts monitor |  |
| +5 Volts monitor |  |
| _ROLL_ROT | 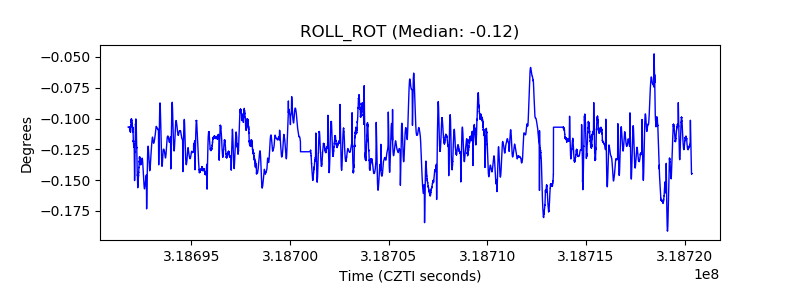 |
| _Roll_DEC |  |
| _Roll_RA | 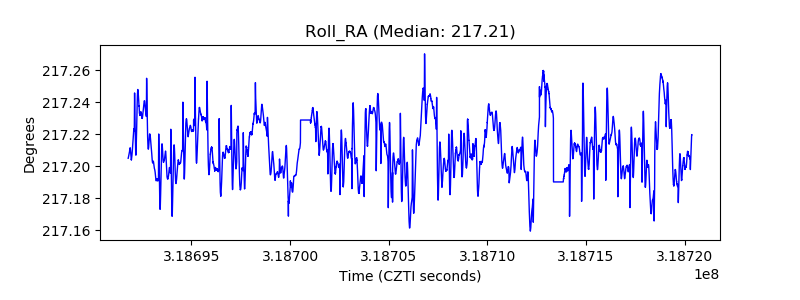 |
| Veto Counter | 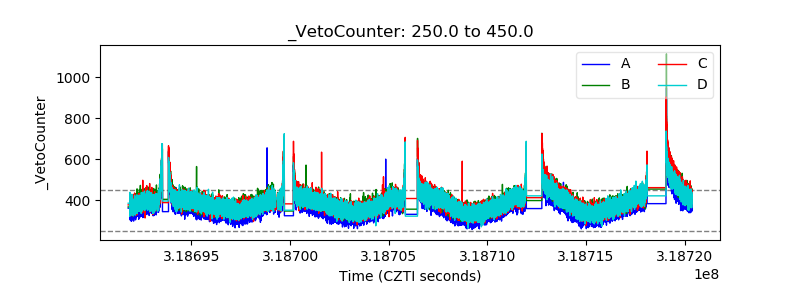 |