| Param | Original file | Final file |
|---|---|---|
| Filename | modeM0/AS1A07_011T01_9000003482_23576cztM0_level2.evt | modeM0/AS1A07_011T01_9000003482_23576cztM0_level2_quad_clean.evt |
| Size (bytes) | 251,078,400 | 56,321,280 |
| Size | 239.4 MB | 53.7 MB |
| Events in quadrant A | 1,735,417 | 367,527 |
| Events in quadrant B | 1,900,713 | 379,580 |
| Events in quadrant C | 1,856,579 | 356,292 |
| Events in quadrant D | 1,868,437 | 350,646 |
| Mode M9 | |||
|---|---|---|---|
| Quadrant | BADHDUFLAG | Total packets | Discarded packets |
| A | 0 | 14 | 2 |
| B | 0 | 14 | 2 |
| C | 0 | 14 | 2 |
| D | 0 | 16 | 4 |
| Mode SS | |||
|---|---|---|---|
| Quadrant | BADHDUFLAG | Total packets | Discarded packets |
| A | 0 | 86 | 12 |
| B | 0 | 86 | 12 |
| C | 0 | 87 | 11 |
| D | 0 | 86 | 12 |
| Mode M0 | |||
|---|---|---|---|
| Quadrant | BADHDUFLAG | Total packets | Discarded packets |
| A | 0 | 8391 | 992 |
| B | 0 | 9000 | 1074 |
| C | 0 | 8897 | 1166 |
| D | 0 | 9150 | 1156 |
| Quadrant | Total seconds | Saturated seconds | Saturation percentage |
|---|---|---|---|
| A | 3545 | 14 | 0.394922% |
| B | 3544 | 38 | 1.072235% |
| C | 3541 | 103 | 2.908783% |
| D | 3540 | 25 | 0.706215% |
Noise dominated data is calculated using 1-second bins in cleaned event files. If a bin has >2000 counts, and if more than 50% of those come from <1% of pixels, then it is considered to be noise-dominated and hence unusable.
| Quadrant | # 1 sec bins | Bins with >0 counts | Bins with >2000 counts | High rate bins dominated by noise | Noise dominated (total time) | Noise dominated (detector-on time) | Marked lightcurve |
|---|---|---|---|---|---|---|---|
| A | 7544 | 3563 | 0 | 0 | 0.00% | 0.00% | 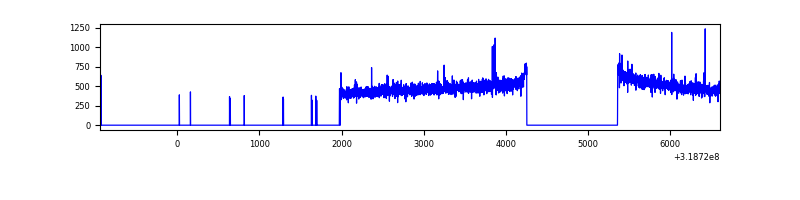 |
| B | 6583 | 3555 | 7 | 7 | 0.11% | 0.20% | 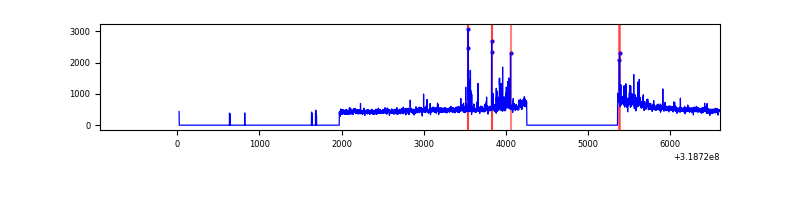 |
| C | 5967 | 3556 | 41 | 41 | 0.69% | 1.15% | 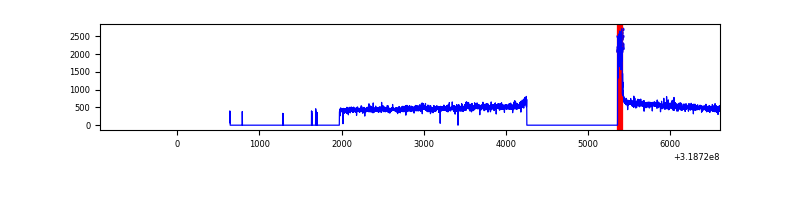 |
| D | 7546 | 3554 | 3 | 3 | 0.04% | 0.08% | 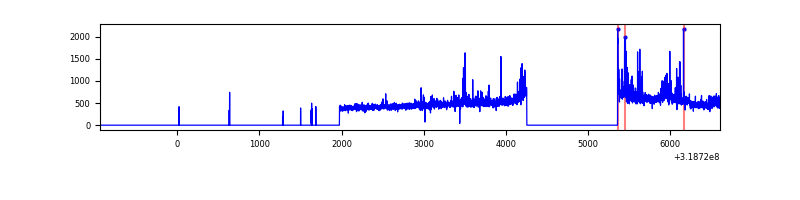 |
Top three noisy pixels from each quadrant. If the there are fewer than three noisy pixels in the level2.evt file, extra rows are filled as -1
| Pixel properties | Quadrant properties | ||||||
|---|---|---|---|---|---|---|---|
| Quadrant | DetID | PixID | Counts | Sigma | Mean | Median | Sigma |
| A | 6 | 16 | 7908 | 81.72 | 448 | 439 | 91.4 |
| A | 13 | 254 | 6136 | 62.33 | 448 | 439 | 91.4 |
| A | 3 | 137 | 3880 | 37.65 | 448 | 439 | 91.4 |
| B | 0 | 189 | 52203 | 608.28 | 444 | 433 | 85.1 |
| B | 0 | 230 | 38403 | 446.14 | 444 | 433 | 85.1 |
| B | 4 | 216 | 29370 | 340.0 | 444 | 433 | 85.1 |
| C | 0 | 10 | 131489 | 1315.45 | 422 | 425 | 99.6 |
| C | 14 | 238 | 66166 | 659.82 | 422 | 425 | 99.6 |
| C | 1 | 16 | 5248 | 48.41 | 422 | 425 | 99.6 |
| D | 1 | 52 | 124460 | 1175.6 | 433 | 420 | 105.5 |
| D | 9 | 85 | 35024 | 327.96 | 433 | 420 | 105.5 |
| D | 7 | 223 | 32763 | 306.53 | 433 | 420 | 105.5 |
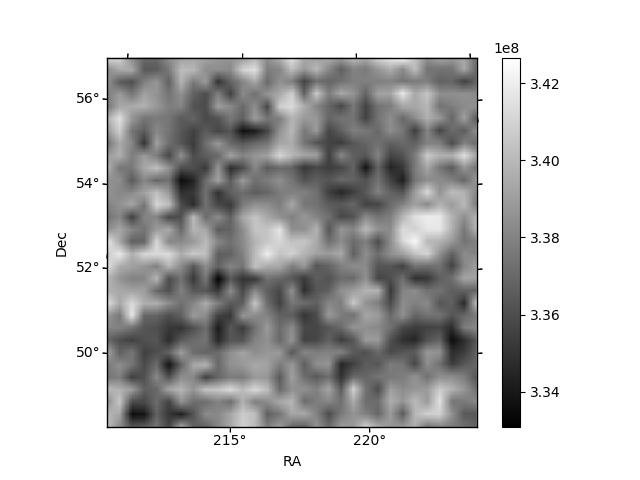
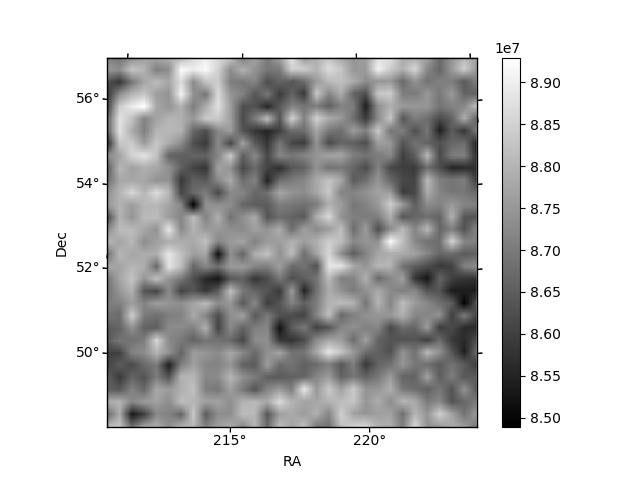
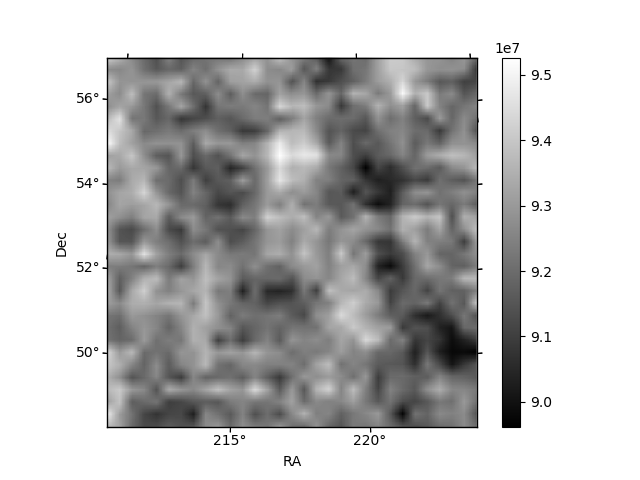
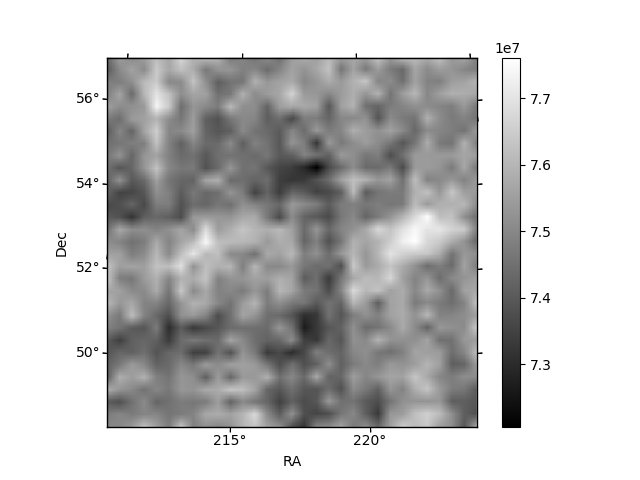
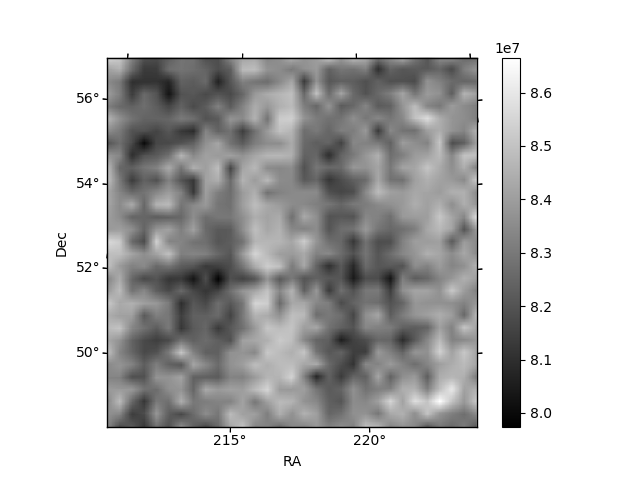
Histogram calculated using DETX and DETY for each event in the final _common_clean file
| Quadrant A | 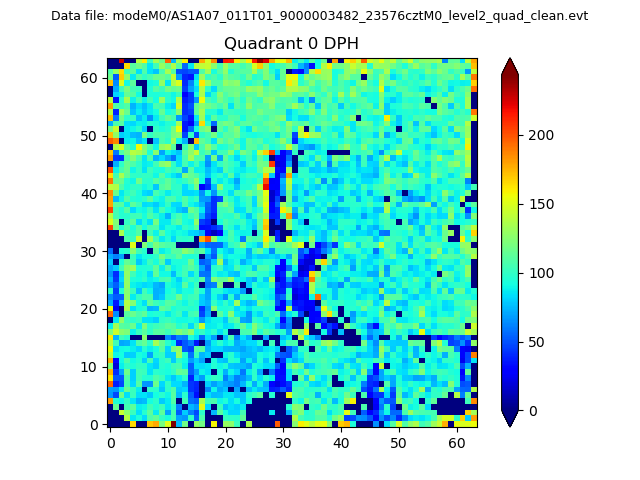 |
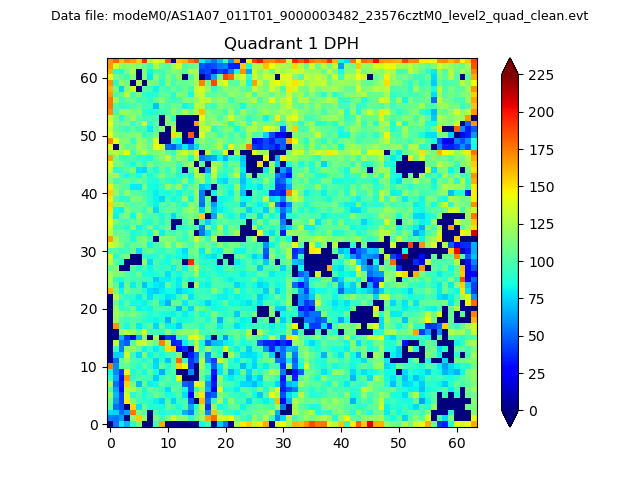 |
Quadrant B |
|---|---|---|---|
| Quadrant D | 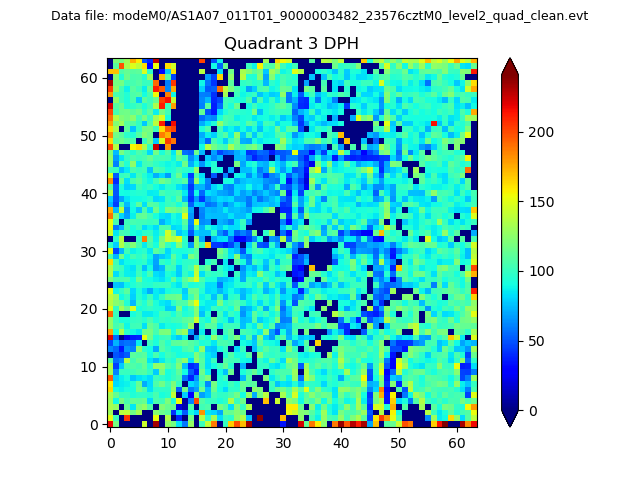 |
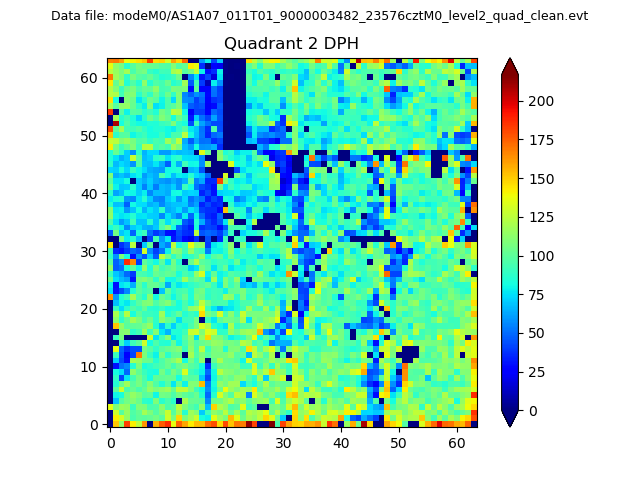 |
Quadrant C |
| Plot type | Count rate plots | Images |
|---|---|---|
| Comparison with Poisson distribution Blue bars denote a histogram of data divided into 1 sec bins. Red curve is a Poisson curve with rate = median count rate of data. |
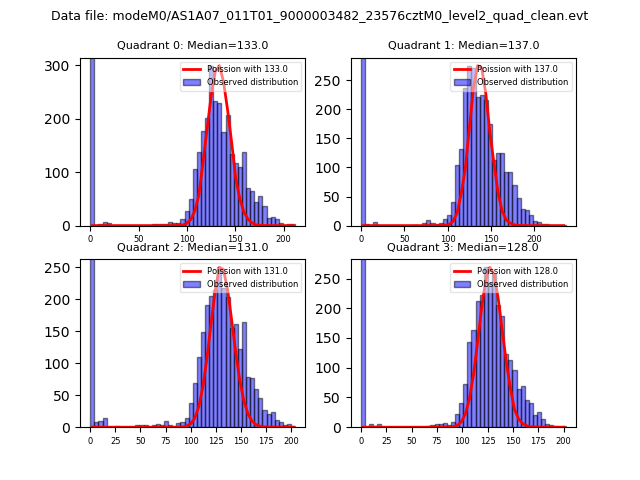 |
 |
| Quadrant-wise count rates Data is divided into 100 sec bins |
 |
|
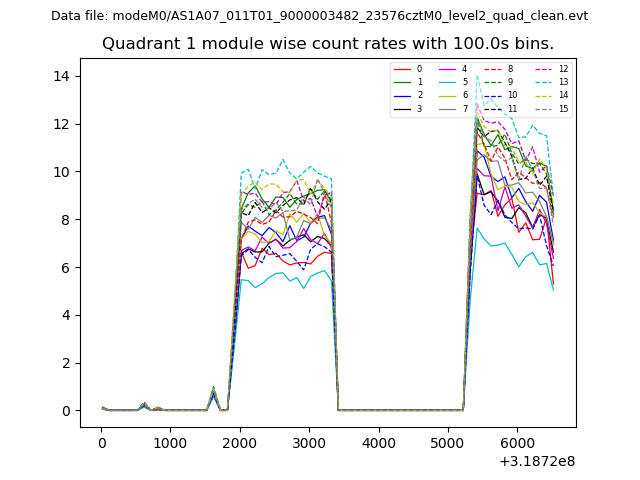
| Module-wise count rates for Quadrant A Data is divided into 100 sec bins |
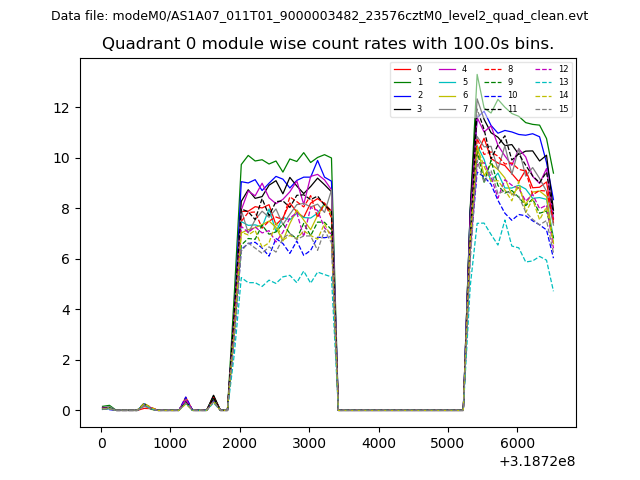 |
 |
| Module-wise count rates for Quadrant B Data is divided into 100 sec bins |
 |
 |
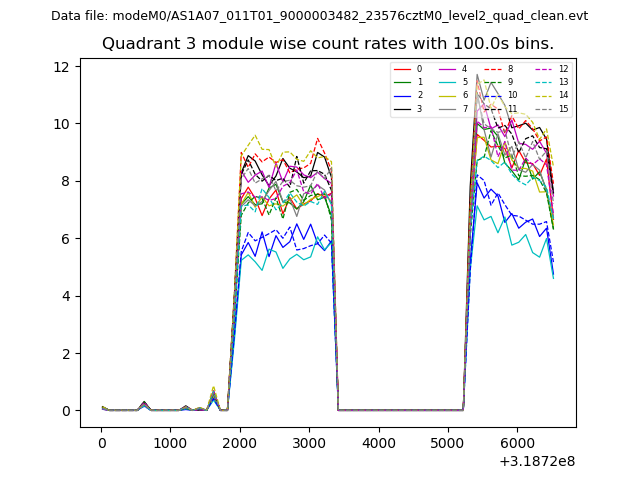
| Module-wise count rates for Quadrant C Data is divided into 100 sec bins |
 |
 |
| Module-wise count rates for Quadrant D Data is divided into 100 sec bins |
 |
 |
| Parameter | Plot |
|---|---|
| CZT HV Monitor | 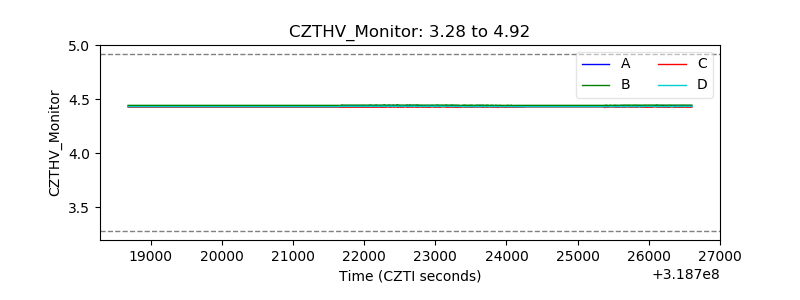 |
| D_VDD | 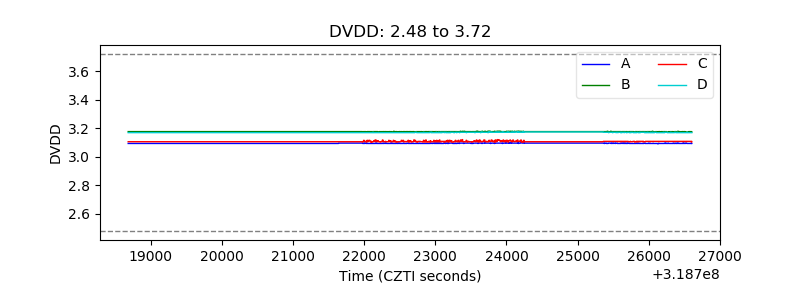 |
| Temperature 1 | 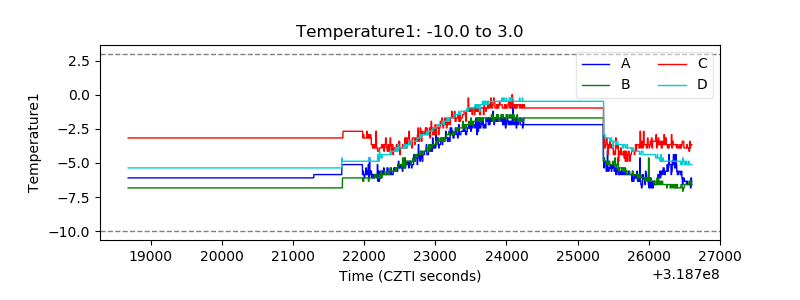 |
| Veto HV Monitor | 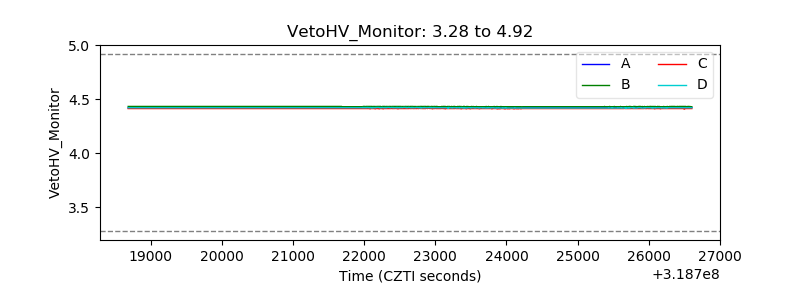 |
| Veto LLD | 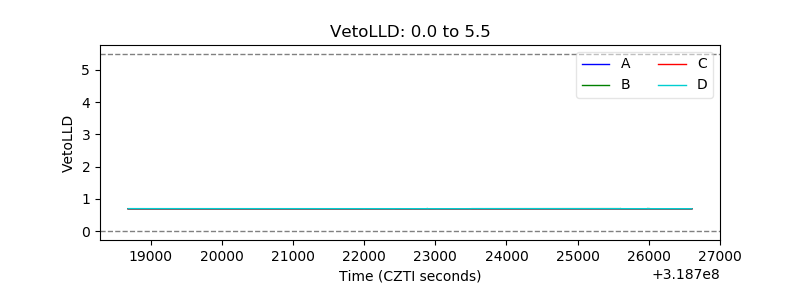 |
| Alpha Counter |  |
| _CPM_Rate | 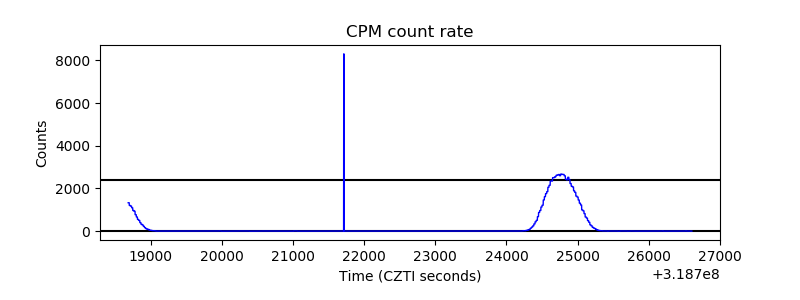 |
| CZT Counter | 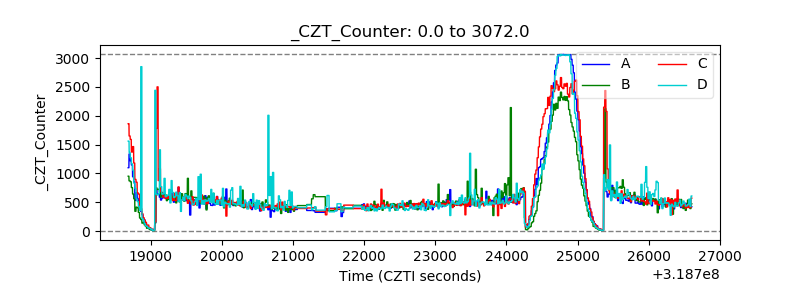 |
| +2.5 Volts monitor |  |
| +5 Volts monitor |  |
| _ROLL_ROT | 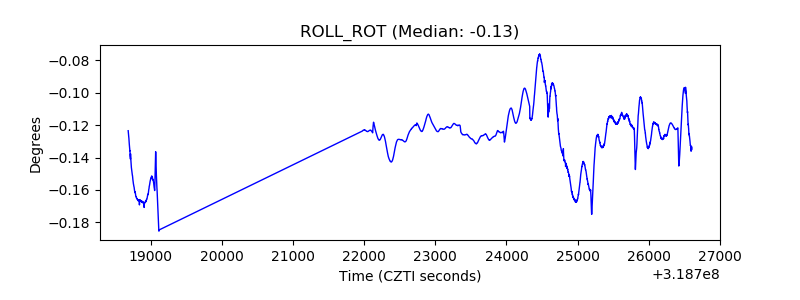 |
| _Roll_DEC | 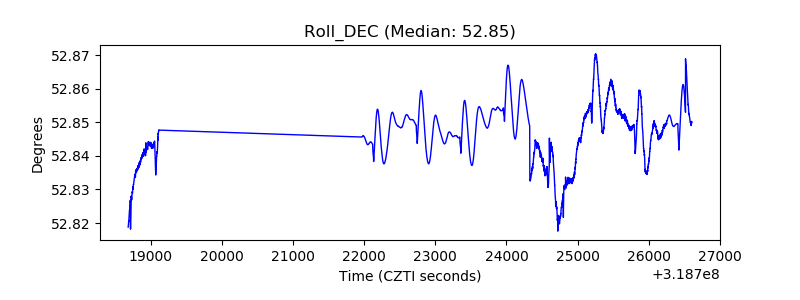 |
| _Roll_RA | 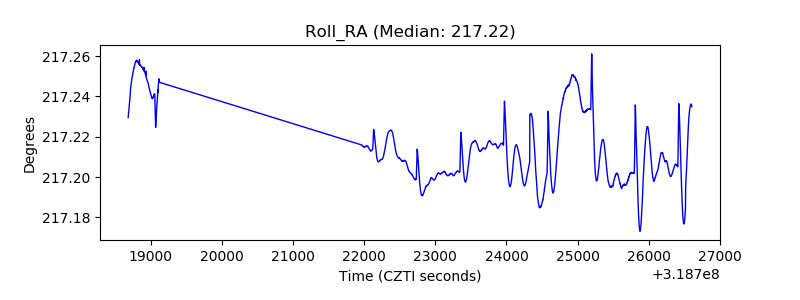 |
| Veto Counter | 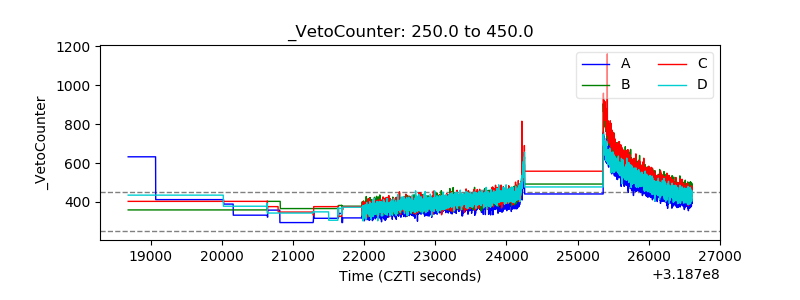 |