| Param | Original file | Final file |
|---|---|---|
| Filename | modeM0/AS1A07_011T01_9000003482_23578cztM0_level2.evt | modeM0/AS1A07_011T01_9000003482_23578cztM0_level2_quad_clean.evt |
| Size (bytes) | 440,449,920 | 104,840,640 |
| Size | 420.0 MB | 100.0 MB |
| Events in quadrant A | 3,012,288 | 695,401 |
| Events in quadrant B | 3,250,360 | 720,923 |
| Events in quadrant C | 3,354,397 | 669,029 |
| Events in quadrant D | 3,301,218 | 657,608 |
| Mode M9 | |||
|---|---|---|---|
| Quadrant | BADHDUFLAG | Total packets | Discarded packets |
| A | 0 | 16 | 0 |
| B | 0 | 17 | 0 |
| C | 0 | 17 | 0 |
| D | 0 | 17 | 0 |
| Mode SS | |||
|---|---|---|---|
| Quadrant | BADHDUFLAG | Total packets | Discarded packets |
| A | 0 | 126 | 0 |
| B | 0 | 126 | 0 |
| C | 0 | 126 | 0 |
| D | 0 | 126 | 0 |
| Mode M0 | |||
|---|---|---|---|
| Quadrant | BADHDUFLAG | Total packets | Discarded packets |
| A | 0 | 12887 | 2 |
| B | 0 | 13581 | 4 |
| C | 0 | 13863 | 2 |
| D | 0 | 14152 | 2 |
| Quadrant | Total seconds | Saturated seconds | Saturation percentage |
|---|---|---|---|
| A | 6192 | 28 | 0.452196% |
| B | 6191 | 56 | 0.904539% |
| C | 6192 | 189 | 3.052326% |
| D | 6192 | 45 | 0.726744% |
Noise dominated data is calculated using 1-second bins in cleaned event files. If a bin has >2000 counts, and if more than 50% of those come from <1% of pixels, then it is considered to be noise-dominated and hence unusable.
| Quadrant | # 1 sec bins | Bins with >0 counts | Bins with >2000 counts | High rate bins dominated by noise | Noise dominated (total time) | Noise dominated (detector-on time) | Marked lightcurve |
|---|---|---|---|---|---|---|---|
| A | 7497 | 6192 | 0 | 0 | 0.00% | 0.00% | 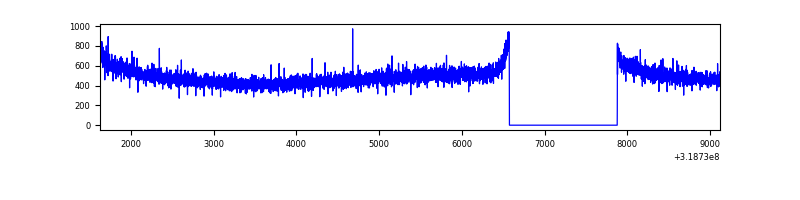 |
| B | 7497 | 6192 | 5 | 5 | 0.07% | 0.08% | 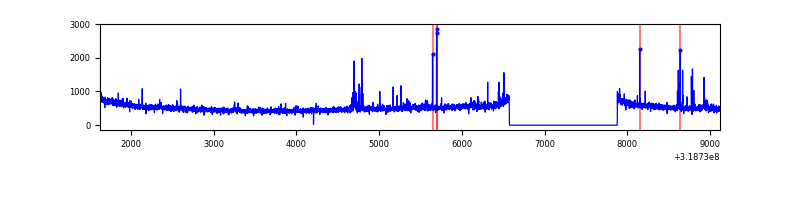 |
| C | 7497 | 6192 | 90 | 90 | 1.20% | 1.45% | 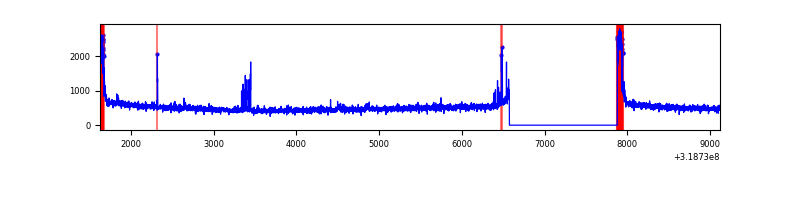 |
| D | 7497 | 6192 | 17 | 17 | 0.23% | 0.27% | 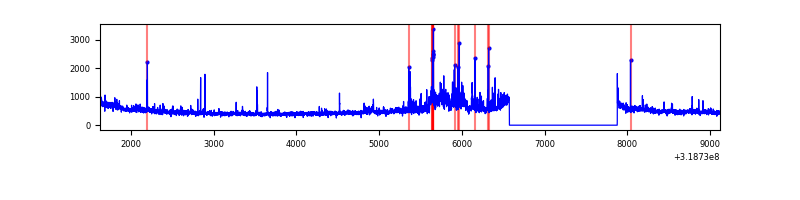 |
Top three noisy pixels from each quadrant. If the there are fewer than three noisy pixels in the level2.evt file, extra rows are filled as -1
| Pixel properties | Quadrant properties | ||||||
|---|---|---|---|---|---|---|---|
| Quadrant | DetID | PixID | Counts | Sigma | Mean | Median | Sigma |
| A | 13 | 254 | 10572 | 63.1 | 780 | 765 | 155.4 |
| A | 0 | 226 | 6797 | 38.81 | 780 | 765 | 155.4 |
| A | 3 | 137 | 6458 | 36.63 | 780 | 765 | 155.4 |
| B | 0 | 189 | 84015 | 573.48 | 788 | 770 | 145.2 |
| B | 0 | 229 | 25862 | 172.86 | 788 | 770 | 145.2 |
| B | 0 | 230 | 20713 | 137.39 | 788 | 770 | 145.2 |
| C | 0 | 10 | 264752 | 1556.93 | 741 | 748 | 169.6 |
| C | 14 | 238 | 121377 | 711.39 | 741 | 748 | 169.6 |
| C | 10 | 9 | 34083 | 196.59 | 741 | 748 | 169.6 |
| D | 9 | 85 | 182552 | 1002.94 | 750 | 728 | 181.3 |
| D | 1 | 52 | 139187 | 763.74 | 750 | 728 | 181.3 |
| D | 12 | 233 | 74872 | 408.98 | 750 | 728 | 181.3 |
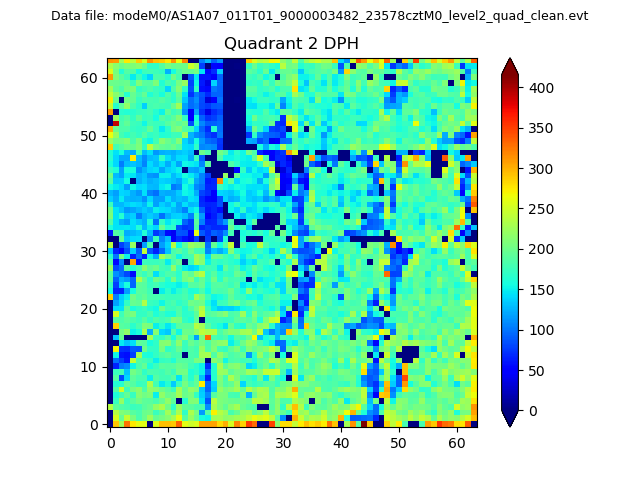
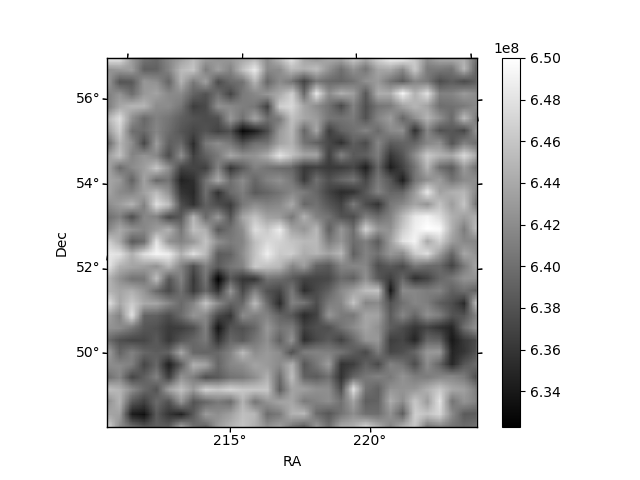
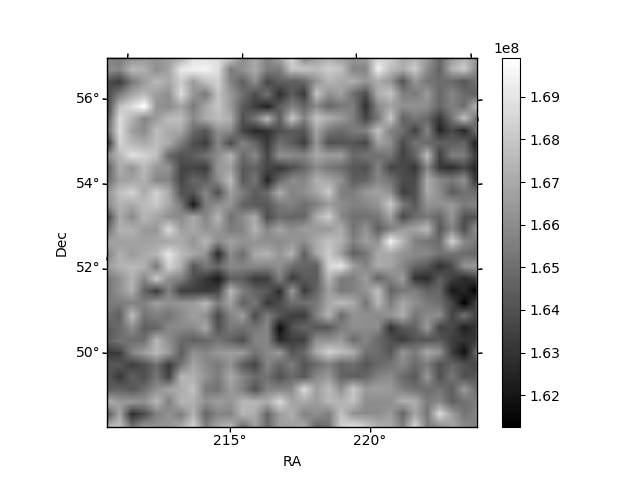
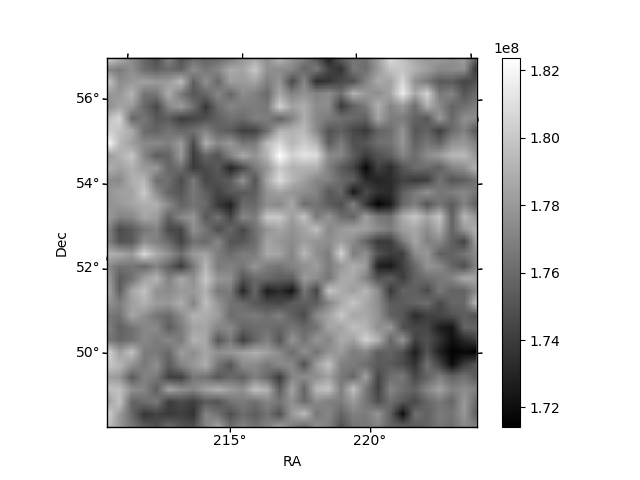
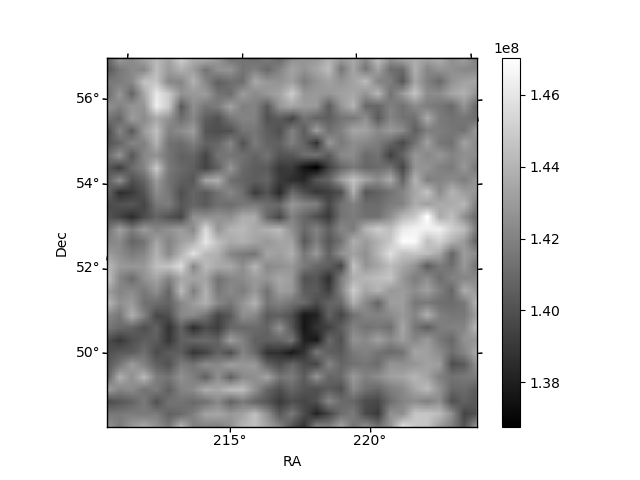
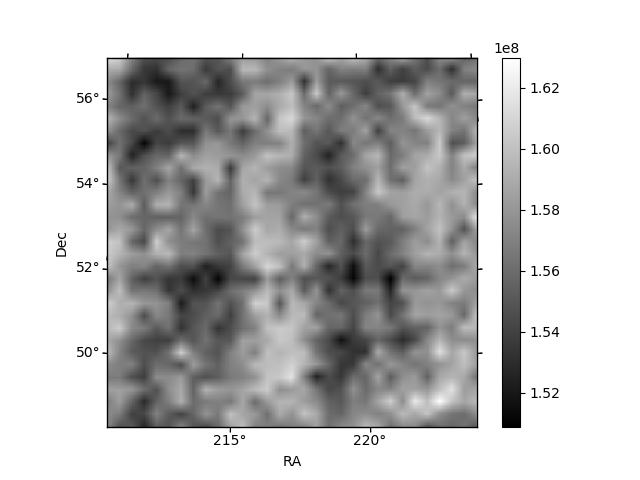
Histogram calculated using DETX and DETY for each event in the final _common_clean file
| Quadrant A | 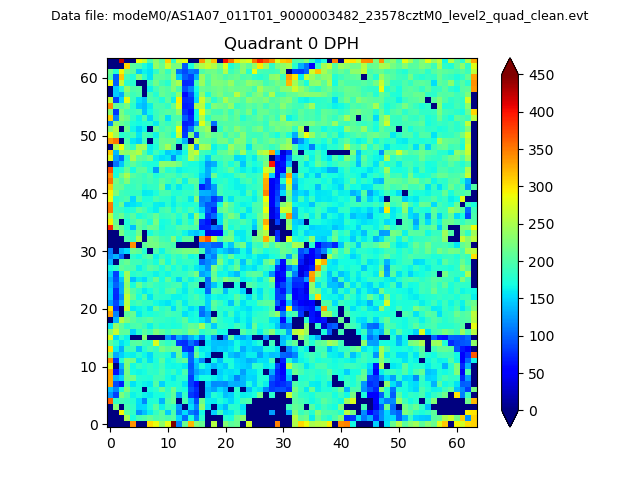 |
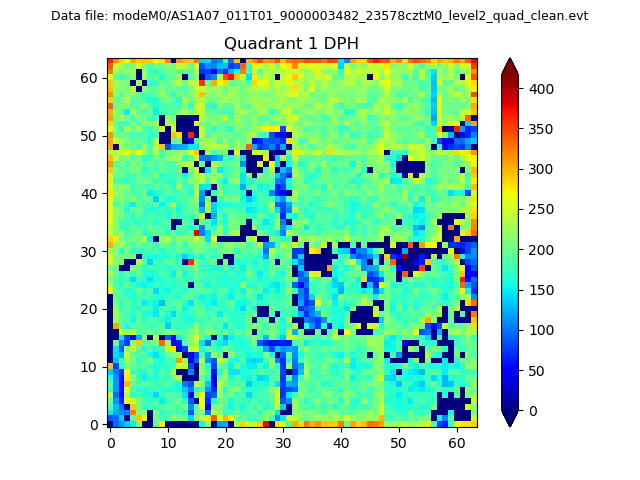 |
Quadrant B |
|---|---|---|---|
| Quadrant D | 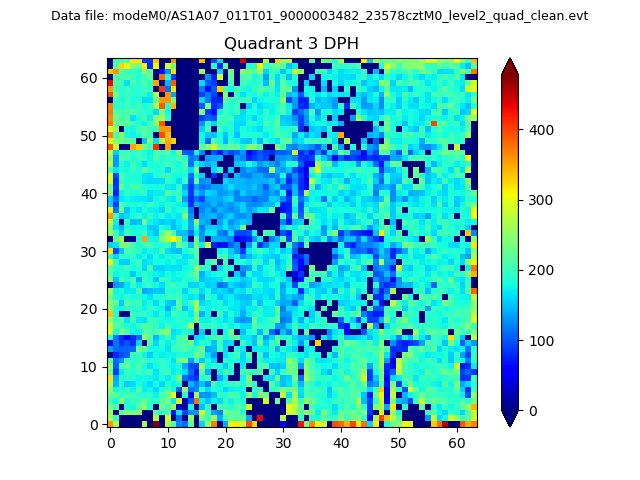 |
 |
Quadrant C |
| Plot type | Count rate plots | Images |
|---|---|---|
| Comparison with Poisson distribution Blue bars denote a histogram of data divided into 1 sec bins. Red curve is a Poisson curve with rate = median count rate of data. |
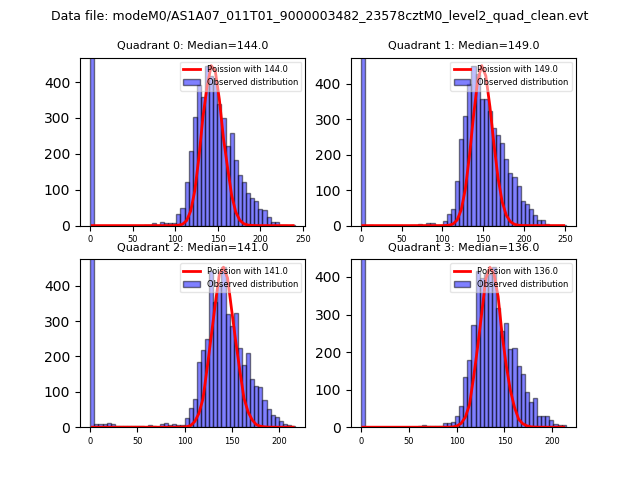 |
 |
| Quadrant-wise count rates Data is divided into 100 sec bins |
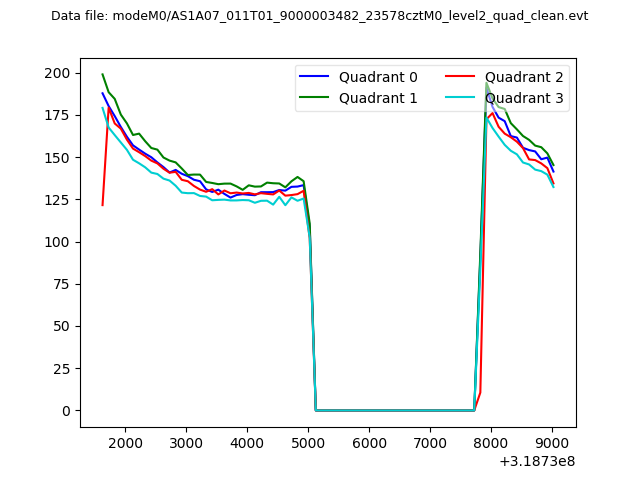 |
|
| Module-wise count rates for Quadrant A Data is divided into 100 sec bins |
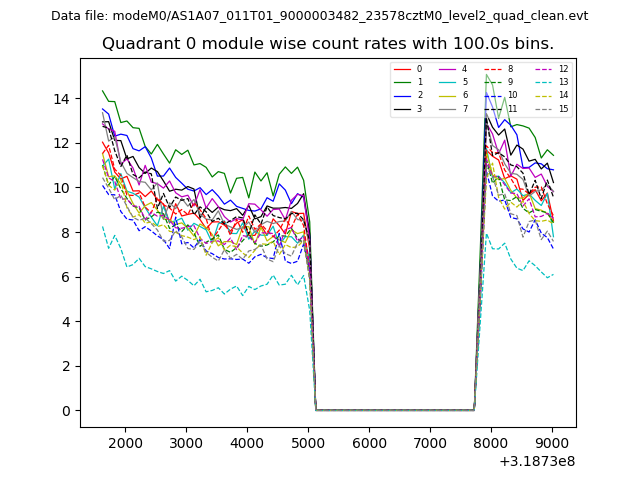 |
 |
| Module-wise count rates for Quadrant B Data is divided into 100 sec bins |
 |
 |
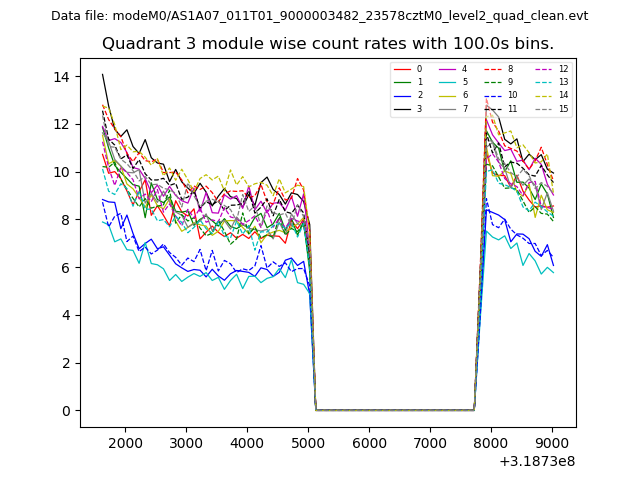
| Module-wise count rates for Quadrant C Data is divided into 100 sec bins |
 |
 |
| Module-wise count rates for Quadrant D Data is divided into 100 sec bins |
 |
 |
| Parameter | Plot |
|---|---|
| CZT HV Monitor |  |
| D_VDD | 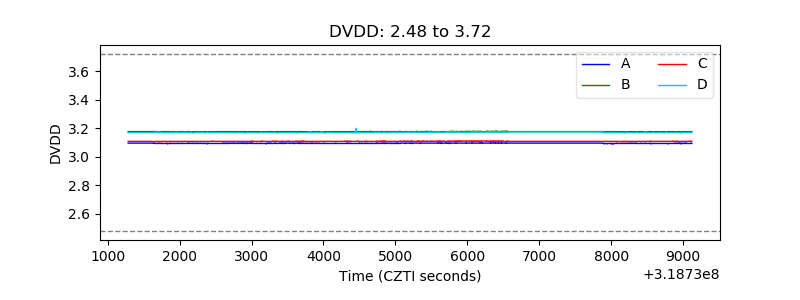 |
| Temperature 1 |  |
| Veto HV Monitor | 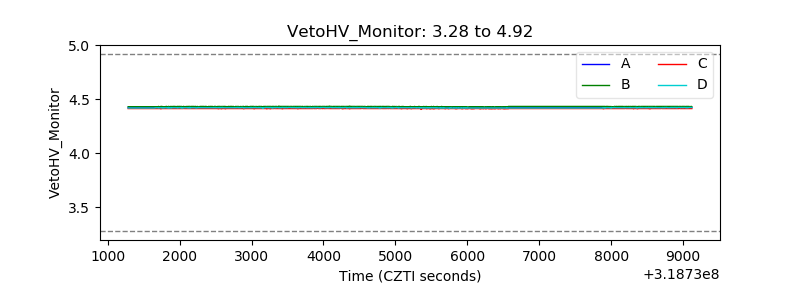 |
| Veto LLD | 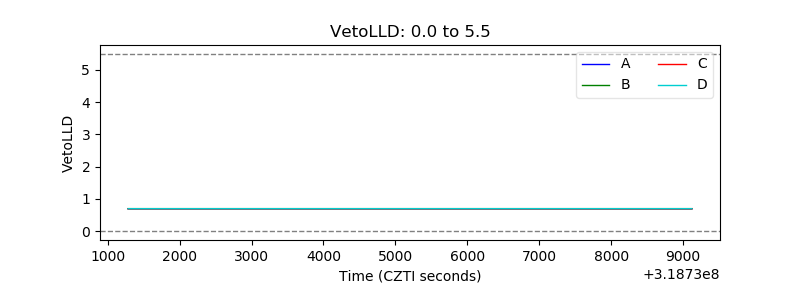 |
| Alpha Counter | 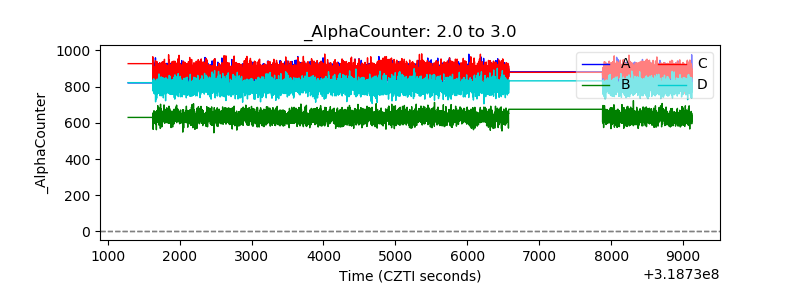 |
| _CPM_Rate | 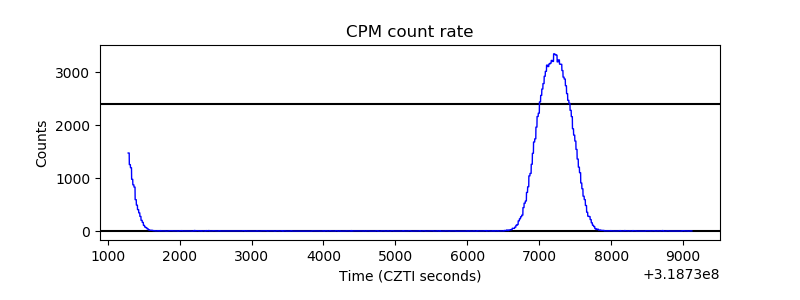 |
| CZT Counter | 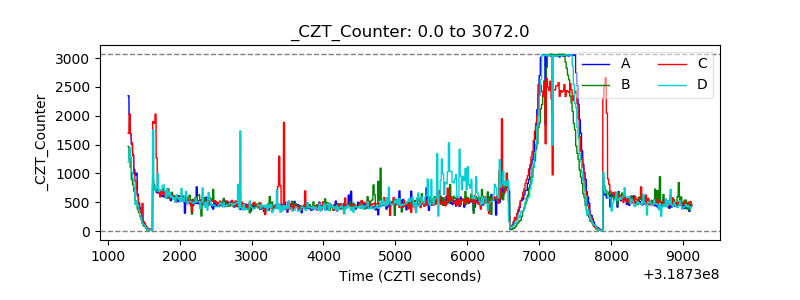 |
| +2.5 Volts monitor |  |
| +5 Volts monitor |  |
| _ROLL_ROT | 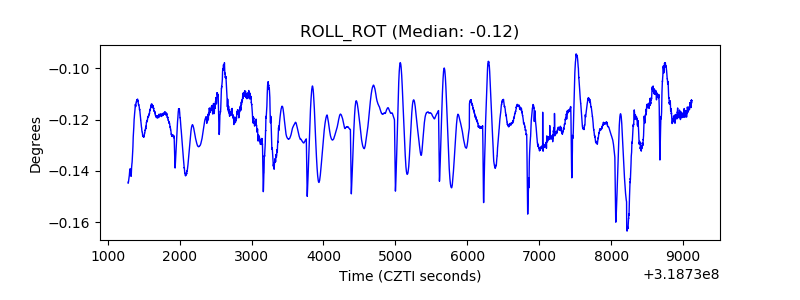 |
| _Roll_DEC | 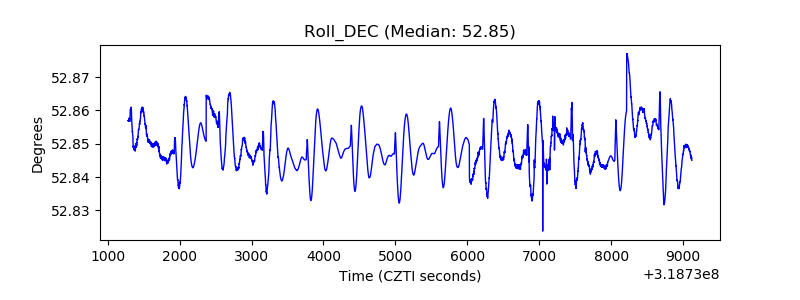 |
| _Roll_RA | 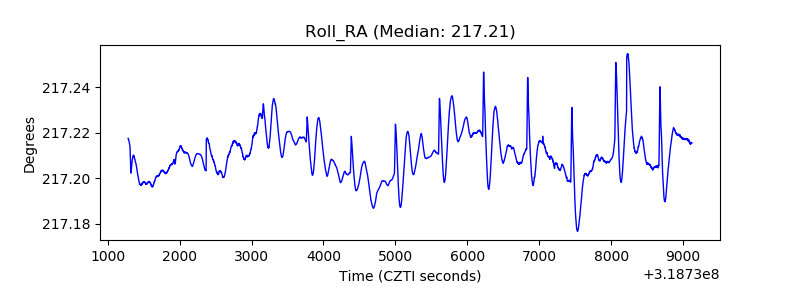 |
| Veto Counter | 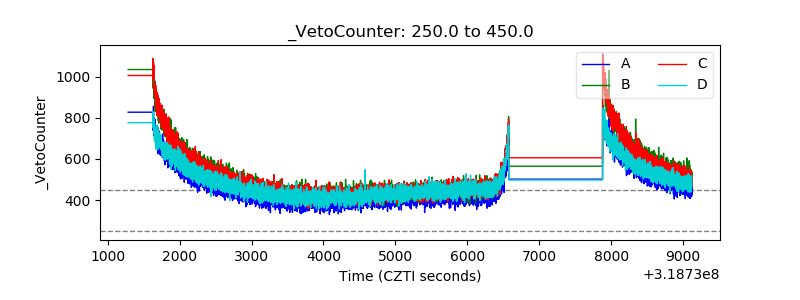 |