| Param | Original file | Final file |
|---|---|---|
| Filename | modeM0/AS1A07_011T01_9000003482_23579cztM0_level2.evt | modeM0/AS1A07_011T01_9000003482_23579cztM0_level2_quad_clean.evt |
| Size (bytes) | 464,679,360 | 105,966,720 |
| Size | 443.2 MB | 101.1 MB |
| Events in quadrant A | 3,180,284 | 703,055 |
| Events in quadrant B | 3,591,977 | 725,200 |
| Events in quadrant C | 3,443,079 | 668,086 |
| Events in quadrant D | 3,416,362 | 659,916 |
| Mode M9 | |||
|---|---|---|---|
| Quadrant | BADHDUFLAG | Total packets | Discarded packets |
| A | 0 | 15 | 0 |
| B | 0 | 16 | 0 |
| C | 0 | 16 | 0 |
| D | 0 | 16 | 0 |
| Mode SS | |||
|---|---|---|---|
| Quadrant | BADHDUFLAG | Total packets | Discarded packets |
| A | 0 | 132 | 0 |
| B | 0 | 132 | 0 |
| C | 0 | 132 | 0 |
| D | 0 | 132 | 0 |
| Mode M0 | |||
|---|---|---|---|
| Quadrant | BADHDUFLAG | Total packets | Discarded packets |
| A | 0 | 13425 | 2 |
| B | 0 | 14743 | 2 |
| C | 0 | 14211 | 2 |
| D | 0 | 14547 | 2 |
| Quadrant | Total seconds | Saturated seconds | Saturation percentage |
|---|---|---|---|
| A | 6494 | 17 | 0.261780% |
| B | 6494 | 110 | 1.693871% |
| C | 6494 | 168 | 2.587003% |
| D | 6494 | 22 | 0.338774% |
Noise dominated data is calculated using 1-second bins in cleaned event files. If a bin has >2000 counts, and if more than 50% of those come from <1% of pixels, then it is considered to be noise-dominated and hence unusable.
| Quadrant | # 1 sec bins | Bins with >0 counts | Bins with >2000 counts | High rate bins dominated by noise | Noise dominated (total time) | Noise dominated (detector-on time) | Marked lightcurve |
|---|---|---|---|---|---|---|---|
| A | 7854 | 6495 | 0 | 0 | 0.00% | 0.00% | 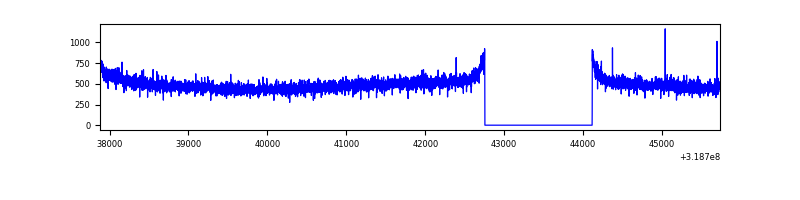 |
| B | 7854 | 6495 | 63 | 63 | 0.80% | 0.97% | 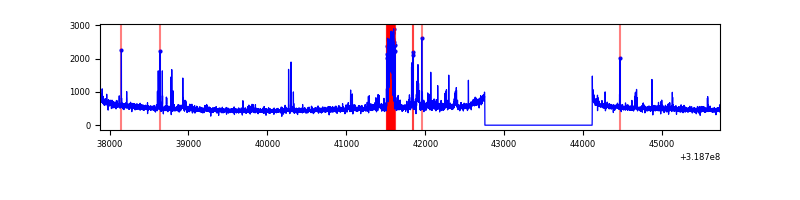 |
| C | 7854 | 6495 | 102 | 102 | 1.30% | 1.57% | 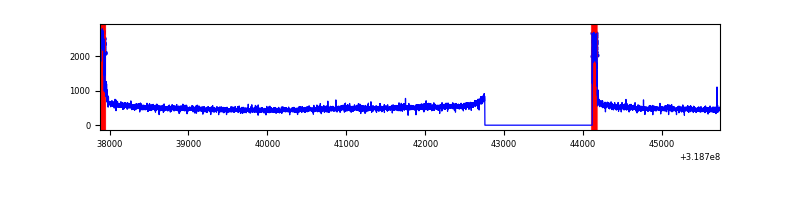 |
| D | 7854 | 6495 | 12 | 12 | 0.15% | 0.18% | 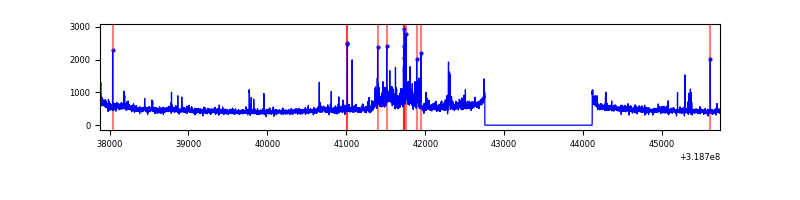 |
Top three noisy pixels from each quadrant. If the there are fewer than three noisy pixels in the level2.evt file, extra rows are filled as -1
| Pixel properties | Quadrant properties | ||||||
|---|---|---|---|---|---|---|---|
| Quadrant | DetID | PixID | Counts | Sigma | Mean | Median | Sigma |
| A | 13 | 254 | 11343 | 64.81 | 824 | 809 | 162.5 |
| A | 0 | 226 | 7076 | 38.56 | 824 | 809 | 162.5 |
| A | 3 | 137 | 6708 | 36.29 | 824 | 809 | 162.5 |
| B | 14 | 207 | 161988 | 1066.49 | 822 | 805 | 151.1 |
| B | 0 | 189 | 69775 | 456.35 | 822 | 805 | 151.1 |
| B | 3 | 64 | 50375 | 327.99 | 822 | 805 | 151.1 |
| C | 0 | 10 | 284995 | 1609.32 | 774 | 781 | 176.6 |
| C | 14 | 238 | 126571 | 712.27 | 774 | 781 | 176.6 |
| C | 1 | 16 | 13627 | 72.74 | 774 | 781 | 176.6 |
| D | 9 | 85 | 184105 | 966.89 | 788 | 765 | 189.6 |
| D | 1 | 52 | 86358 | 451.4 | 788 | 765 | 189.6 |
| D | 7 | 223 | 70339 | 366.92 | 788 | 765 | 189.6 |
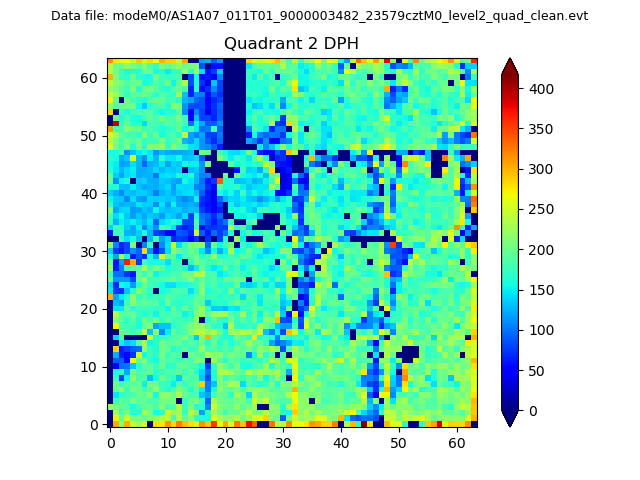
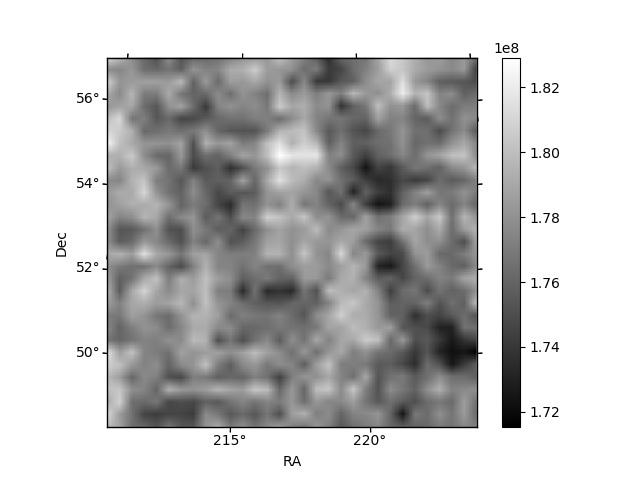
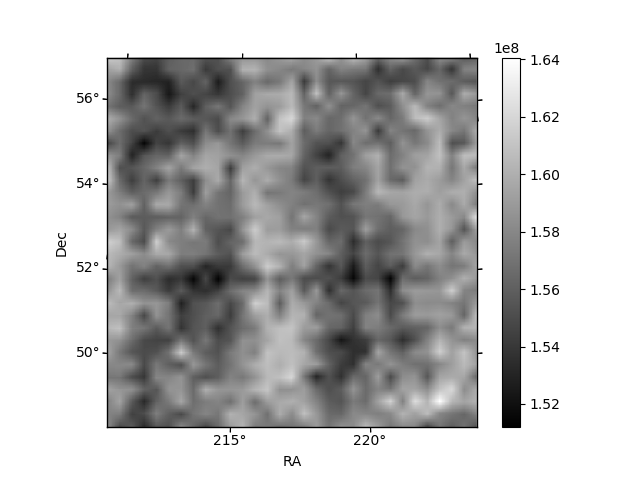
Histogram calculated using DETX and DETY for each event in the final _common_clean file
| Quadrant A | 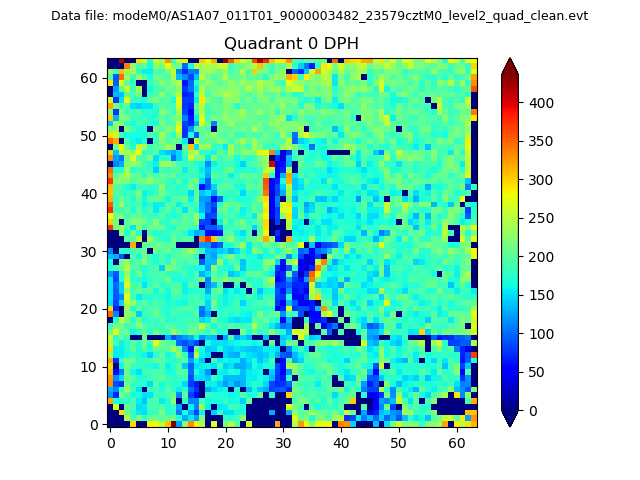 |
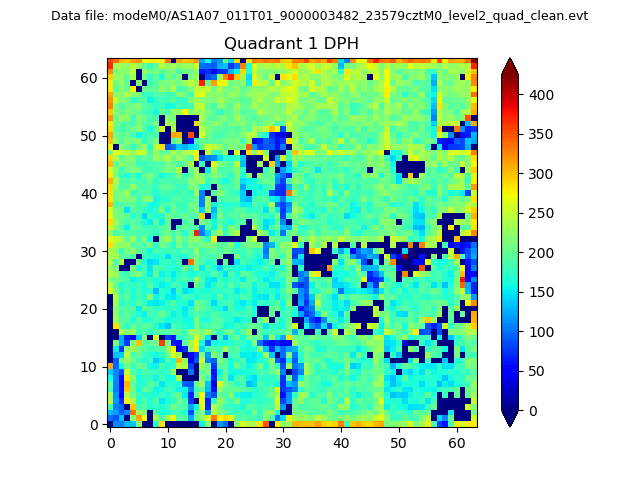 |
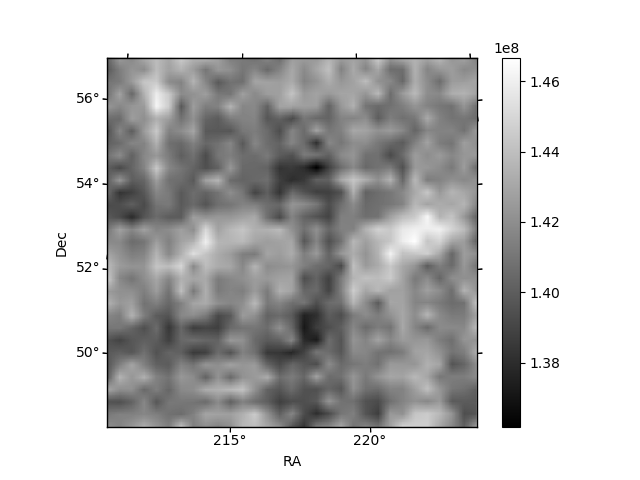
Quadrant B |
|---|---|---|---|
| Quadrant D | 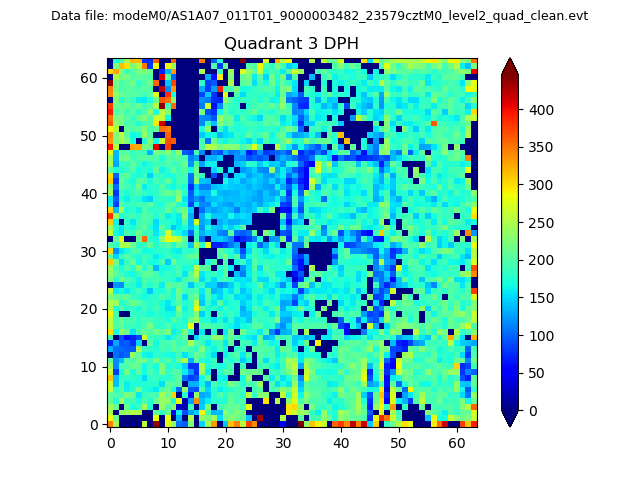 |
 |
Quadrant C |
| Plot type | Count rate plots | Images |
|---|---|---|
| Comparison with Poisson distribution Blue bars denote a histogram of data divided into 1 sec bins. Red curve is a Poisson curve with rate = median count rate of data. |
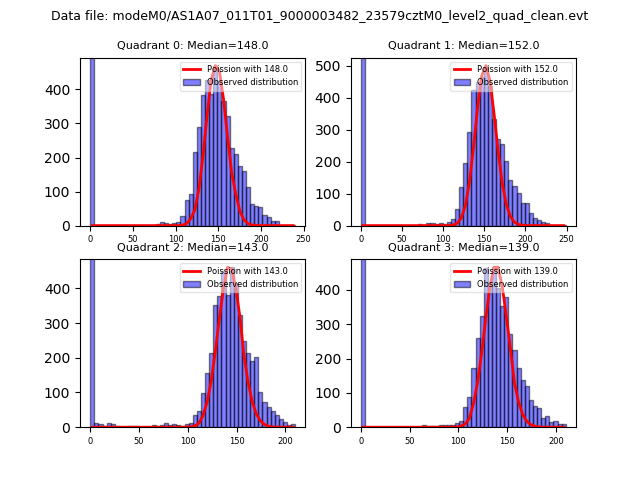 |
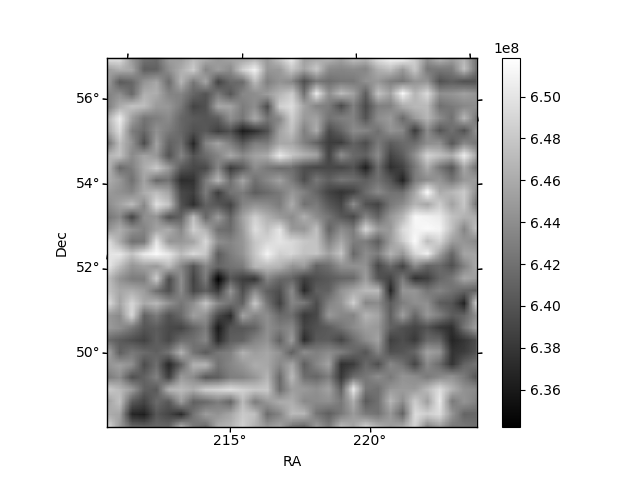 |
| Quadrant-wise count rates Data is divided into 100 sec bins |
 |
|
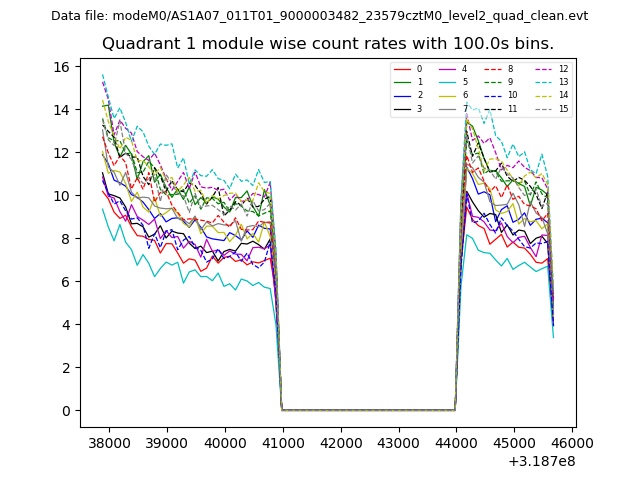
| Module-wise count rates for Quadrant A Data is divided into 100 sec bins |
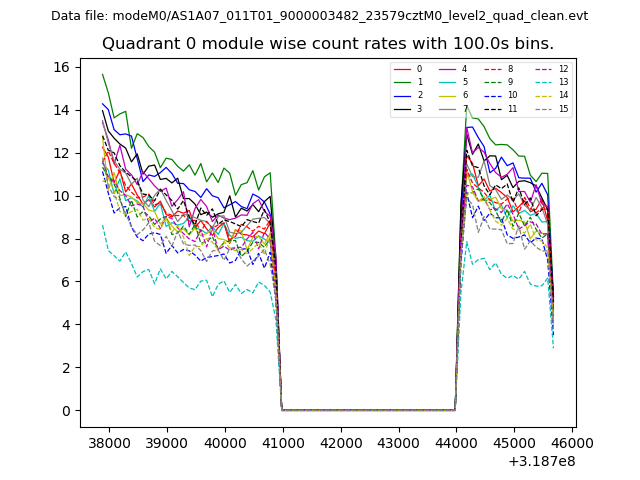 |
 |
| Module-wise count rates for Quadrant B Data is divided into 100 sec bins |
 |
 |
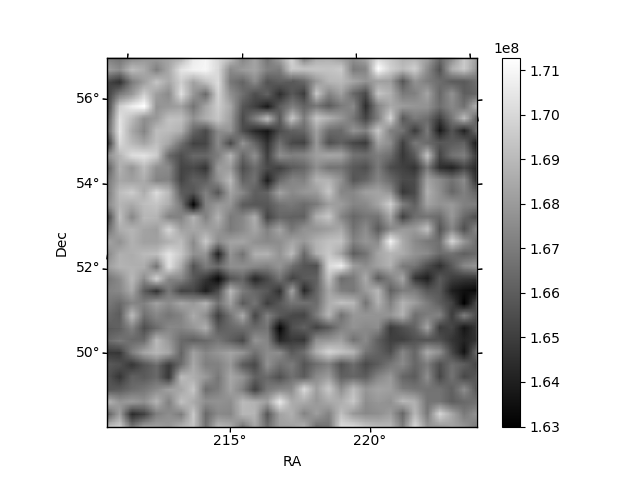
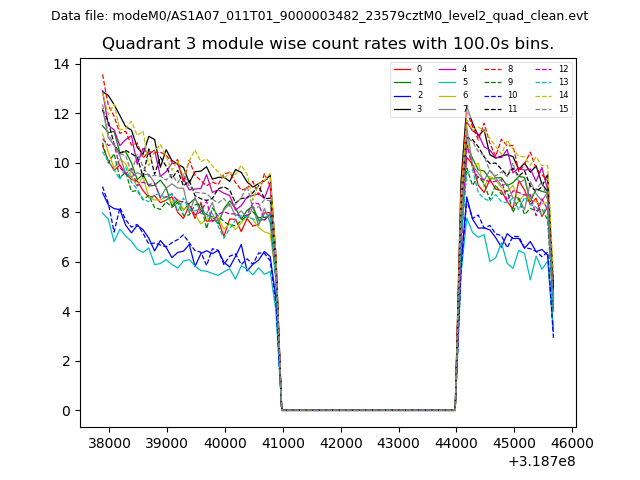
| Module-wise count rates for Quadrant C Data is divided into 100 sec bins |
 |
 |
| Module-wise count rates for Quadrant D Data is divided into 100 sec bins |
 |
 |
| Parameter | Plot |
|---|---|
| CZT HV Monitor | 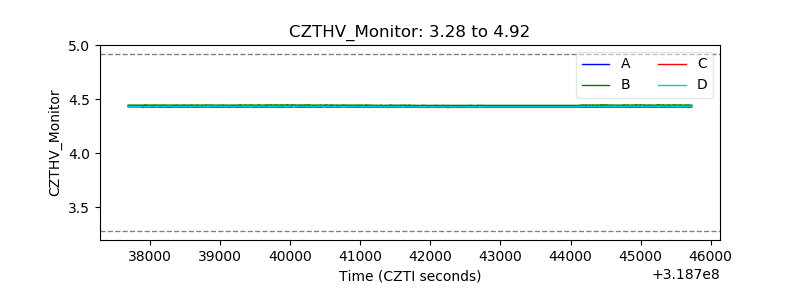 |
| D_VDD | 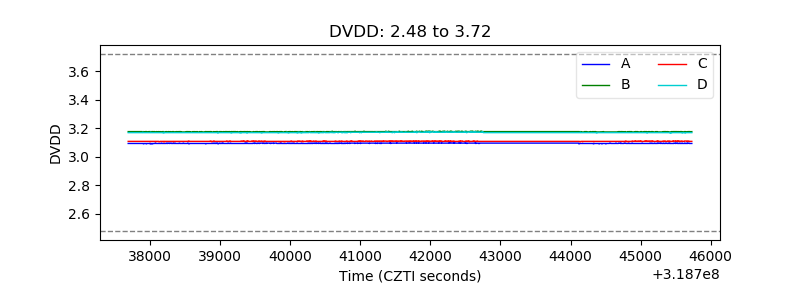 |
| Temperature 1 | 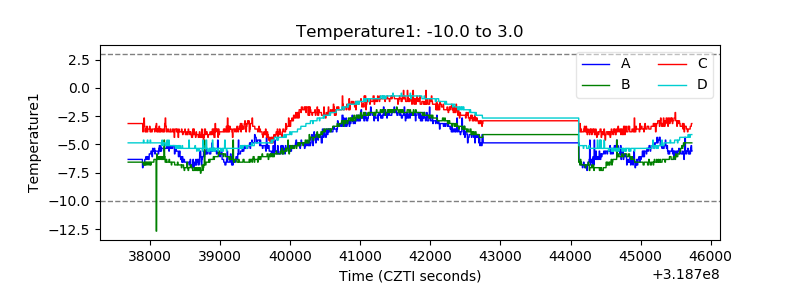 |
| Veto HV Monitor | 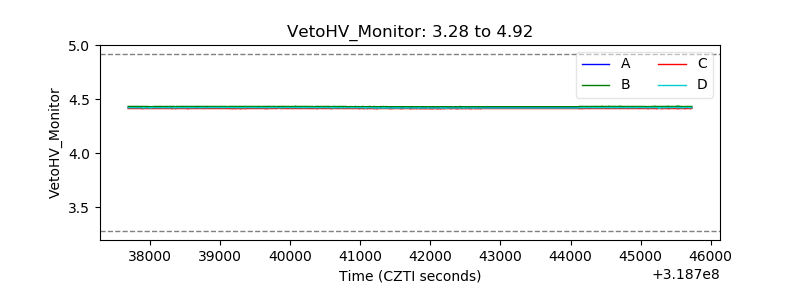 |
| Veto LLD |  |
| Alpha Counter | 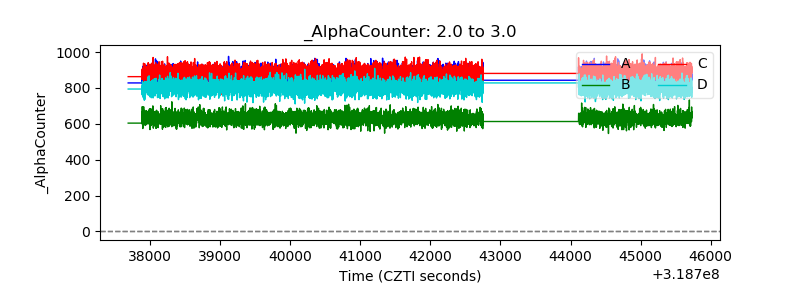 |
| _CPM_Rate | 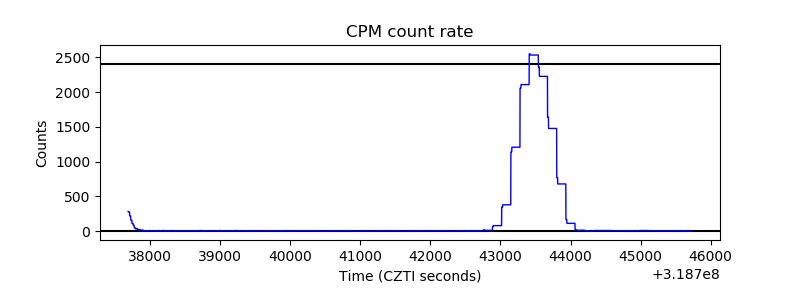 |
| CZT Counter | 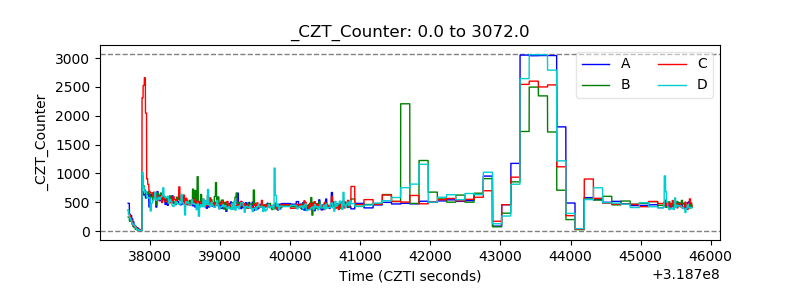 |
| +2.5 Volts monitor | 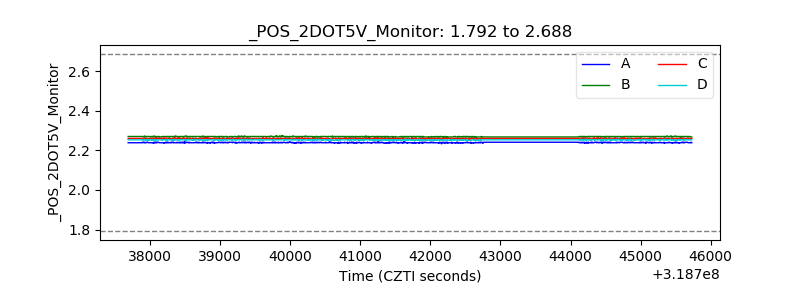 |
| +5 Volts monitor |  |
| _ROLL_ROT | 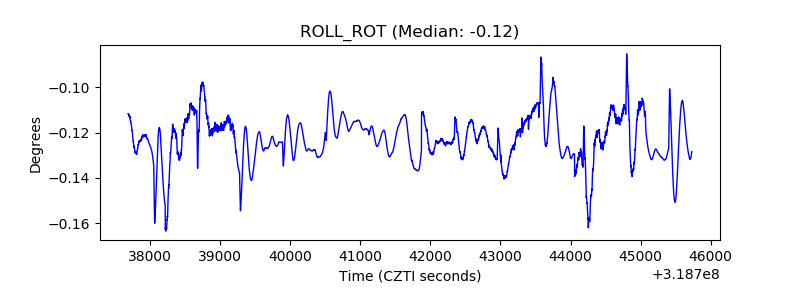 |
| _Roll_DEC | 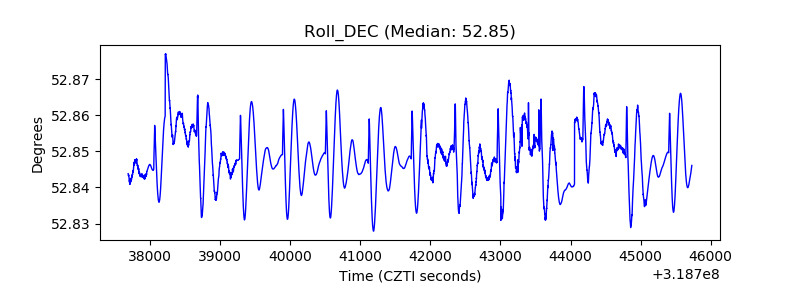 |
| _Roll_RA | 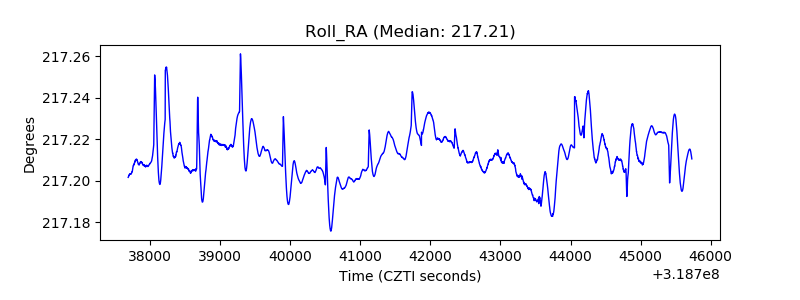 |
| Veto Counter | 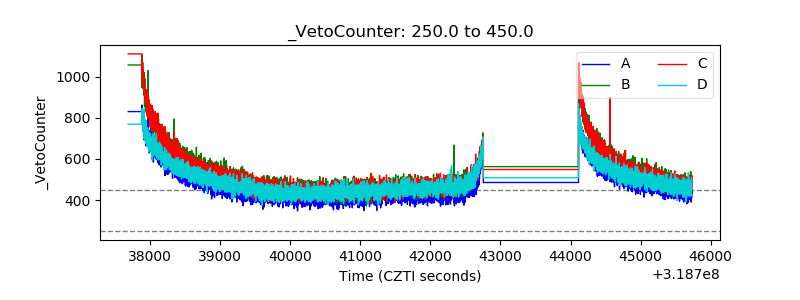 |