| Param | Original file | Final file |
|---|---|---|
| Filename | modeM0/AS1A07_011T01_9000003482_23580cztM0_level2.evt | modeM0/AS1A07_011T01_9000003482_23580cztM0_level2_quad_clean.evt |
| Size (bytes) | 466,925,760 | 102,320,640 |
| Size | 445.3 MB | 97.6 MB |
| Events in quadrant A | 3,194,568 | 680,353 |
| Events in quadrant B | 3,508,509 | 692,660 |
| Events in quadrant C | 3,548,625 | 635,782 |
| Events in quadrant D | 3,448,950 | 638,060 |
| Mode M9 | |||
|---|---|---|---|
| Quadrant | BADHDUFLAG | Total packets | Discarded packets |
| A | 0 | 15 | 0 |
| B | 0 | 15 | 0 |
| C | 0 | 16 | 0 |
| D | 0 | 16 | 0 |
| Mode SS | |||
|---|---|---|---|
| Quadrant | BADHDUFLAG | Total packets | Discarded packets |
| A | 0 | 130 | 0 |
| B | 0 | 130 | 0 |
| C | 0 | 130 | 0 |
| D | 0 | 130 | 0 |
| Mode M0 | |||
|---|---|---|---|
| Quadrant | BADHDUFLAG | Total packets | Discarded packets |
| A | 0 | 13422 | 2 |
| B | 0 | 14428 | 2 |
| C | 0 | 14533 | 2 |
| D | 0 | 14612 | 2 |
| Quadrant | Total seconds | Saturated seconds | Saturation percentage |
|---|---|---|---|
| A | 6484 | 63 | 0.971622% |
| B | 6483 | 116 | 1.789295% |
| C | 6484 | 234 | 3.608883% |
| D | 6484 | 54 | 0.832819% |
Noise dominated data is calculated using 1-second bins in cleaned event files. If a bin has >2000 counts, and if more than 50% of those come from <1% of pixels, then it is considered to be noise-dominated and hence unusable.
| Quadrant | # 1 sec bins | Bins with >0 counts | Bins with >2000 counts | High rate bins dominated by noise | Noise dominated (total time) | Noise dominated (detector-on time) | Marked lightcurve |
|---|---|---|---|---|---|---|---|
| A | 7754 | 6484 | 0 | 0 | 0.00% | 0.00% | 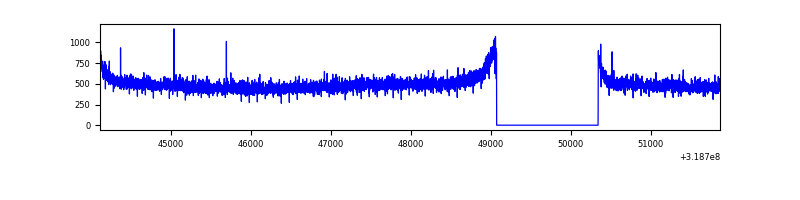 |
| B | 7754 | 6484 | 10 | 10 | 0.13% | 0.15% | 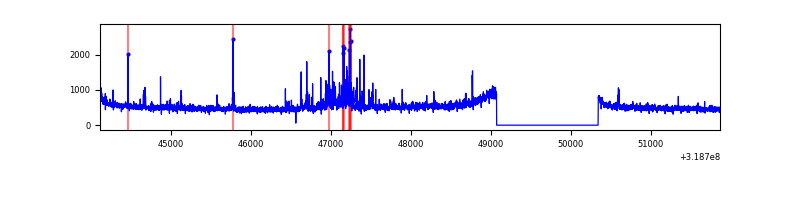 |
| C | 7754 | 6485 | 128 | 128 | 1.65% | 1.97% | 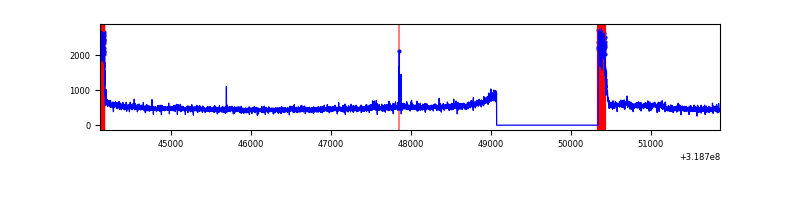 |
| D | 7754 | 6484 | 16 | 16 | 0.21% | 0.25% | 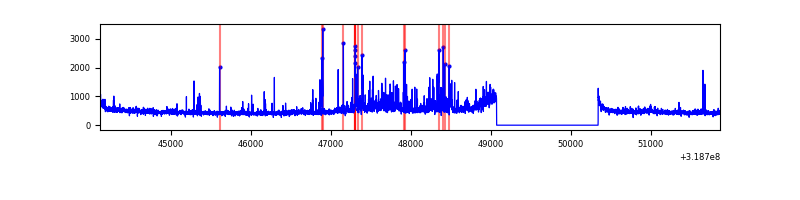 |
Top three noisy pixels from each quadrant. If the there are fewer than three noisy pixels in the level2.evt file, extra rows are filled as -1
| Pixel properties | Quadrant properties | ||||||
|---|---|---|---|---|---|---|---|
| Quadrant | DetID | PixID | Counts | Sigma | Mean | Median | Sigma |
| A | 13 | 254 | 11603 | 66.0 | 828 | 813 | 163.5 |
| A | 0 | 226 | 7149 | 38.76 | 828 | 813 | 163.5 |
| A | 3 | 137 | 6697 | 35.99 | 828 | 813 | 163.5 |
| B | 0 | 189 | 121771 | 796.18 | 820 | 802 | 151.9 |
| B | 14 | 207 | 58520 | 379.88 | 820 | 802 | 151.9 |
| B | 0 | 230 | 49483 | 320.4 | 820 | 802 | 151.9 |
| C | 0 | 10 | 401283 | 2283.16 | 765 | 771 | 175.4 |
| C | 14 | 238 | 126709 | 717.92 | 765 | 771 | 175.4 |
| C | 10 | 9 | 18995 | 103.89 | 765 | 771 | 175.4 |
| D | 1 | 52 | 196205 | 1025.49 | 791 | 766 | 190.6 |
| D | 9 | 85 | 123459 | 643.78 | 791 | 766 | 190.6 |
| D | 7 | 223 | 41180 | 212.06 | 791 | 766 | 190.6 |
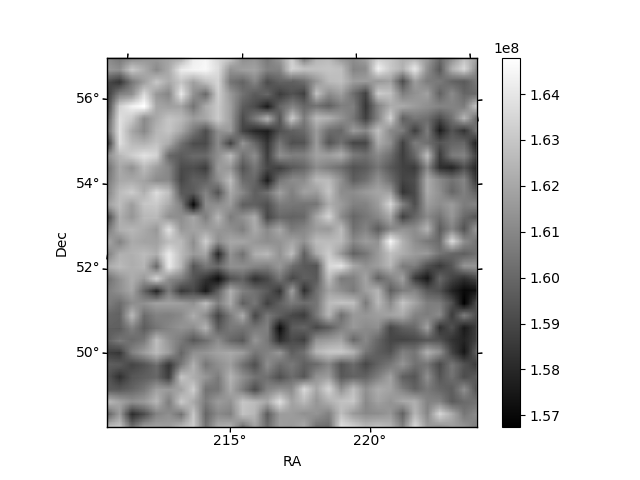
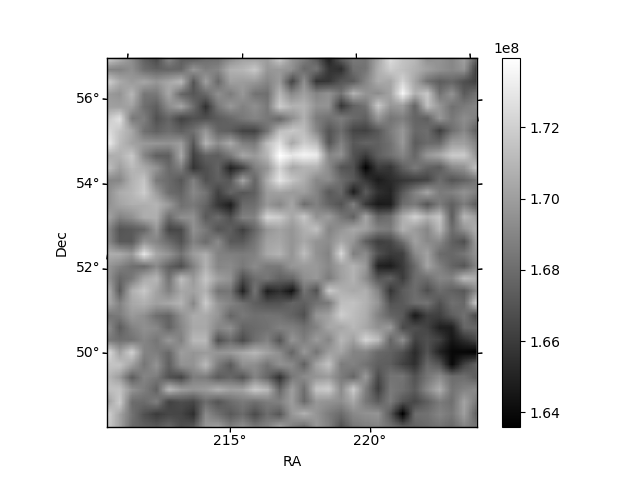
Histogram calculated using DETX and DETY for each event in the final _common_clean file
| Quadrant A | 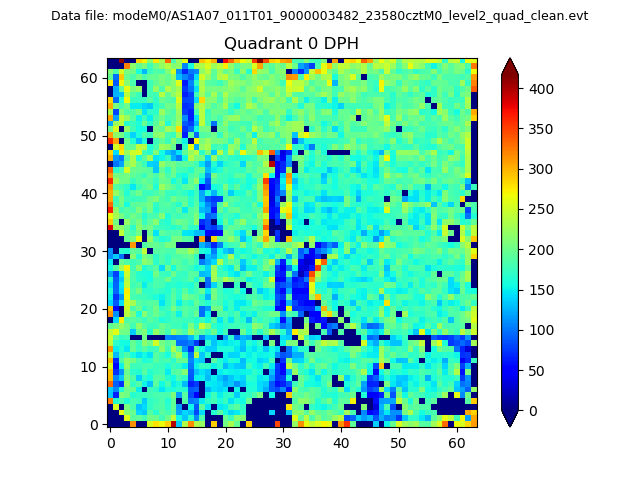 |
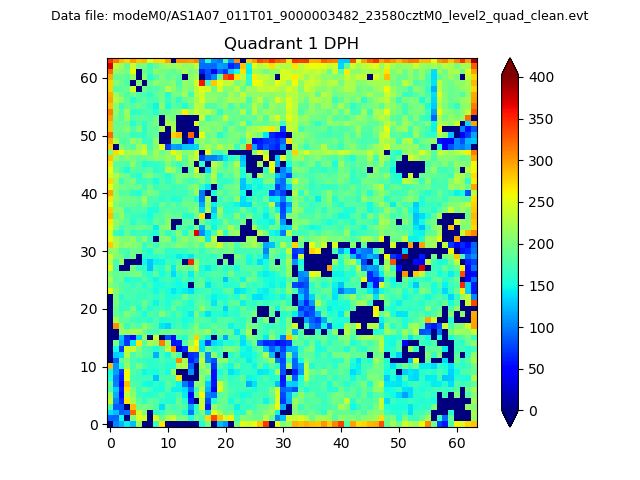 |
Quadrant B |
|---|---|---|---|
| Quadrant D | 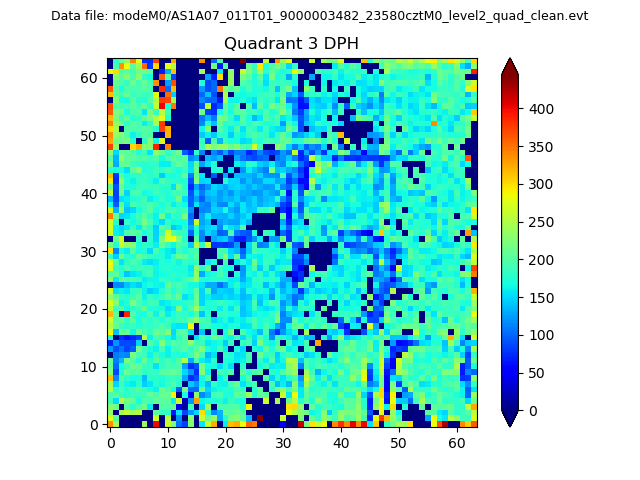 |
 |
Quadrant C |
| Plot type | Count rate plots | Images |
|---|---|---|
| Comparison with Poisson distribution Blue bars denote a histogram of data divided into 1 sec bins. Red curve is a Poisson curve with rate = median count rate of data. |
 |
 |
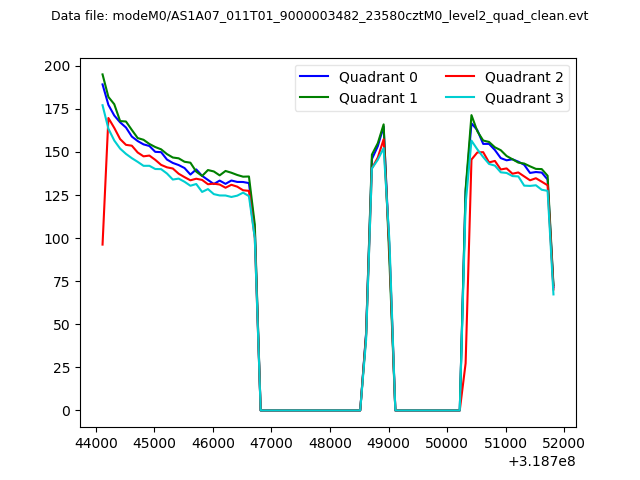
| Quadrant-wise count rates Data is divided into 100 sec bins |
 |
|
| Module-wise count rates for Quadrant A Data is divided into 100 sec bins |
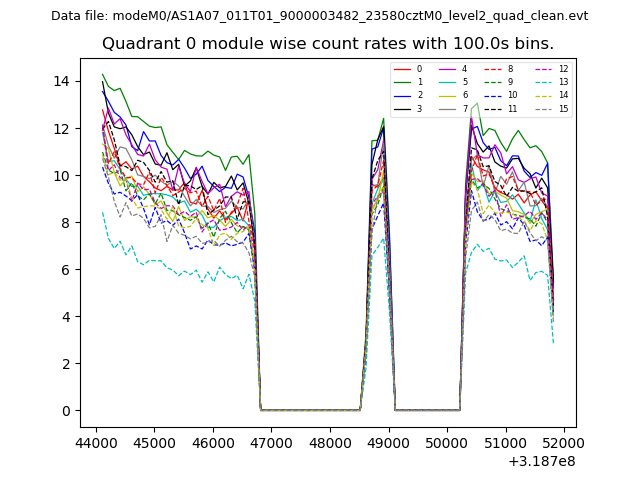 |
 |
| Module-wise count rates for Quadrant B Data is divided into 100 sec bins |
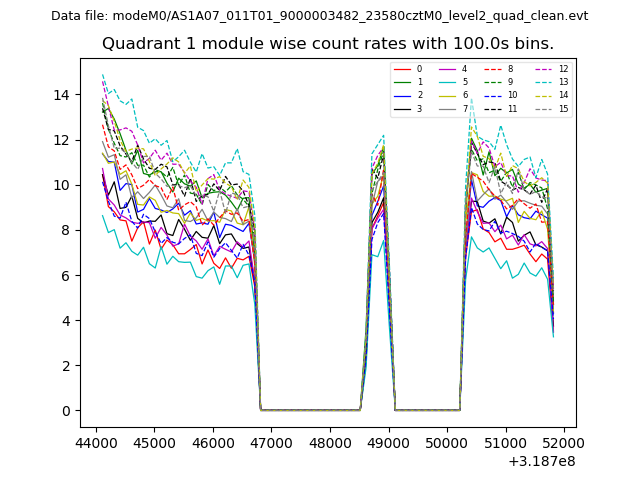 |
 |
| Module-wise count rates for Quadrant C Data is divided into 100 sec bins |
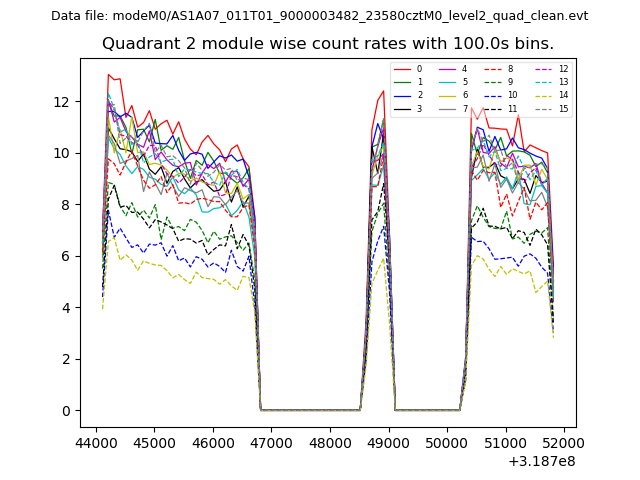 |
 |
| Module-wise count rates for Quadrant D Data is divided into 100 sec bins |
 |
 |
| Parameter | Plot |
|---|---|
| CZT HV Monitor | 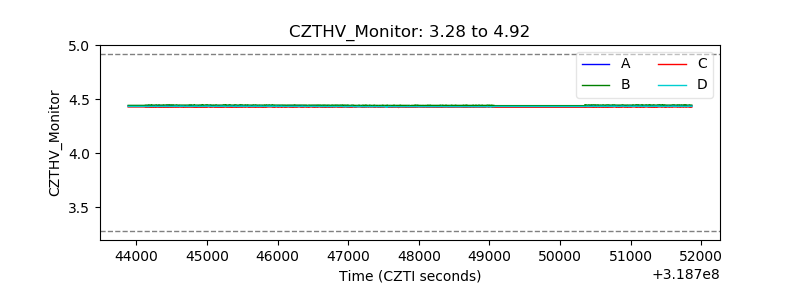 |
| D_VDD | 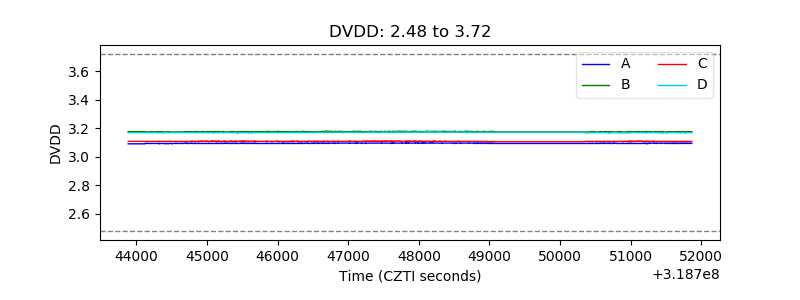 |
| Temperature 1 | 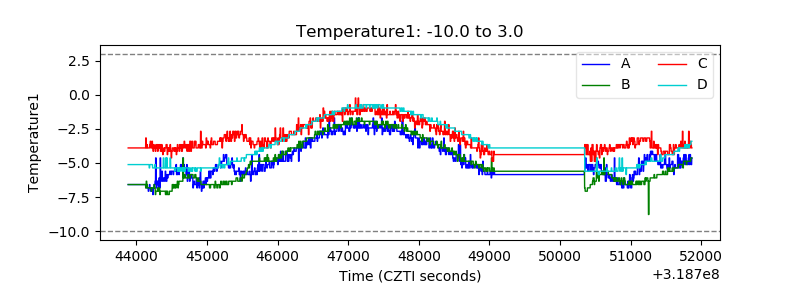 |
| Veto HV Monitor | 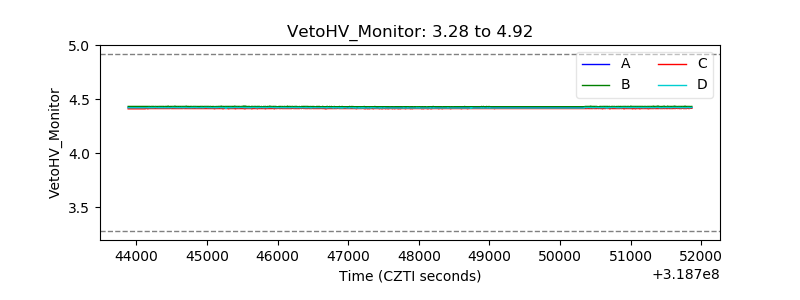 |
| Veto LLD | 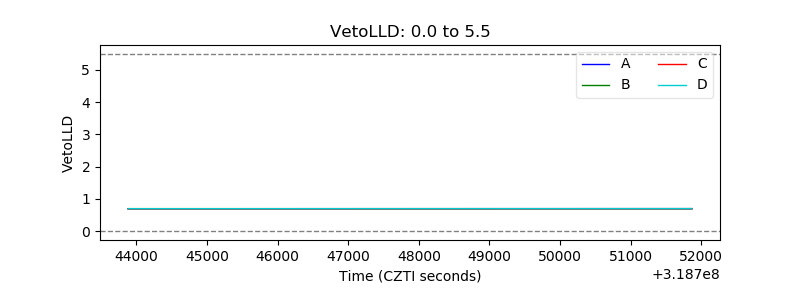 |
| Alpha Counter | 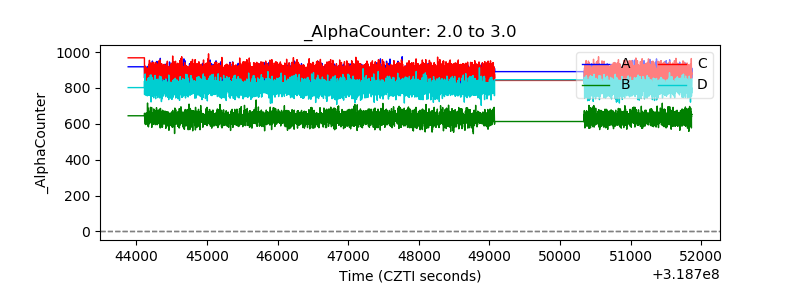 |
| _CPM_Rate | 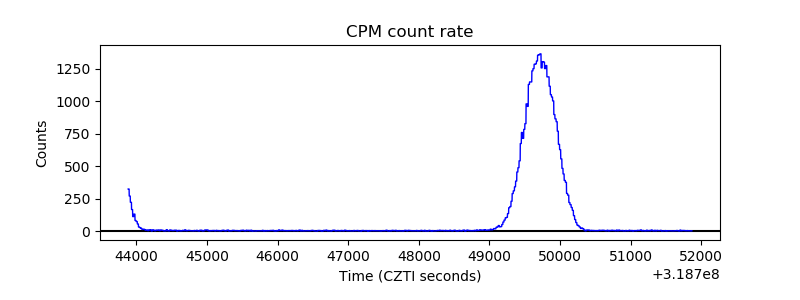 |
| CZT Counter |  |
| +2.5 Volts monitor |  |
| +5 Volts monitor |  |
| _ROLL_ROT |  |
| _Roll_DEC |  |
| _Roll_RA |  |
| Veto Counter | 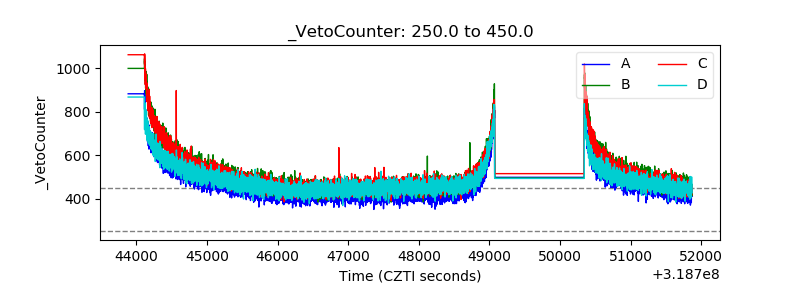 |