| Param | Original file | Final file |
|---|---|---|
| Filename | modeM0/AS1A07_011T01_9000003482_23581cztM0_level2.evt | modeM0/AS1A07_011T01_9000003482_23581cztM0_level2_quad_clean.evt |
| Size (bytes) | 520,473,600 | 99,835,200 |
| Size | 496.4 MB | 95.2 MB |
| Events in quadrant A | 3,176,422 | 659,431 |
| Events in quadrant B | 3,401,662 | 669,563 |
| Events in quadrant C | 3,541,527 | 624,754 |
| Events in quadrant D | 5,195,342 | 609,687 |
| Mode M9 | |||
|---|---|---|---|
| Quadrant | BADHDUFLAG | Total packets | Discarded packets |
| A | 0 | 14 | 0 |
| B | 0 | 14 | 0 |
| C | 0 | 15 | 0 |
| D | 0 | 15 | 0 |
| Mode SS | |||
|---|---|---|---|
| Quadrant | BADHDUFLAG | Total packets | Discarded packets |
| A | 0 | 134 | 0 |
| B | 0 | 134 | 0 |
| C | 0 | 134 | 0 |
| D | 0 | 134 | 0 |
| Mode M0 | |||
|---|---|---|---|
| Quadrant | BADHDUFLAG | Total packets | Discarded packets |
| A | 0 | 13526 | 2 |
| B | 0 | 14185 | 2 |
| C | 0 | 14560 | 2 |
| D | 0 | 19884 | 2 |
| Quadrant | Total seconds | Saturated seconds | Saturation percentage |
|---|---|---|---|
| A | 6597 | 50 | 0.757920% |
| B | 6597 | 61 | 0.924663% |
| C | 6597 | 165 | 2.501137% |
| D | 6597 | 549 | 8.321965% |
Noise dominated data is calculated using 1-second bins in cleaned event files. If a bin has >2000 counts, and if more than 50% of those come from <1% of pixels, then it is considered to be noise-dominated and hence unusable.
| Quadrant | # 1 sec bins | Bins with >0 counts | Bins with >2000 counts | High rate bins dominated by noise | Noise dominated (total time) | Noise dominated (detector-on time) | Marked lightcurve |
|---|---|---|---|---|---|---|---|
| A | 7742 | 6597 | 0 | 0 | 0.00% | 0.00% | 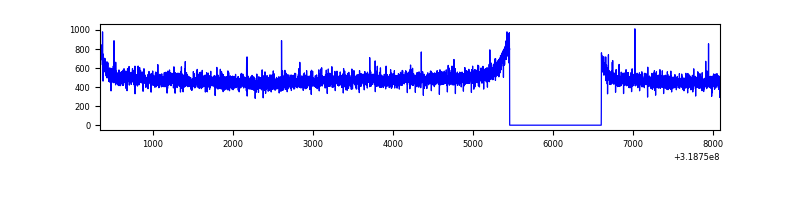 |
| B | 7742 | 6598 | 5 | 5 | 0.06% | 0.08% | 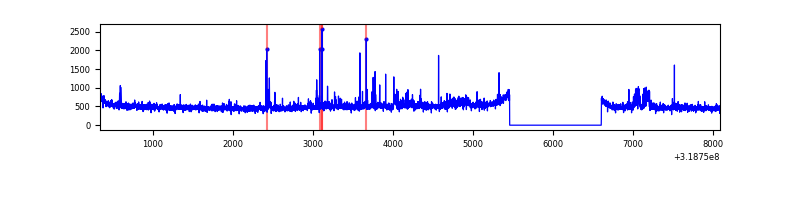 |
| C | 7742 | 6598 | 94 | 94 | 1.21% | 1.42% | 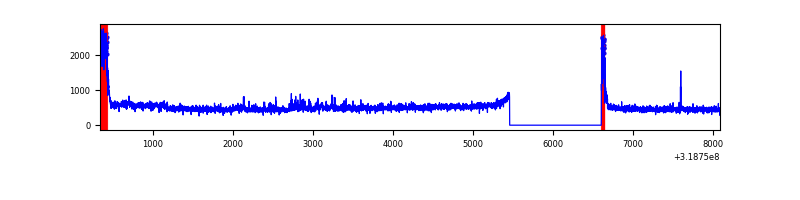 |
| D | 7742 | 6597 | 453 | 453 | 5.85% | 6.87% | 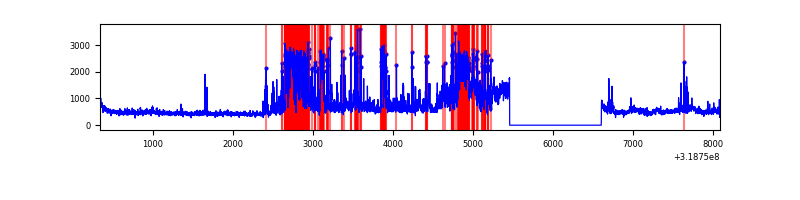 |
Top three noisy pixels from each quadrant. If the there are fewer than three noisy pixels in the level2.evt file, extra rows are filled as -1
| Pixel properties | Quadrant properties | ||||||
|---|---|---|---|---|---|---|---|
| Quadrant | DetID | PixID | Counts | Sigma | Mean | Median | Sigma |
| A | 13 | 254 | 11695 | 66.71 | 822 | 807 | 163.2 |
| A | 0 | 226 | 7128 | 38.73 | 822 | 807 | 163.2 |
| A | 3 | 137 | 6890 | 37.27 | 822 | 807 | 163.2 |
| B | 0 | 189 | 107366 | 694.2 | 813 | 794 | 153.5 |
| B | 0 | 230 | 43341 | 277.15 | 813 | 794 | 153.5 |
| B | 12 | 111 | 18211 | 113.45 | 813 | 794 | 153.5 |
| C | 0 | 10 | 393873 | 2245.78 | 763 | 768 | 175.0 |
| C | 14 | 238 | 124414 | 706.38 | 763 | 768 | 175.0 |
| C | 10 | 9 | 39347 | 220.4 | 763 | 768 | 175.0 |
| D | 12 | 233 | 908275 | 4858.28 | 766 | 741 | 186.8 |
| D | 1 | 52 | 800965 | 4283.82 | 766 | 741 | 186.8 |
| D | 7 | 223 | 325318 | 1737.55 | 766 | 741 | 186.8 |
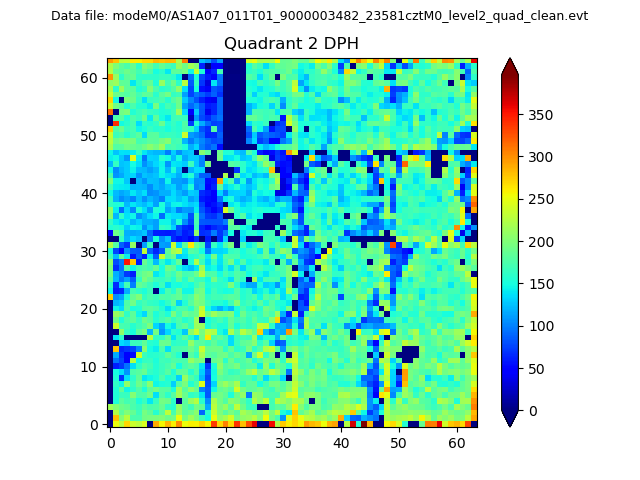
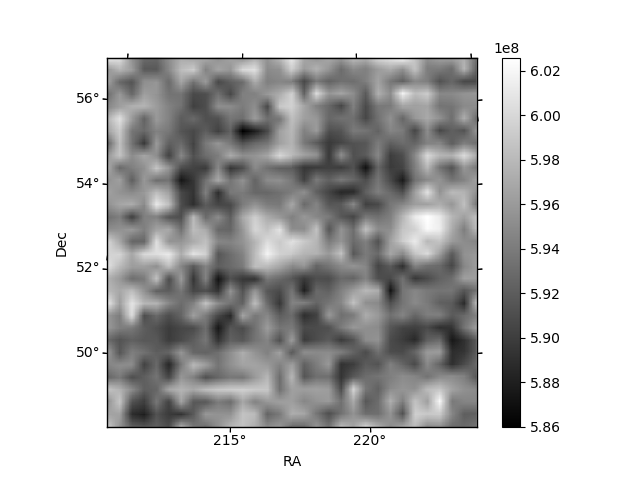
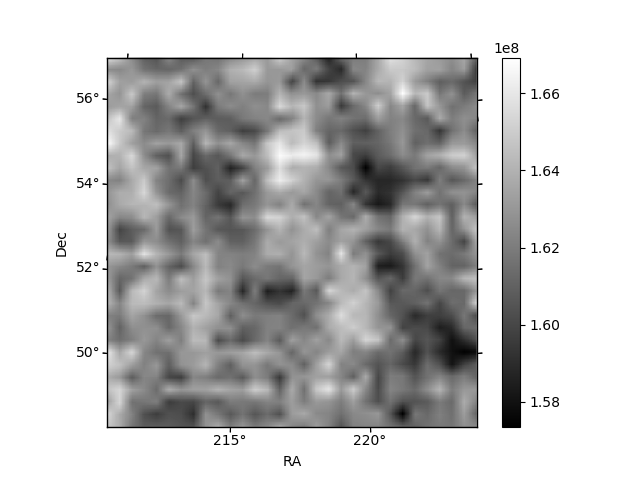
Histogram calculated using DETX and DETY for each event in the final _common_clean file
| Quadrant A |  |
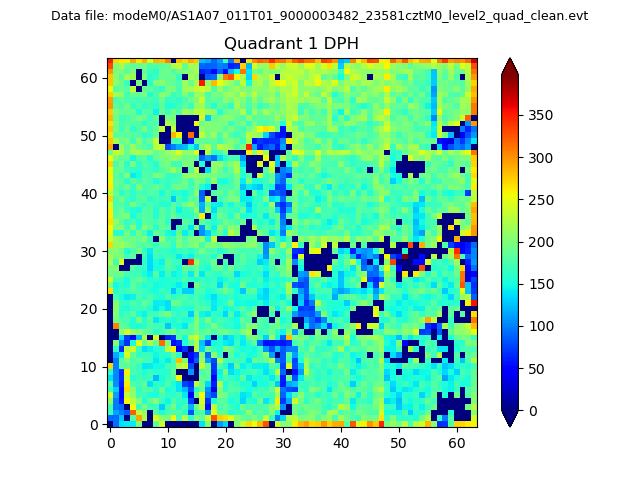 |
Quadrant B |
|---|---|---|---|
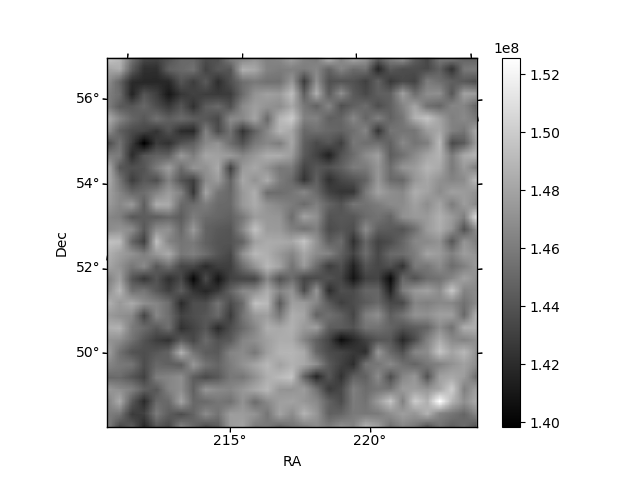
| Quadrant D | 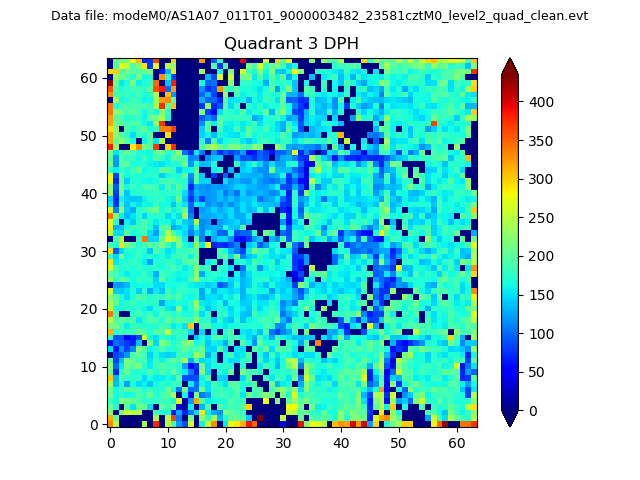 |
 |
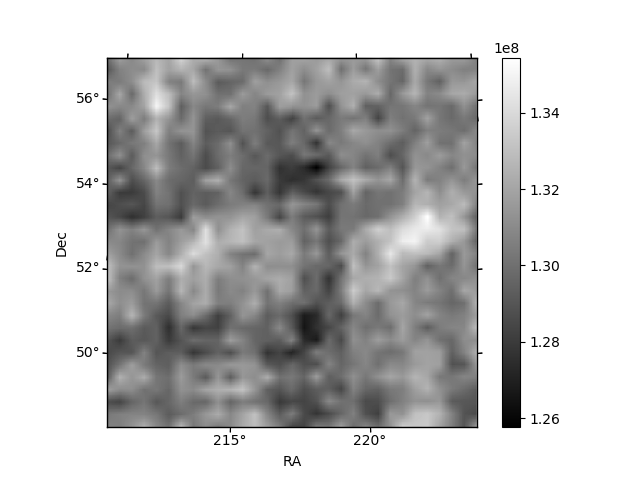
Quadrant C |
| Plot type | Count rate plots | Images |
|---|---|---|
| Comparison with Poisson distribution Blue bars denote a histogram of data divided into 1 sec bins. Red curve is a Poisson curve with rate = median count rate of data. |
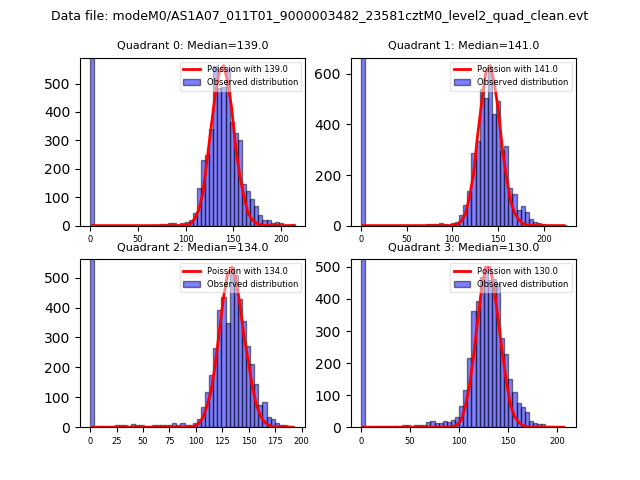 |
 |
| Quadrant-wise count rates Data is divided into 100 sec bins |
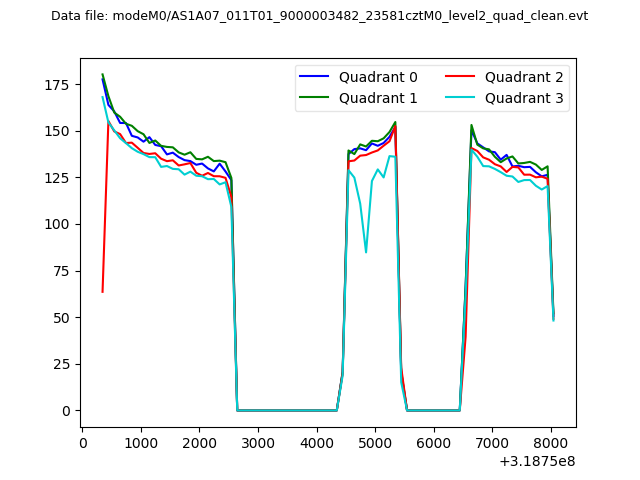 |
|
| Module-wise count rates for Quadrant A Data is divided into 100 sec bins |
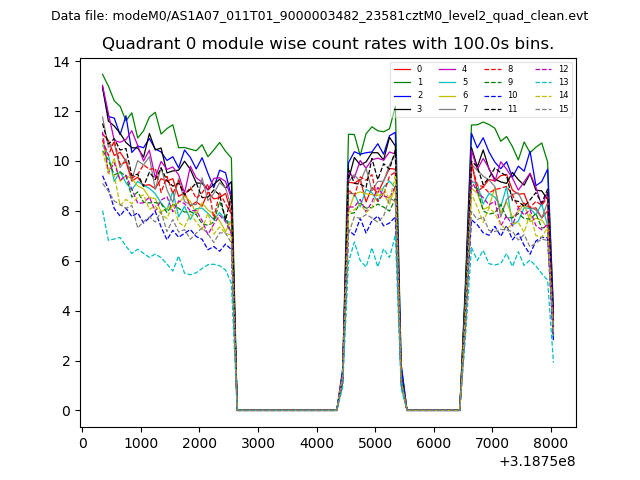 |
 |
| Module-wise count rates for Quadrant B Data is divided into 100 sec bins |
 |
 |
| Module-wise count rates for Quadrant C Data is divided into 100 sec bins |
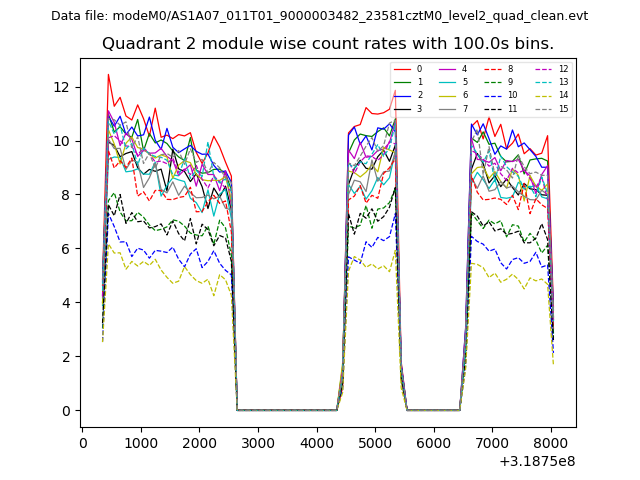 |
 |
| Module-wise count rates for Quadrant D Data is divided into 100 sec bins |
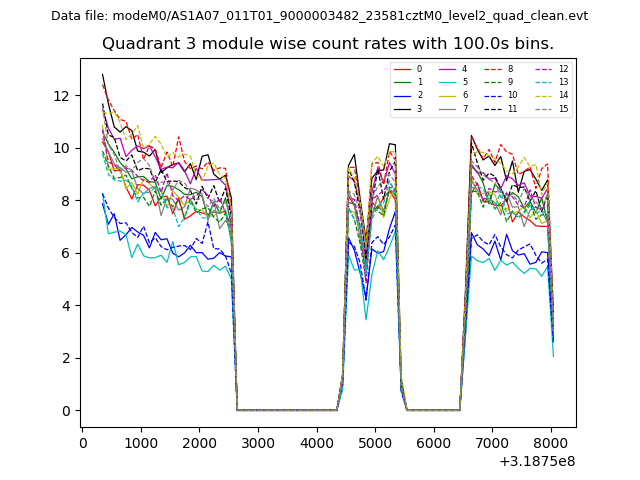 |
 |
| Parameter | Plot |
|---|---|
| CZT HV Monitor | 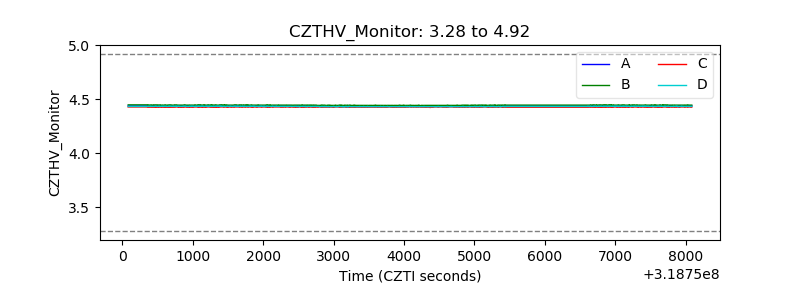 |
| D_VDD | 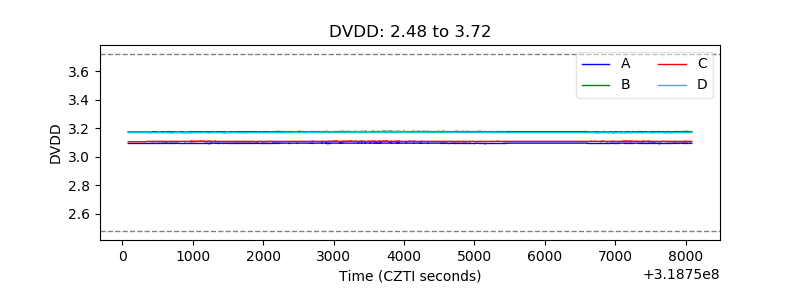 |
| Temperature 1 | 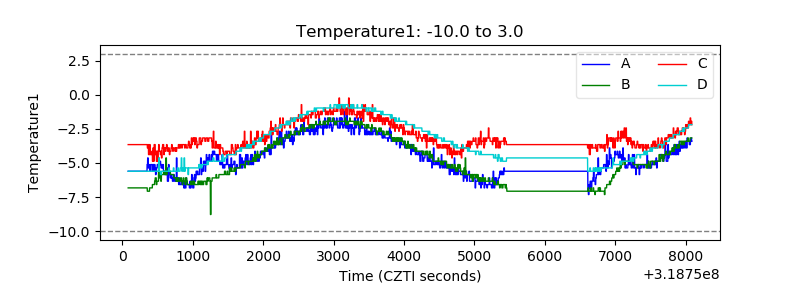 |
| Veto HV Monitor | 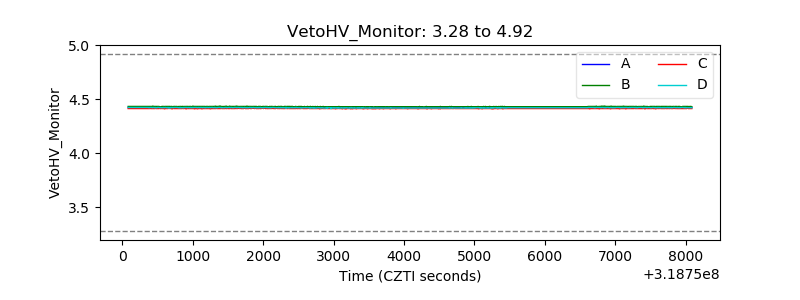 |
| Veto LLD | 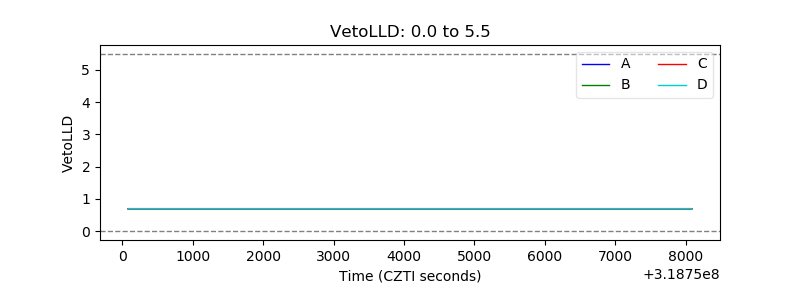 |
| Alpha Counter | 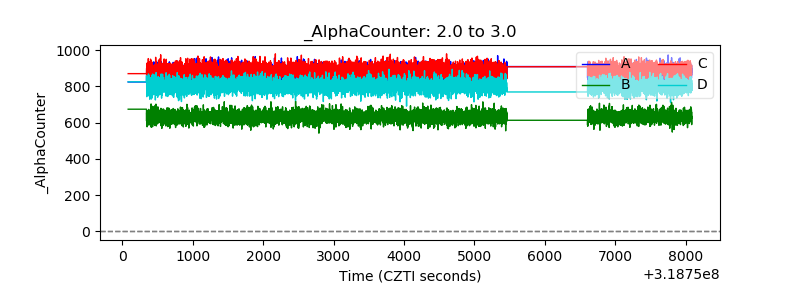 |
| _CPM_Rate | 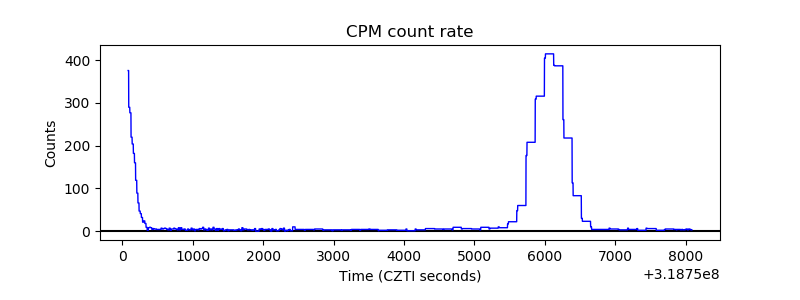 |
| CZT Counter | 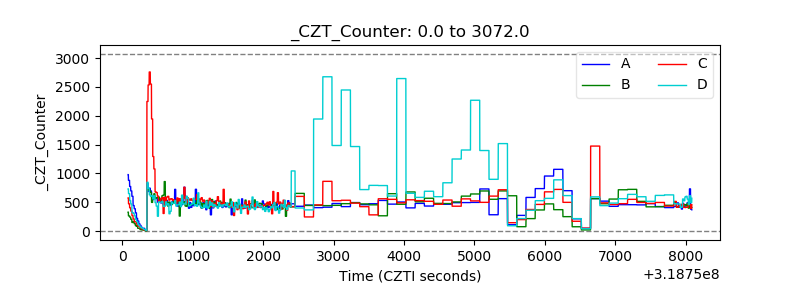 |
| +2.5 Volts monitor |  |
| +5 Volts monitor |  |
| _ROLL_ROT | 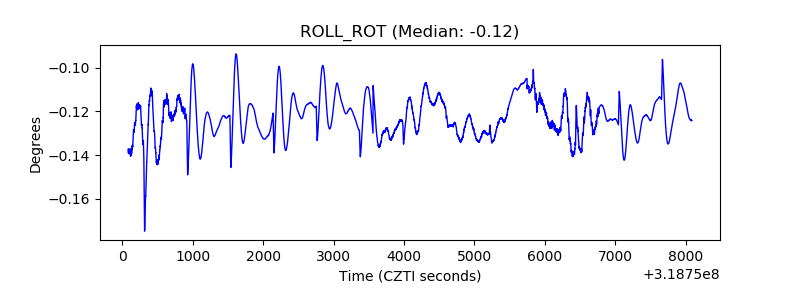 |
| _Roll_DEC | 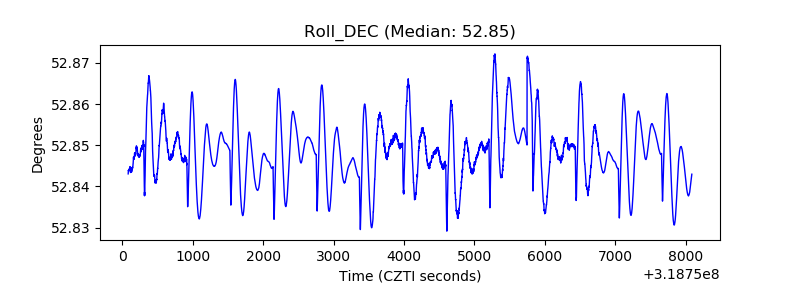 |
| _Roll_RA | 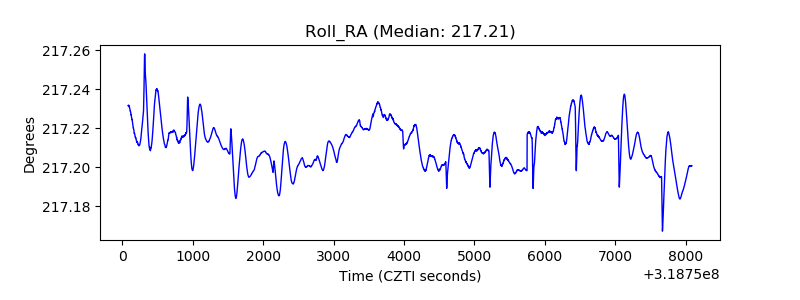 |
| Veto Counter | 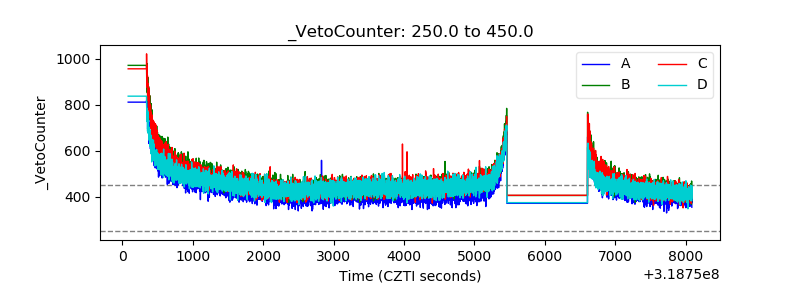 |