| Param | Original file | Final file |
|---|---|---|
| Filename | modeM0/AS1A07_011T01_9000003482_23582cztM0_level2.evt | modeM0/AS1A07_011T01_9000003482_23582cztM0_level2_quad_clean.evt |
| Size (bytes) | 474,972,480 | 86,212,800 |
| Size | 453.0 MB | 82.2 MB |
| Events in quadrant A | 3,171,302 | 554,407 |
| Events in quadrant B | 3,240,589 | 565,175 |
| Events in quadrant C | 3,063,157 | 533,826 |
| Events in quadrant D | 4,491,954 | 528,161 |
| Mode M9 | |||
|---|---|---|---|
| Quadrant | BADHDUFLAG | Total packets | Discarded packets |
| A | 0 | 8 | 0 |
| B | 0 | 8 | 0 |
| C | 0 | 8 | 0 |
| D | 0 | 8 | 0 |
| Mode SS | |||
|---|---|---|---|
| Quadrant | BADHDUFLAG | Total packets | Discarded packets |
| A | 0 | 124 | 0 |
| B | 0 | 124 | 0 |
| C | 0 | 124 | 0 |
| D | 0 | 124 | 0 |
| Mode M0 | |||
|---|---|---|---|
| Quadrant | BADHDUFLAG | Total packets | Discarded packets |
| A | 0 | 13427 | 1 |
| B | 0 | 13526 | 1 |
| C | 0 | 13021 | 2 |
| D | 0 | 17512 | 1 |
| Quadrant | Total seconds | Saturated seconds | Saturation percentage |
|---|---|---|---|
| A | 6152 | 147 | 2.389467% |
| B | 6153 | 121 | 1.966520% |
| C | 6152 | 143 | 2.324447% |
| D | 6152 | 253 | 4.112484% |
Noise dominated data is calculated using 1-second bins in cleaned event files. If a bin has >2000 counts, and if more than 50% of those come from <1% of pixels, then it is considered to be noise-dominated and hence unusable.
| Quadrant | # 1 sec bins | Bins with >0 counts | Bins with >2000 counts | High rate bins dominated by noise | Noise dominated (total time) | Noise dominated (detector-on time) | Marked lightcurve |
|---|---|---|---|---|---|---|---|
| A | 6922 | 6152 | 57 | 57 | 0.82% | 0.93% | 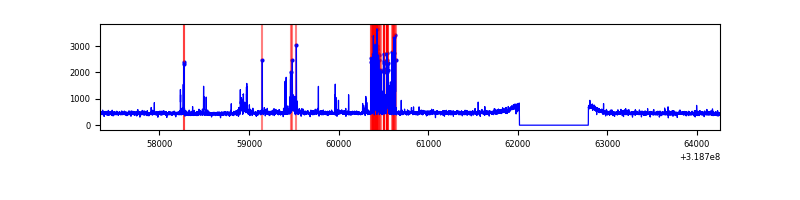 |
| B | 6923 | 6153 | 12 | 12 | 0.17% | 0.20% | 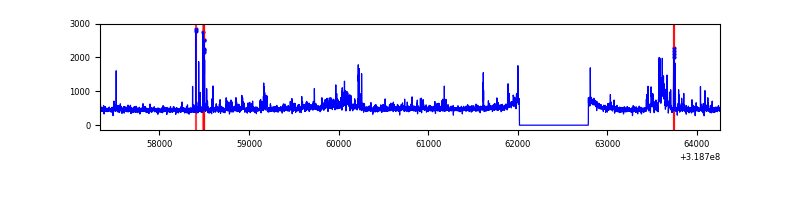 |
| C | 6922 | 6152 | 72 | 72 | 1.04% | 1.17% | 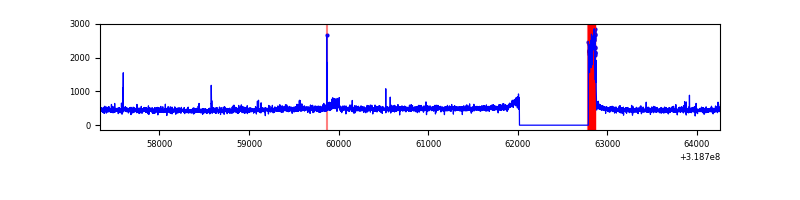 |
| D | 6922 | 6152 | 188 | 188 | 2.72% | 3.06% | 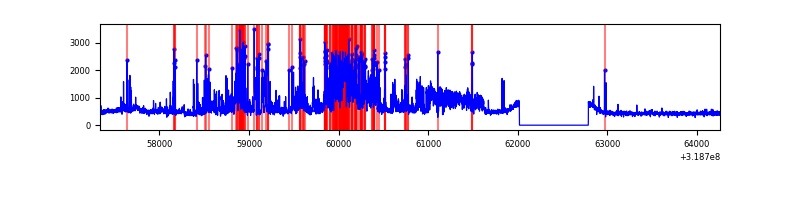 |
Top three noisy pixels from each quadrant. If the there are fewer than three noisy pixels in the level2.evt file, extra rows are filled as -1
| Pixel properties | Quadrant properties | ||||||
|---|---|---|---|---|---|---|---|
| Quadrant | DetID | PixID | Counts | Sigma | Mean | Median | Sigma |
| A | 6 | 16 | 313124 | 2087.69 | 741 | 724 | 149.6 |
| A | 13 | 254 | 11195 | 69.97 | 741 | 724 | 149.6 |
| A | 3 | 137 | 6420 | 38.06 | 741 | 724 | 149.6 |
| B | 3 | 64 | 132031 | 945.37 | 733 | 715 | 138.9 |
| B | 0 | 189 | 119367 | 854.2 | 733 | 715 | 138.9 |
| B | 10 | 247 | 23583 | 164.63 | 733 | 715 | 138.9 |
| C | 0 | 10 | 223653 | 1389.09 | 692 | 697 | 160.5 |
| C | 14 | 238 | 112127 | 694.24 | 692 | 697 | 160.5 |
| C | 10 | 9 | 11716 | 68.65 | 692 | 697 | 160.5 |
| D | 1 | 52 | 913723 | 5259.0 | 710 | 688 | 173.6 |
| D | 7 | 223 | 463656 | 2666.65 | 710 | 688 | 173.6 |
| D | 7 | 38 | 196092 | 1125.51 | 710 | 688 | 173.6 |
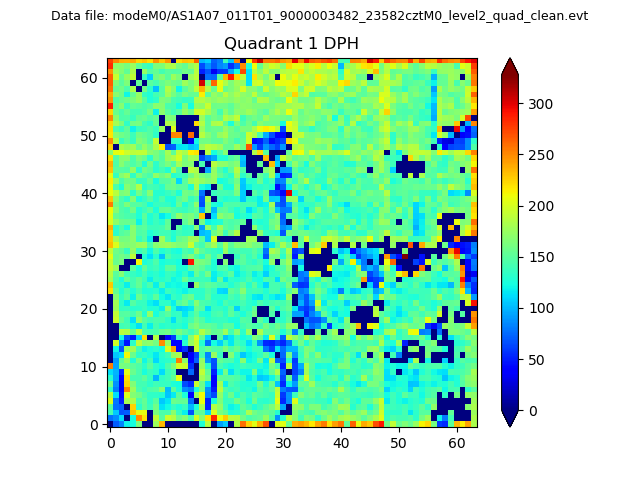
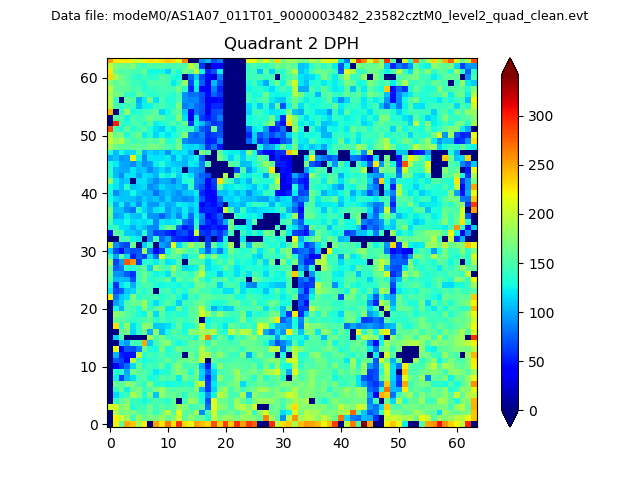
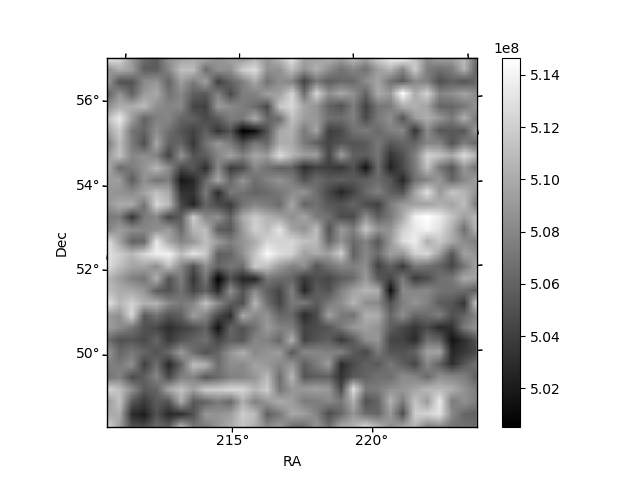
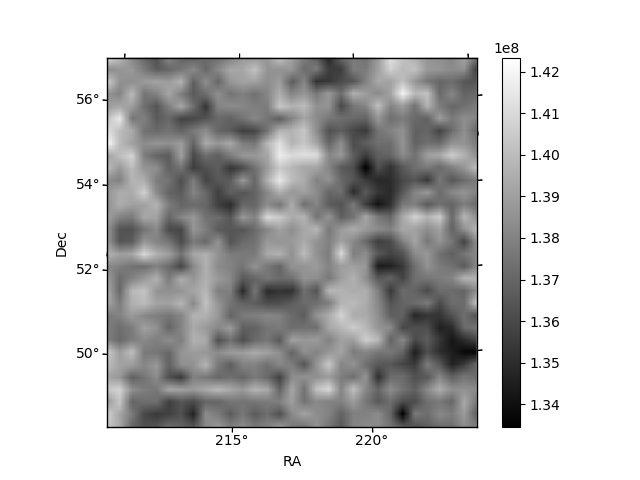
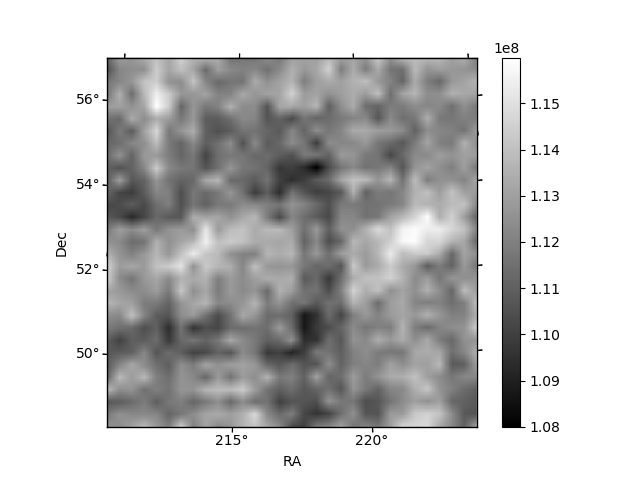
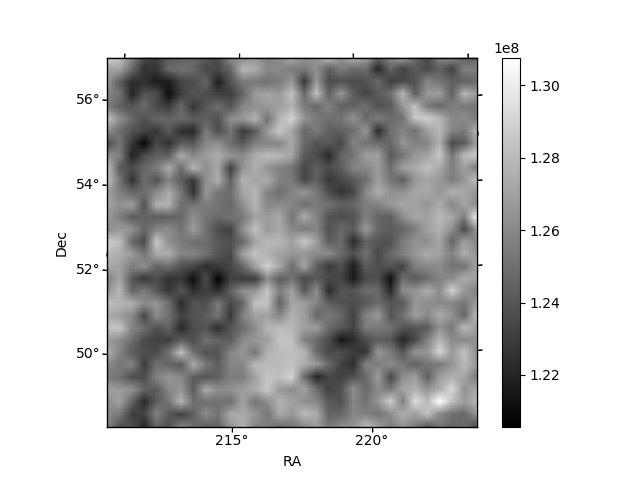
Histogram calculated using DETX and DETY for each event in the final _common_clean file
| Quadrant A |  |
 |
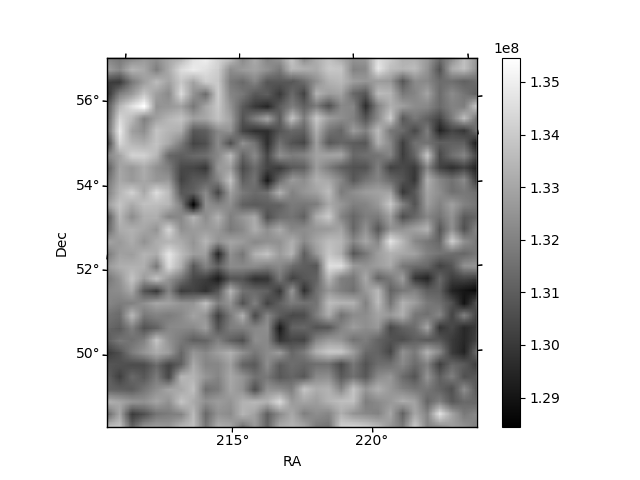
Quadrant B |
|---|---|---|---|
| Quadrant D | 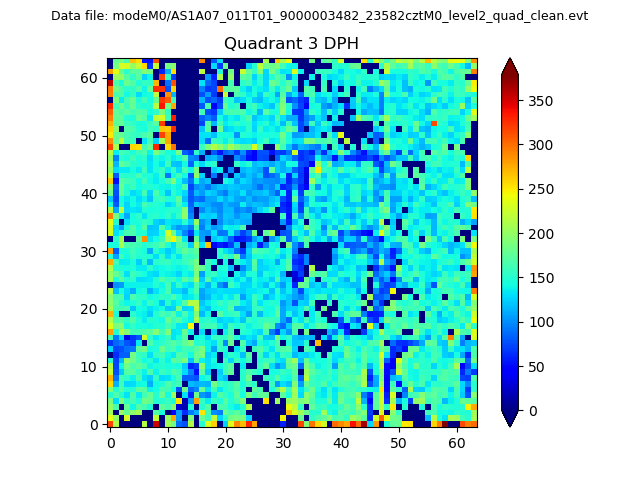 |
 |
Quadrant C |
| Plot type | Count rate plots | Images |
|---|---|---|
| Comparison with Poisson distribution Blue bars denote a histogram of data divided into 1 sec bins. Red curve is a Poisson curve with rate = median count rate of data. |
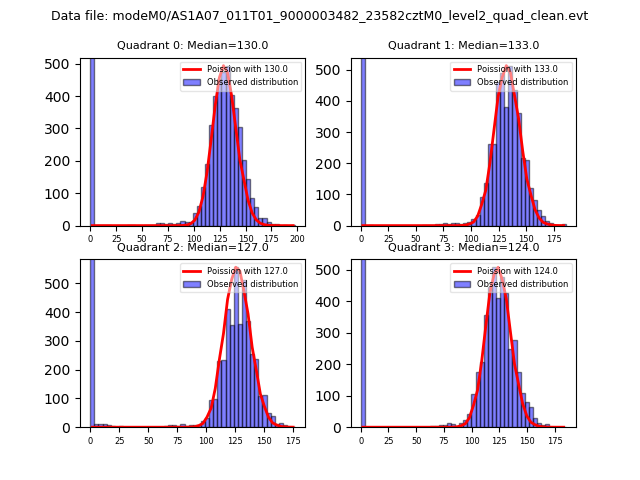 |
 |
| Quadrant-wise count rates Data is divided into 100 sec bins |
 |
|
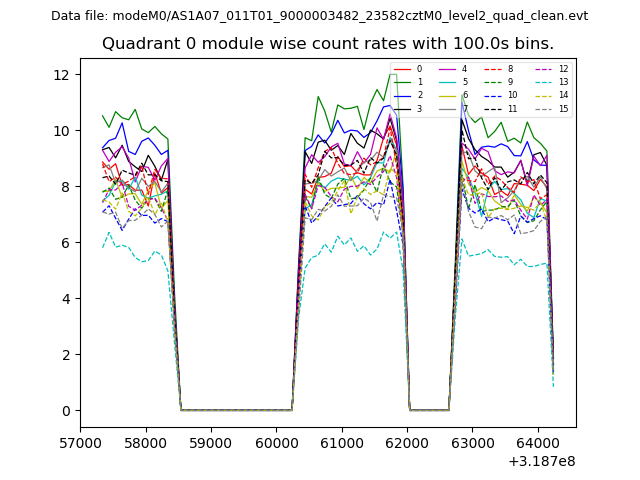
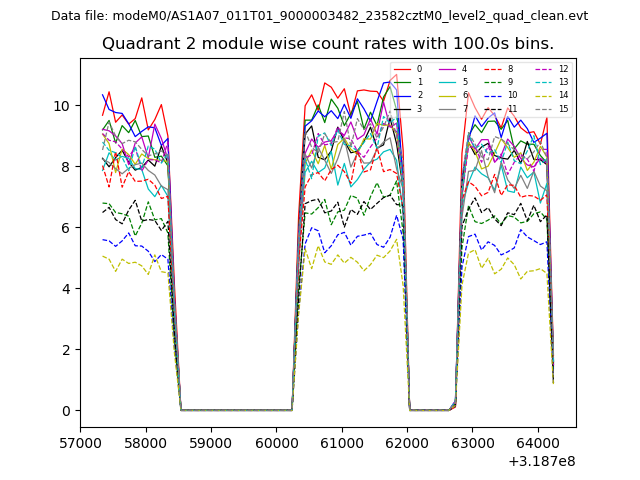
| Module-wise count rates for Quadrant A Data is divided into 100 sec bins |
 |
 |
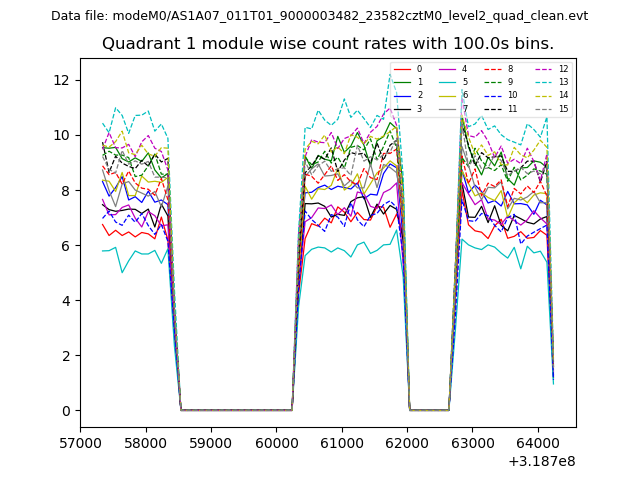
| Module-wise count rates for Quadrant B Data is divided into 100 sec bins |
 |
 |
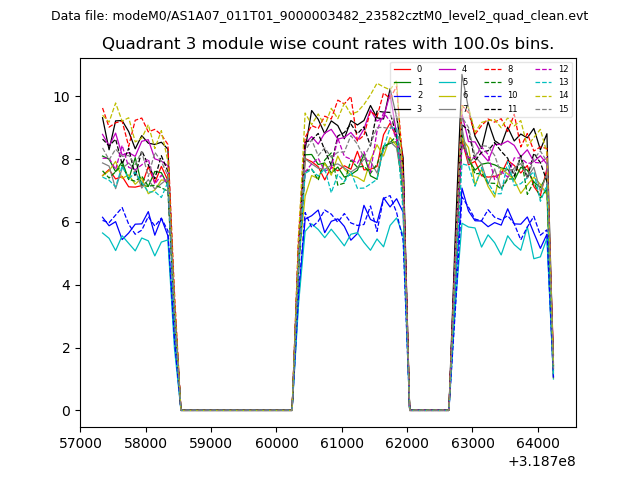
| Module-wise count rates for Quadrant C Data is divided into 100 sec bins |
 |
 |
| Module-wise count rates for Quadrant D Data is divided into 100 sec bins |
 |
 |
| Parameter | Plot |
|---|---|
| CZT HV Monitor |  |
| D_VDD | 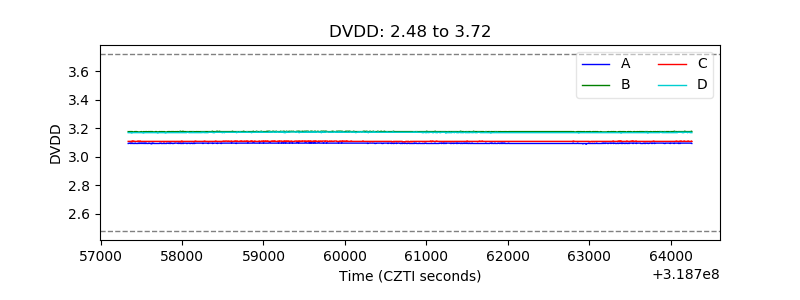 |
| Temperature 1 | 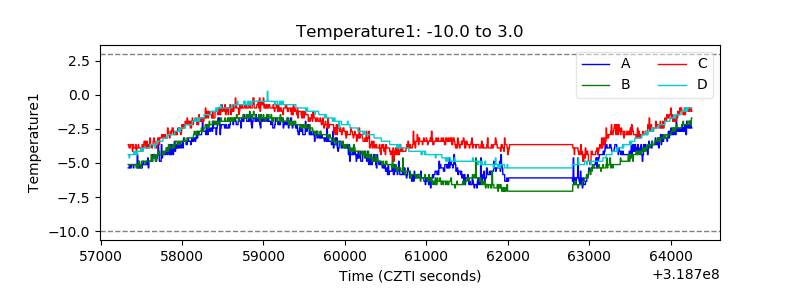 |
| Veto HV Monitor | 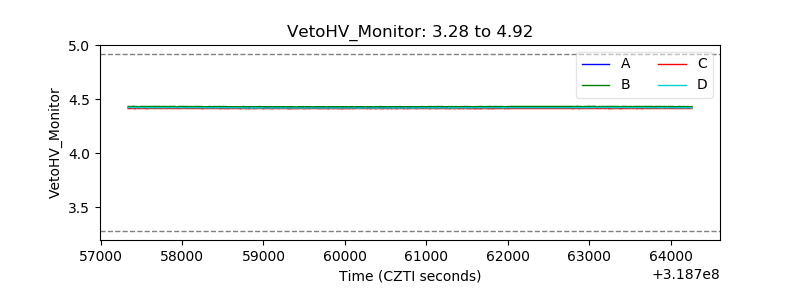 |
| Veto LLD | 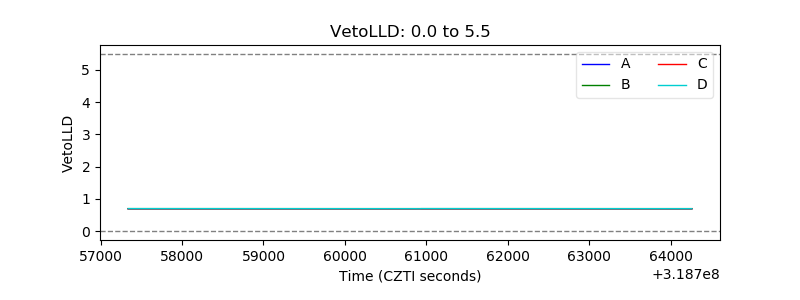 |
| Alpha Counter | 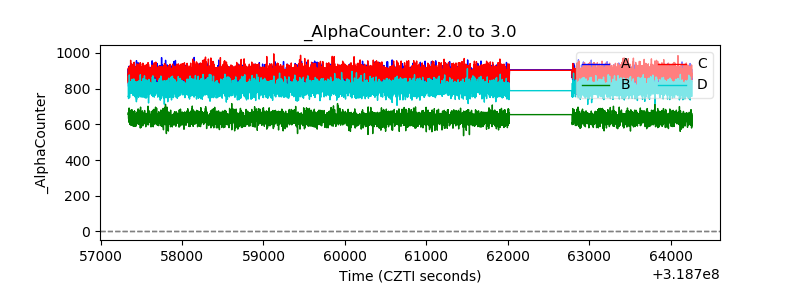 |
| _CPM_Rate | 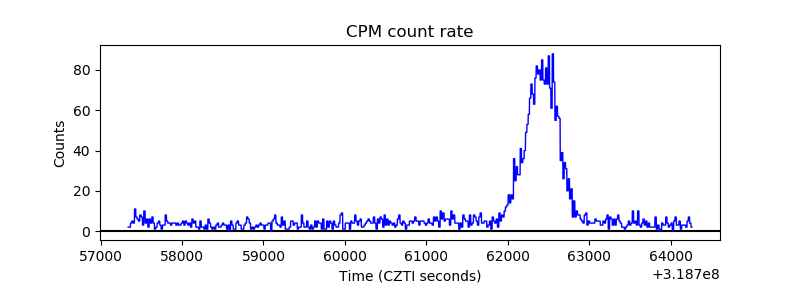 |
| CZT Counter | 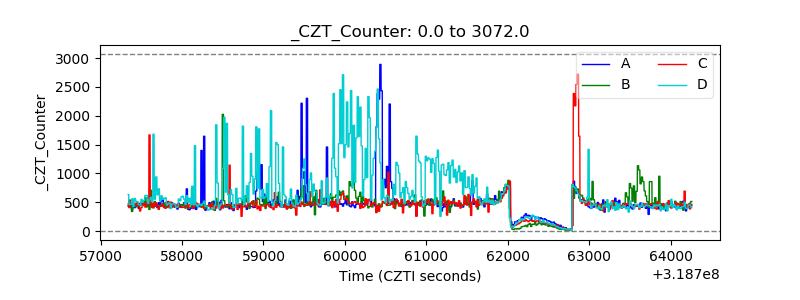 |
| +2.5 Volts monitor | 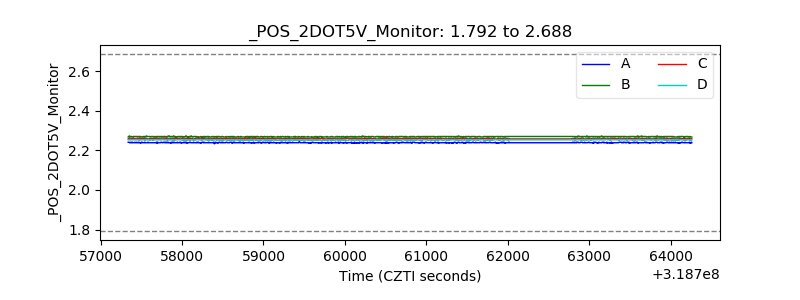 |
| +5 Volts monitor |  |
| _ROLL_ROT | 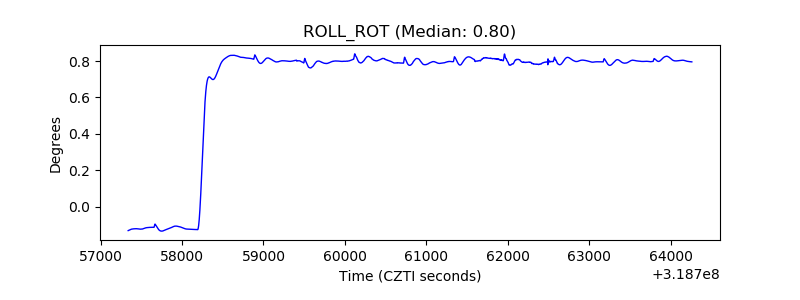 |
| _Roll_DEC | 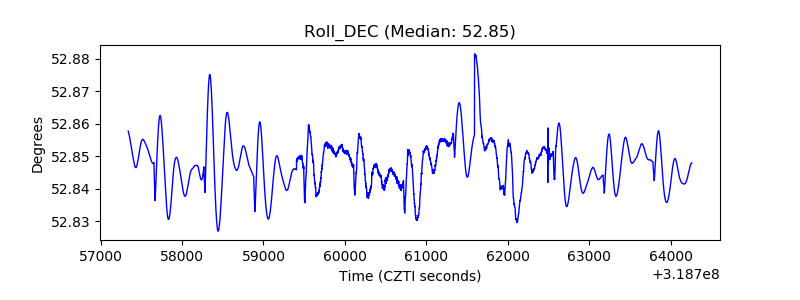 |
| _Roll_RA | 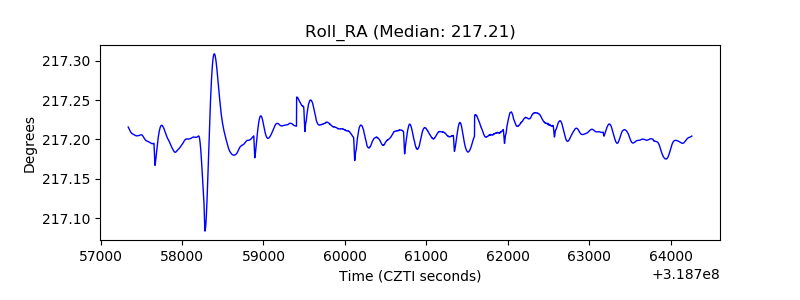 |
| Veto Counter | 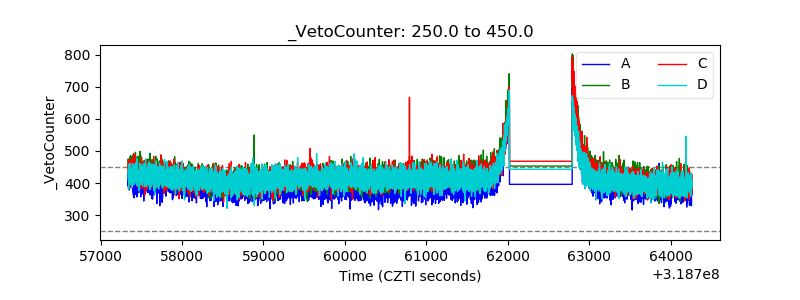 |