| Param | Original file | Final file |
|---|---|---|
| Filename | modeM0/AS1A07_011T01_9000003482_23583cztM0_level2.evt | modeM0/AS1A07_011T01_9000003482_23583cztM0_level2_quad_clean.evt |
| Size (bytes) | 507,741,120 | 102,147,840 |
| Size | 484.2 MB | 97.4 MB |
| Events in quadrant A | 3,525,689 | 653,412 |
| Events in quadrant B | 3,777,760 | 666,231 |
| Events in quadrant C | 3,548,990 | 633,409 |
| Events in quadrant D | 4,025,415 | 629,020 |
| Mode M9 | |||
|---|---|---|---|
| Quadrant | BADHDUFLAG | Total packets | Discarded packets |
| A | 0 | 3 | 0 |
| B | 0 | 3 | 0 |
| C | 0 | 3 | 0 |
| D | 0 | 3 | 0 |
| Mode SS | |||
|---|---|---|---|
| Quadrant | BADHDUFLAG | Total packets | Discarded packets |
| A | 0 | 150 | 0 |
| B | 0 | 150 | 0 |
| C | 0 | 150 | 0 |
| D | 0 | 150 | 0 |
| Mode M0 | |||
|---|---|---|---|
| Quadrant | BADHDUFLAG | Total packets | Discarded packets |
| A | 0 | 15352 | 2 |
| B | 0 | 15893 | 2 |
| C | 0 | 15323 | 2 |
| D | 0 | 17052 | 3 |
| Quadrant | Total seconds | Saturated seconds | Saturation percentage |
|---|---|---|---|
| A | 7340 | 175 | 2.384196% |
| B | 7341 | 207 | 2.819779% |
| C | 7341 | 218 | 2.969623% |
| D | 7340 | 285 | 3.882834% |
Noise dominated data is calculated using 1-second bins in cleaned event files. If a bin has >2000 counts, and if more than 50% of those come from <1% of pixels, then it is considered to be noise-dominated and hence unusable.
| Quadrant | # 1 sec bins | Bins with >0 counts | Bins with >2000 counts | High rate bins dominated by noise | Noise dominated (total time) | Noise dominated (detector-on time) | Marked lightcurve |
|---|---|---|---|---|---|---|---|
| A | 7670 | 7340 | 11 | 11 | 0.14% | 0.15% | 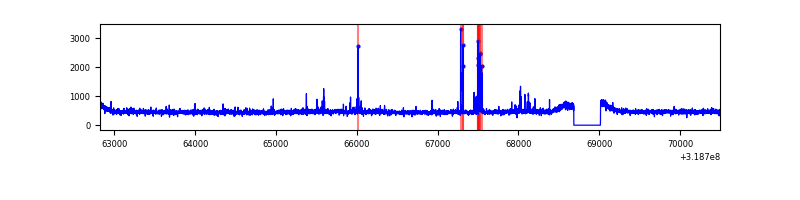 |
| B | 7671 | 7341 | 20 | 20 | 0.26% | 0.27% | 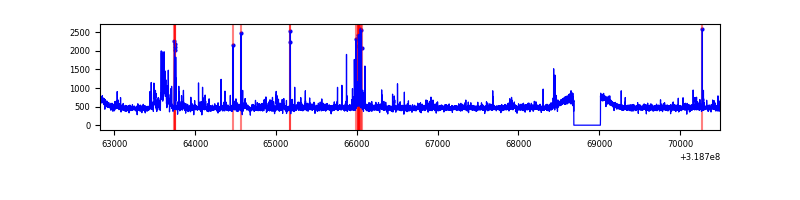 |
| C | 7671 | 7341 | 44 | 44 | 0.57% | 0.60% | 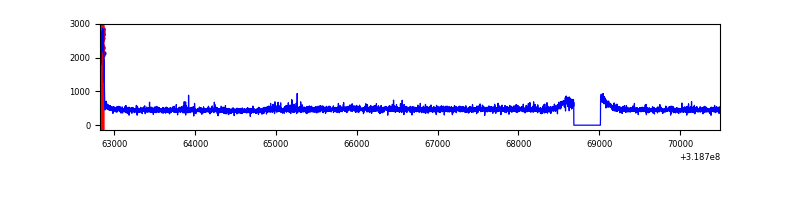 |
| D | 7670 | 7340 | 173 | 173 | 2.26% | 2.36% | 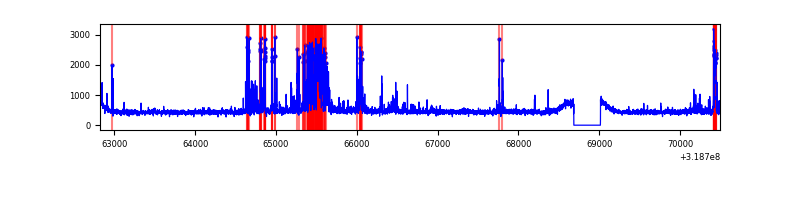 |
Top three noisy pixels from each quadrant. If the there are fewer than three noisy pixels in the level2.evt file, extra rows are filled as -1
| Pixel properties | Quadrant properties | ||||||
|---|---|---|---|---|---|---|---|
| Quadrant | DetID | PixID | Counts | Sigma | Mean | Median | Sigma |
| A | 6 | 16 | 117856 | 658.92 | 883 | 863 | 177.6 |
| A | 13 | 254 | 13285 | 69.96 | 883 | 863 | 177.6 |
| A | 3 | 137 | 7900 | 39.63 | 883 | 863 | 177.6 |
| B | 0 | 189 | 125993 | 747.71 | 876 | 850 | 167.4 |
| B | 3 | 64 | 121296 | 719.65 | 876 | 850 | 167.4 |
| B | 0 | 229 | 30227 | 175.52 | 876 | 850 | 167.4 |
| C | 0 | 10 | 136940 | 702.93 | 834 | 835 | 193.6 |
| C | 14 | 238 | 132874 | 681.93 | 834 | 835 | 193.6 |
| C | 1 | 16 | 15029 | 73.31 | 834 | 835 | 193.6 |
| D | 12 | 233 | 658573 | 3184.12 | 848 | 822 | 206.6 |
| D | 7 | 223 | 48541 | 231.0 | 848 | 822 | 206.6 |
| D | 1 | 52 | 32545 | 153.57 | 848 | 822 | 206.6 |
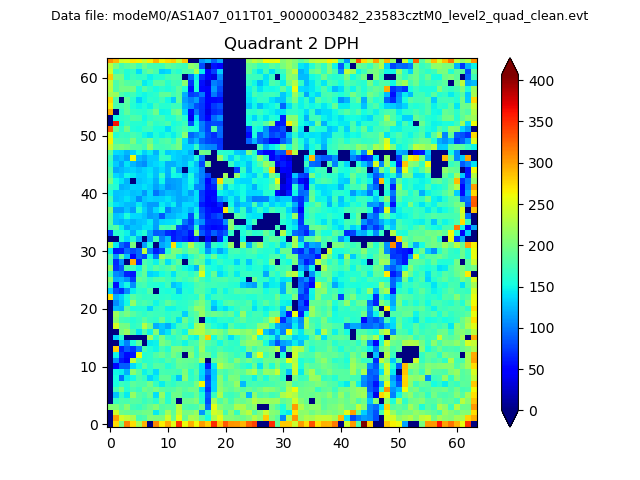
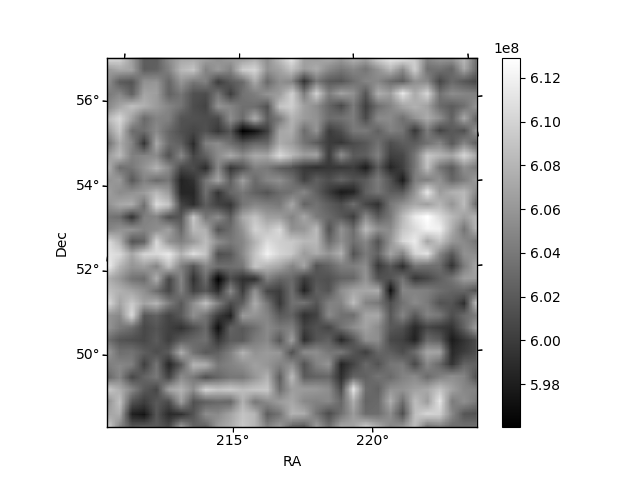
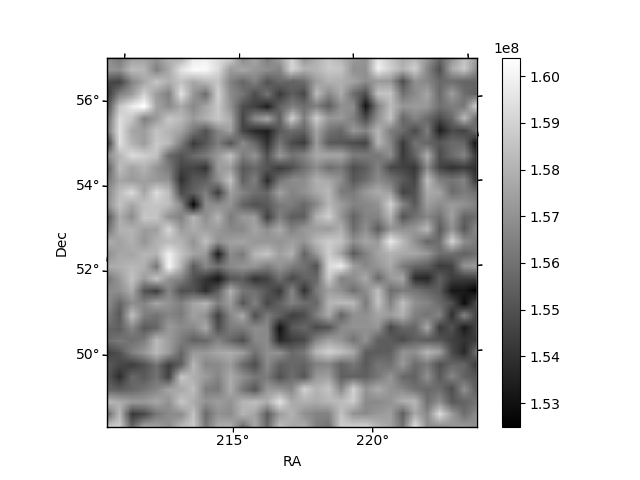
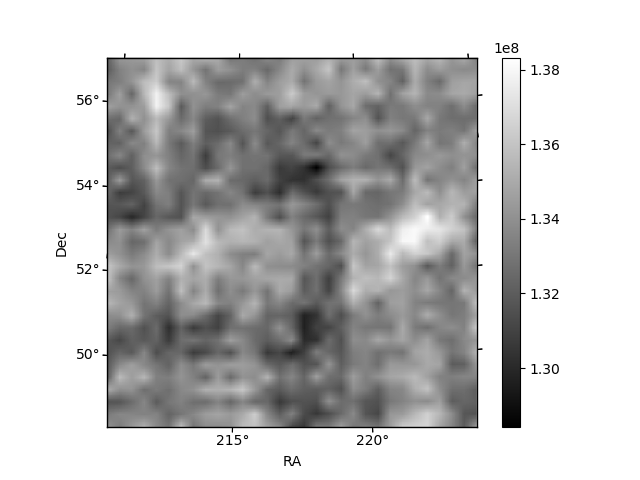
Histogram calculated using DETX and DETY for each event in the final _common_clean file
| Quadrant A | 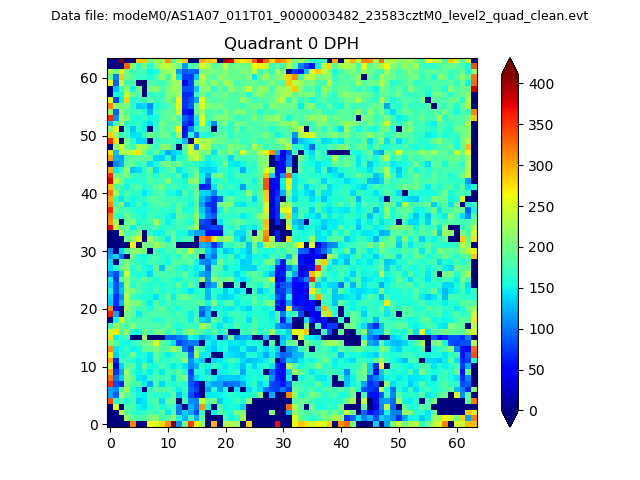 |
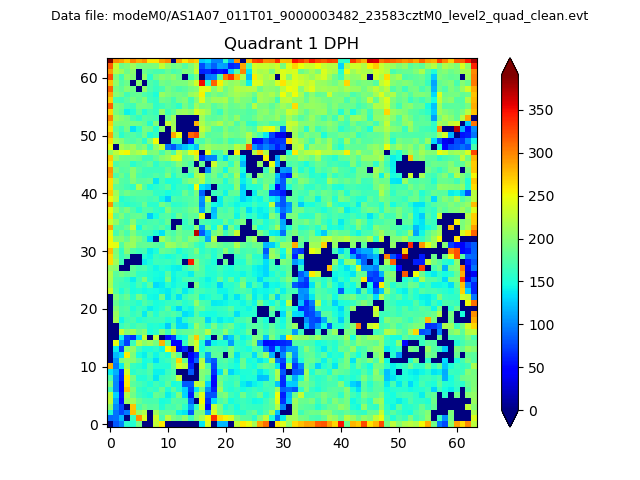 |
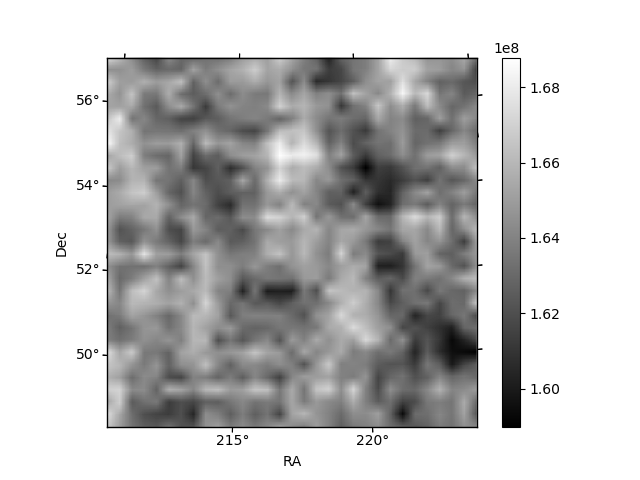
Quadrant B |
|---|---|---|---|
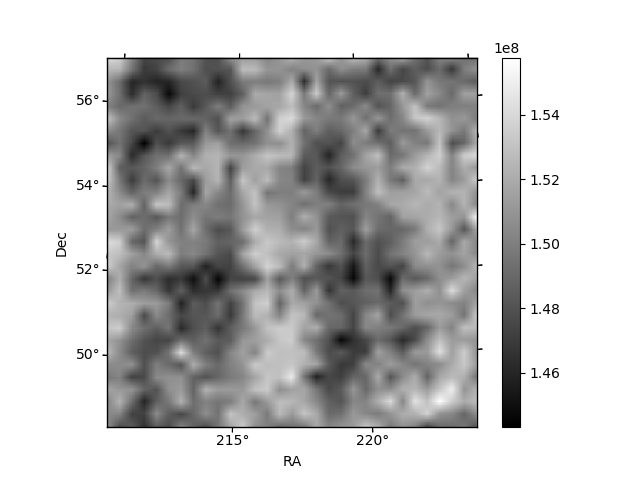
| Quadrant D | 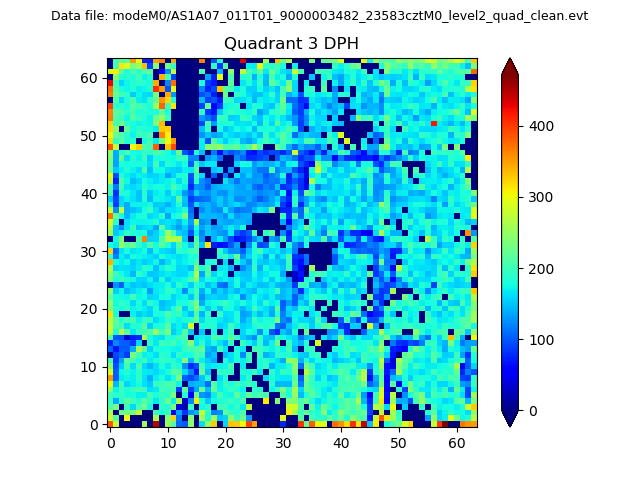 |
 |
Quadrant C |
| Plot type | Count rate plots | Images |
|---|---|---|
| Comparison with Poisson distribution Blue bars denote a histogram of data divided into 1 sec bins. Red curve is a Poisson curve with rate = median count rate of data. |
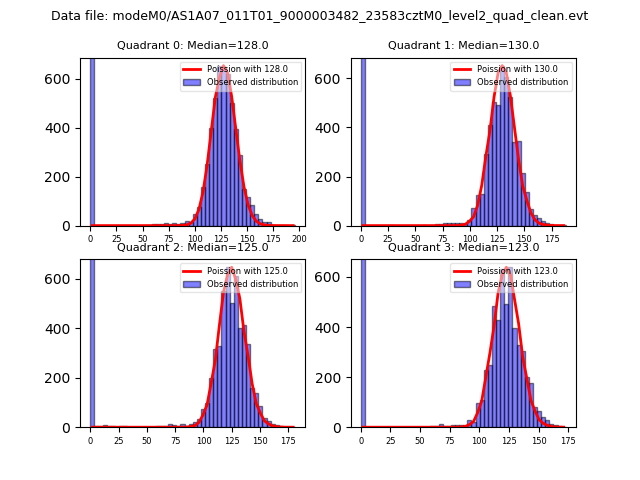 |
 |
| Quadrant-wise count rates Data is divided into 100 sec bins |
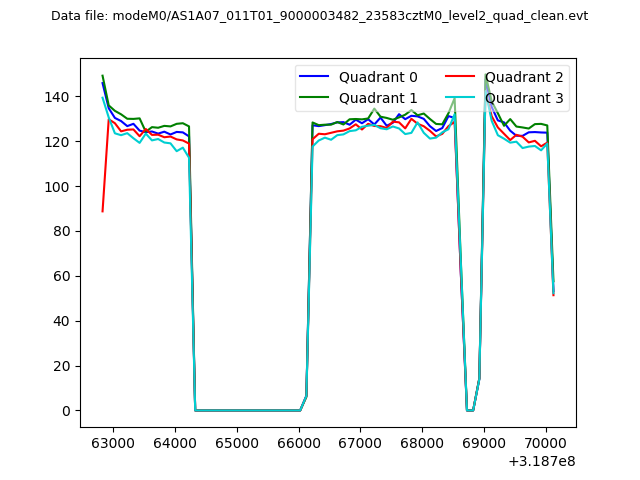 |
|
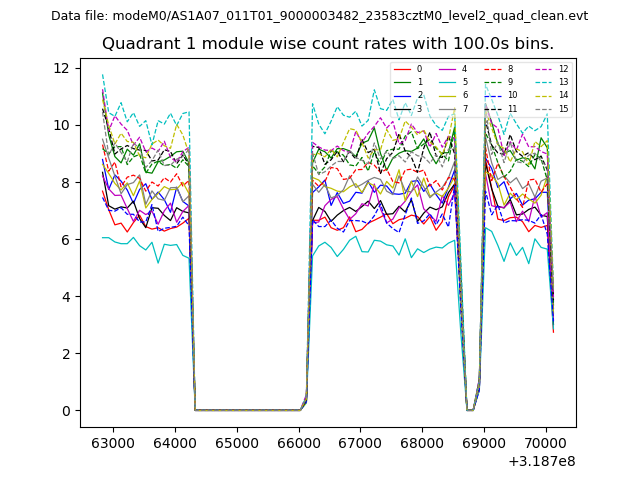
| Module-wise count rates for Quadrant A Data is divided into 100 sec bins |
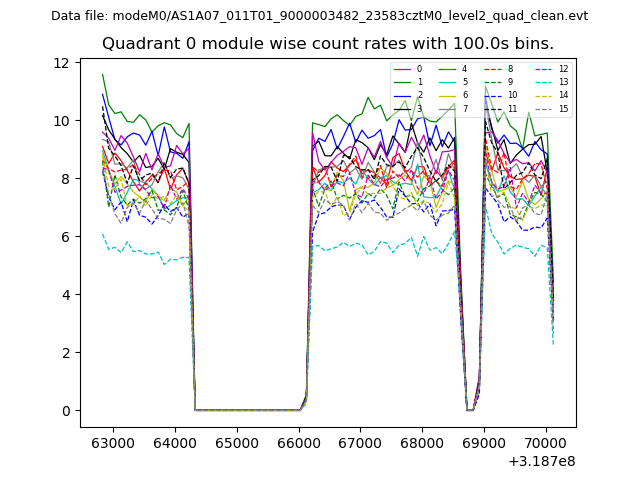 |
 |
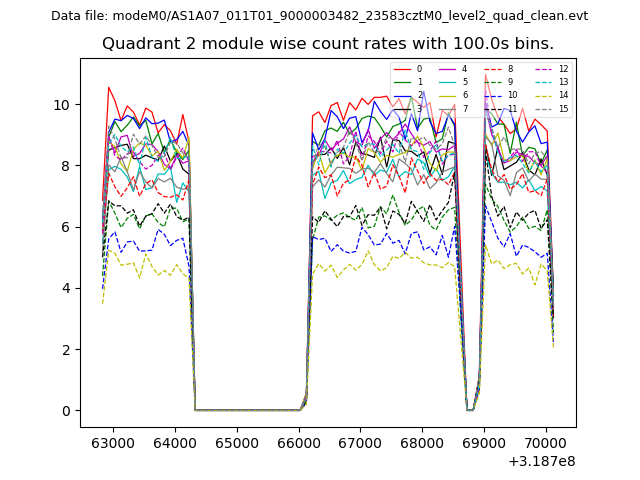
| Module-wise count rates for Quadrant B Data is divided into 100 sec bins |
 |
 |
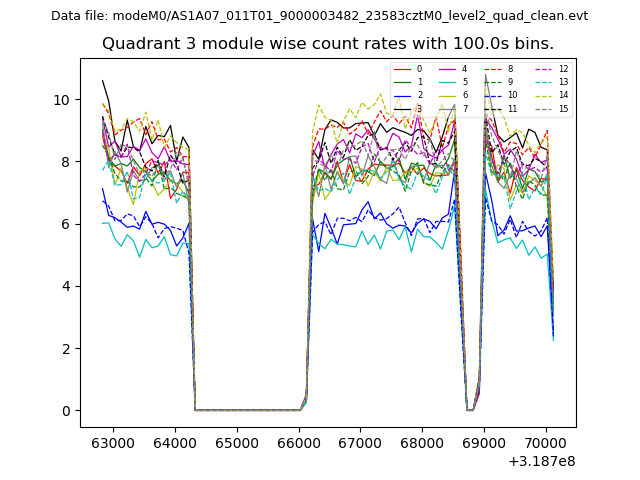
| Module-wise count rates for Quadrant C Data is divided into 100 sec bins |
 |
 |
| Module-wise count rates for Quadrant D Data is divided into 100 sec bins |
 |
 |
| Parameter | Plot |
|---|---|
| CZT HV Monitor | 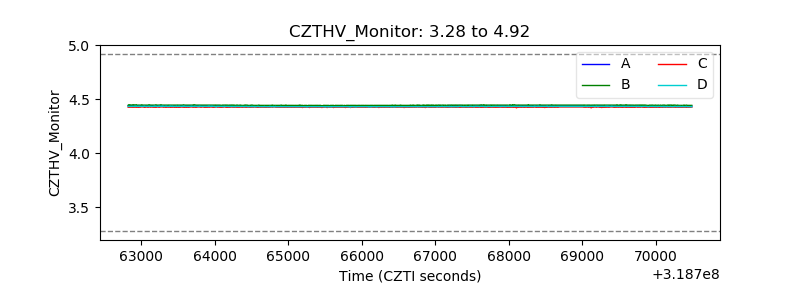 |
| D_VDD | 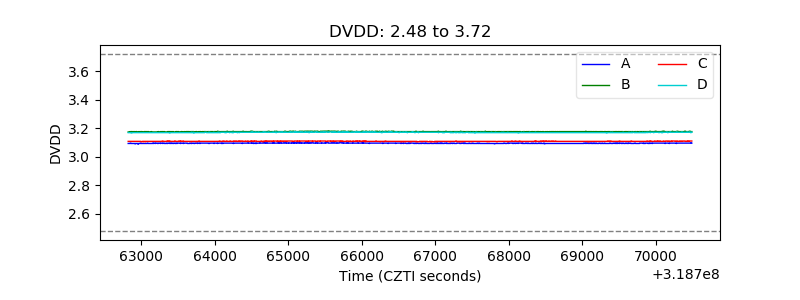 |
| Temperature 1 | 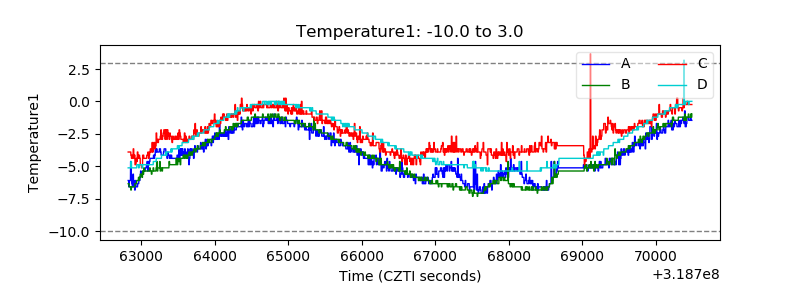 |
| Veto HV Monitor |  |
| Veto LLD | 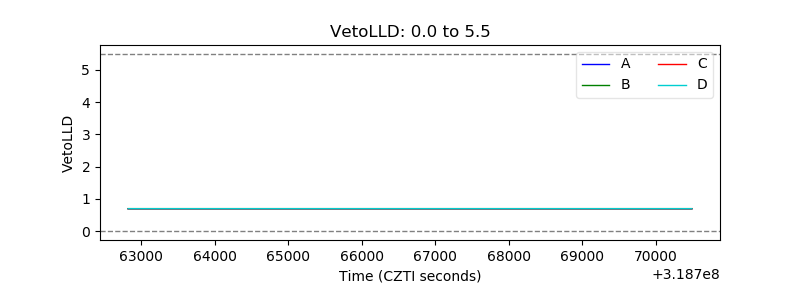 |
| Alpha Counter | 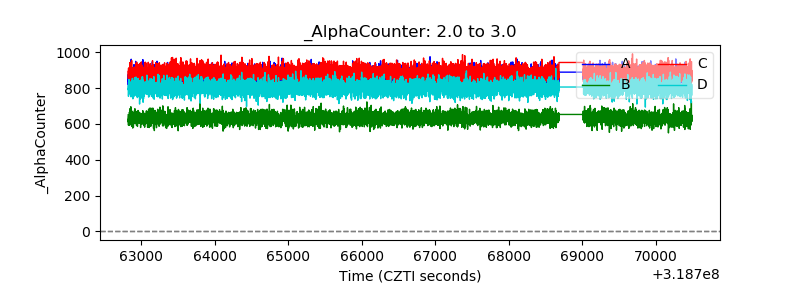 |
| _CPM_Rate | 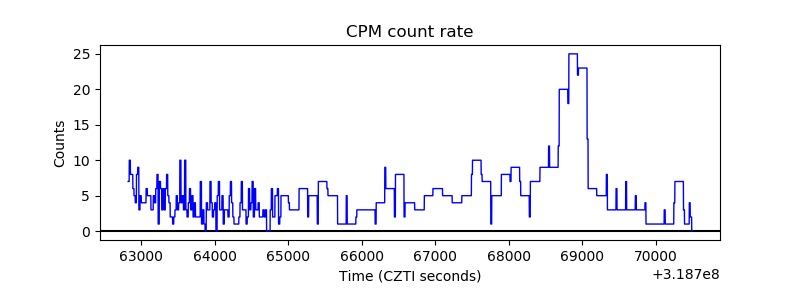 |
| CZT Counter | 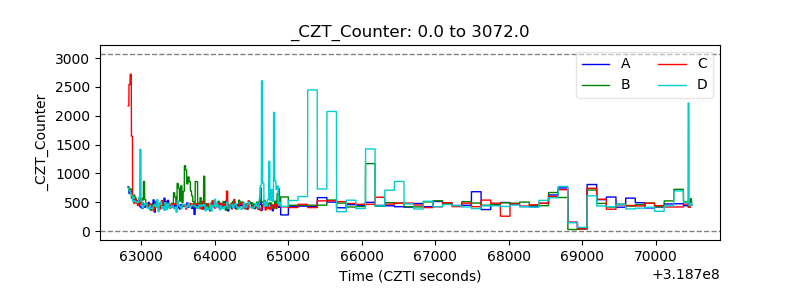 |
| +2.5 Volts monitor |  |
| +5 Volts monitor |  |
| _ROLL_ROT | 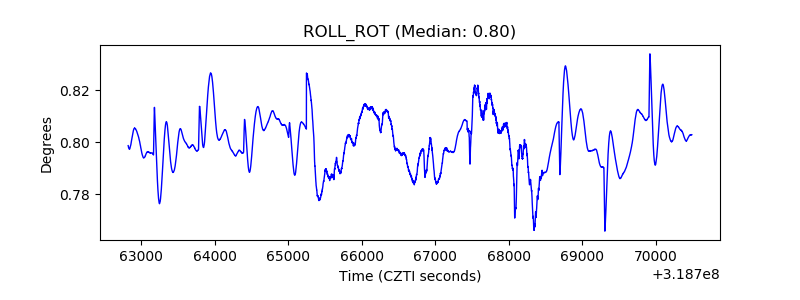 |
| _Roll_DEC | 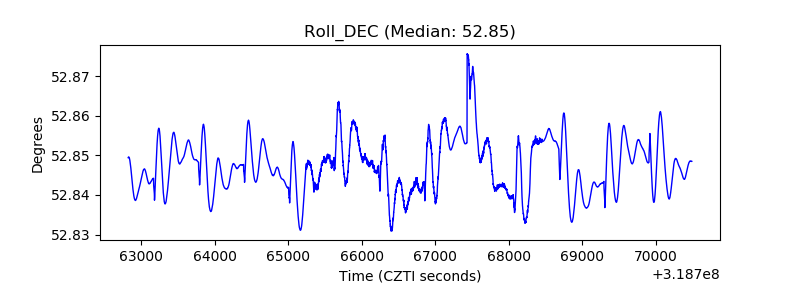 |
| _Roll_RA | 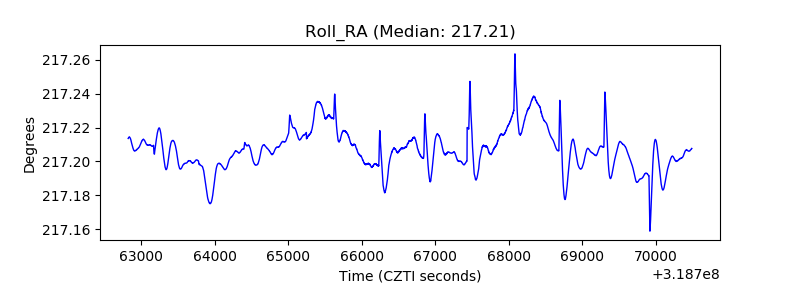 |
| Veto Counter | 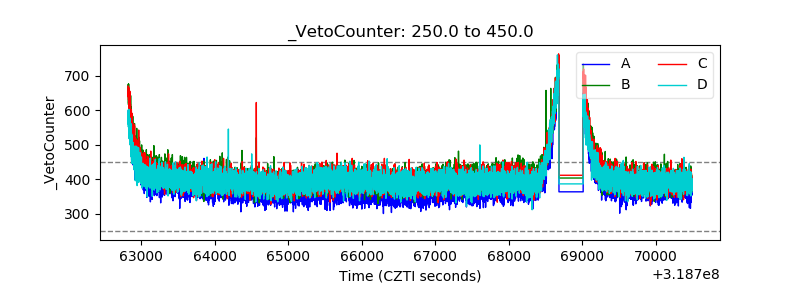 |