| Param | Original file | Final file |
|---|---|---|
| Filename | modeM0/AS1A07_011T01_9000003482_23584cztM0_level2.evt | modeM0/AS1A07_011T01_9000003482_23584cztM0_level2_quad_clean.evt |
| Size (bytes) | 482,898,240 | 93,911,040 |
| Size | 460.5 MB | 89.6 MB |
| Events in quadrant A | 3,381,356 | 594,676 |
| Events in quadrant B | 3,593,161 | 603,181 |
| Events in quadrant C | 3,422,215 | 578,922 |
| Events in quadrant D | 3,743,642 | 570,766 |
| Mode M9 | |||
|---|---|---|---|
| Quadrant | BADHDUFLAG | Total packets | Discarded packets |
| A | 0 | 3 | 1 |
| B | 0 | 2 | 0 |
| C | 0 | 2 | 0 |
| D | 0 | 2 | 0 |
| Mode SS | |||
|---|---|---|---|
| Quadrant | BADHDUFLAG | Total packets | Discarded packets |
| A | 0 | 148 | 4 |
| B | 0 | 148 | 4 |
| C | 0 | 148 | 8 |
| D | 0 | 148 | 4 |
| Mode M0 | |||
|---|---|---|---|
| Quadrant | BADHDUFLAG | Total packets | Discarded packets |
| A | 0 | 15252 | 470 |
| B | 0 | 15767 | 566 |
| C | 0 | 15250 | 471 |
| D | 0 | 16684 | 681 |
| Quadrant | Total seconds | Saturated seconds | Saturation percentage |
|---|---|---|---|
| A | 7139 | 192 | 2.689452% |
| B | 7124 | 204 | 2.863560% |
| C | 7147 | 205 | 2.868336% |
| D | 7112 | 174 | 2.446569% |
Noise dominated data is calculated using 1-second bins in cleaned event files. If a bin has >2000 counts, and if more than 50% of those come from <1% of pixels, then it is considered to be noise-dominated and hence unusable.
| Quadrant | # 1 sec bins | Bins with >0 counts | Bins with >2000 counts | High rate bins dominated by noise | Noise dominated (total time) | Noise dominated (detector-on time) | Marked lightcurve |
|---|---|---|---|---|---|---|---|
| A | 7871 | 7204 | 18 | 18 | 0.23% | 0.25% | 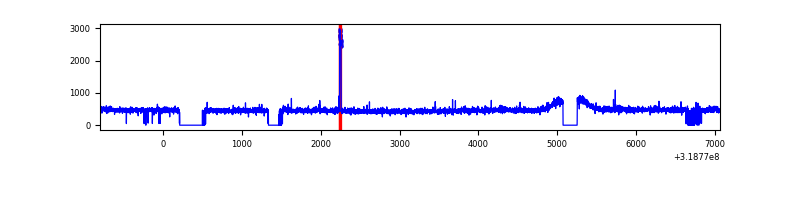 |
| B | 7867 | 7188 | 6 | 6 | 0.08% | 0.08% | 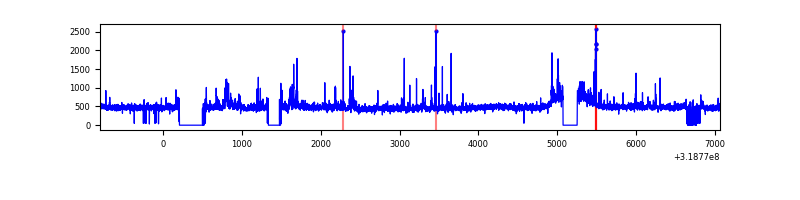 |
| C | 7869 | 7212 | 0 | 0 | 0.00% | 0.00% | 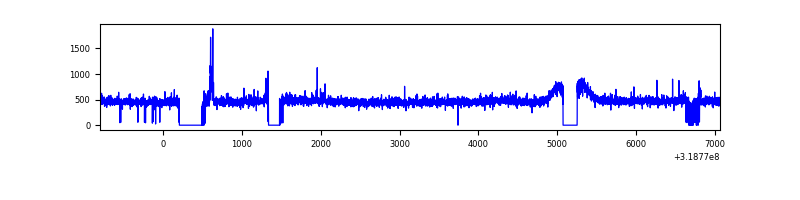 |
| D | 7869 | 7182 | 33 | 33 | 0.42% | 0.46% | 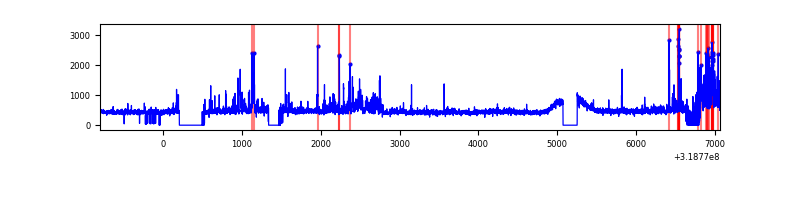 |
Top three noisy pixels from each quadrant. If the there are fewer than three noisy pixels in the level2.evt file, extra rows are filled as -1
| Pixel properties | Quadrant properties | ||||||
|---|---|---|---|---|---|---|---|
| Quadrant | DetID | PixID | Counts | Sigma | Mean | Median | Sigma |
| A | 15 | 174 | 53906 | 305.38 | 859 | 840 | 173.8 |
| A | 13 | 254 | 12859 | 69.17 | 859 | 840 | 173.8 |
| A | 6 | 16 | 9551 | 50.13 | 859 | 840 | 173.8 |
| B | 3 | 64 | 77096 | 466.09 | 849 | 826 | 163.6 |
| B | 0 | 189 | 68029 | 410.68 | 849 | 826 | 163.6 |
| B | 0 | 229 | 25406 | 150.21 | 849 | 826 | 163.6 |
| C | 14 | 238 | 128850 | 668.61 | 818 | 819 | 191.5 |
| C | 3 | 233 | 43911 | 225.04 | 818 | 819 | 191.5 |
| C | 10 | 9 | 26378 | 133.47 | 818 | 819 | 191.5 |
| D | 7 | 38 | 162969 | 795.99 | 830 | 805 | 203.7 |
| D | 1 | 52 | 141294 | 689.6 | 830 | 805 | 203.7 |
| D | 12 | 233 | 111802 | 544.84 | 830 | 805 | 203.7 |
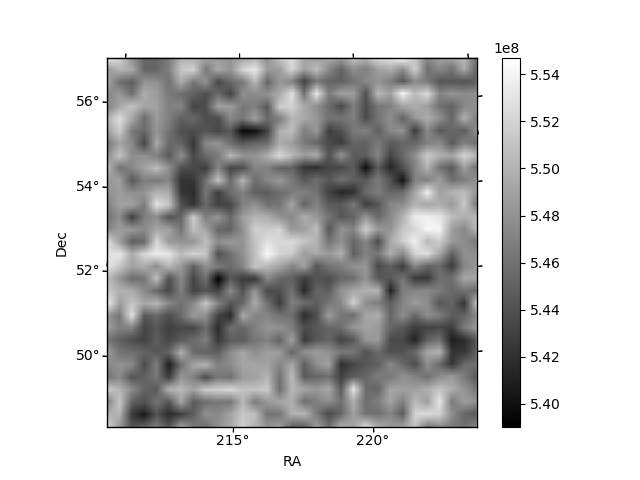
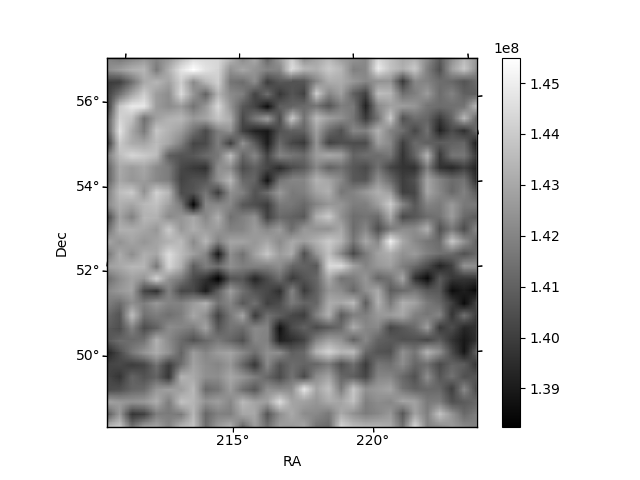
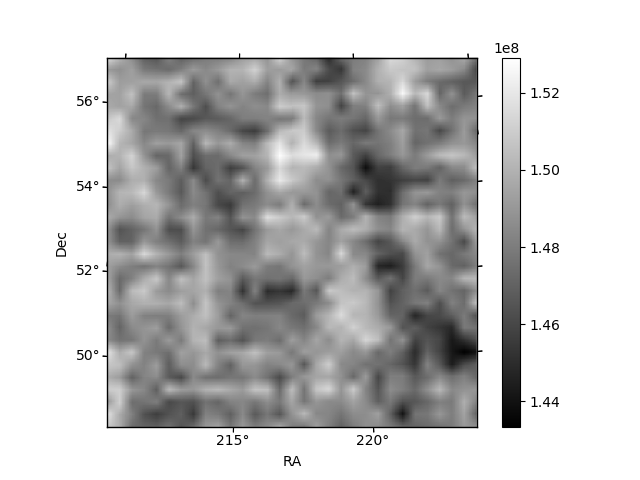
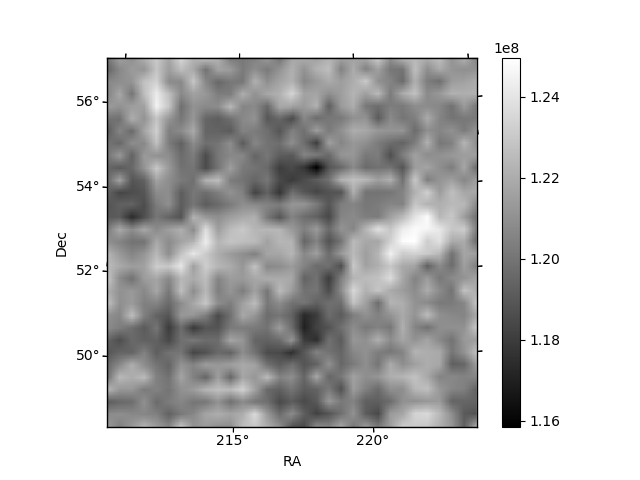
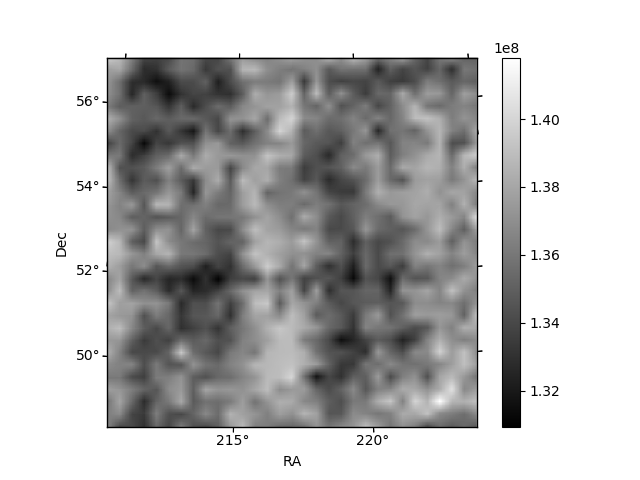
Histogram calculated using DETX and DETY for each event in the final _common_clean file
| Quadrant A | 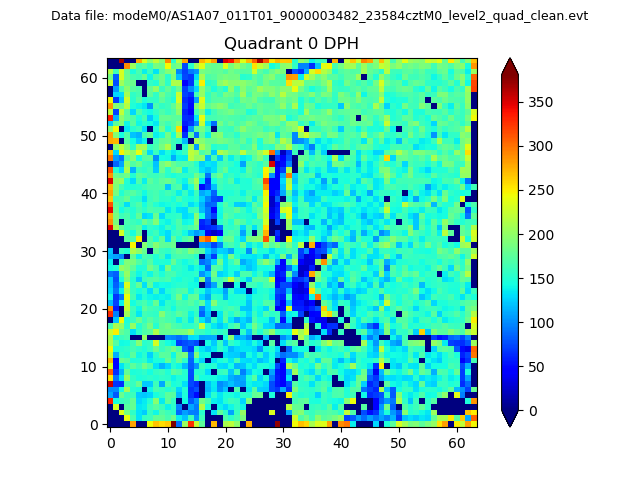 |
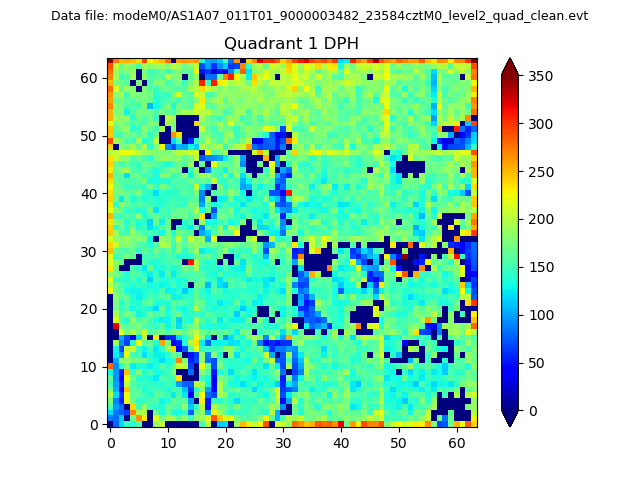 |
Quadrant B |
|---|---|---|---|
| Quadrant D | 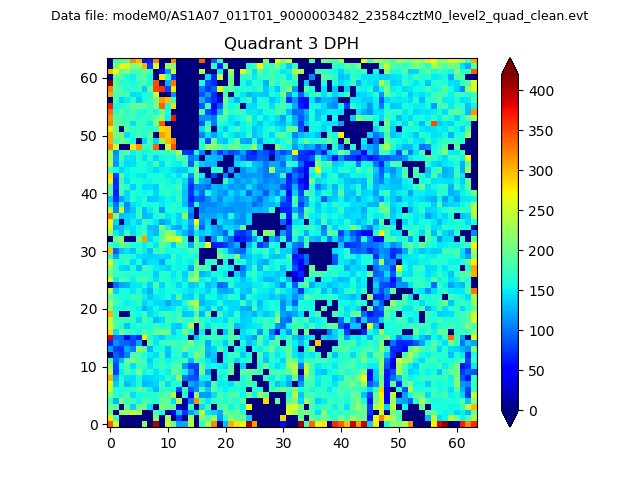 |
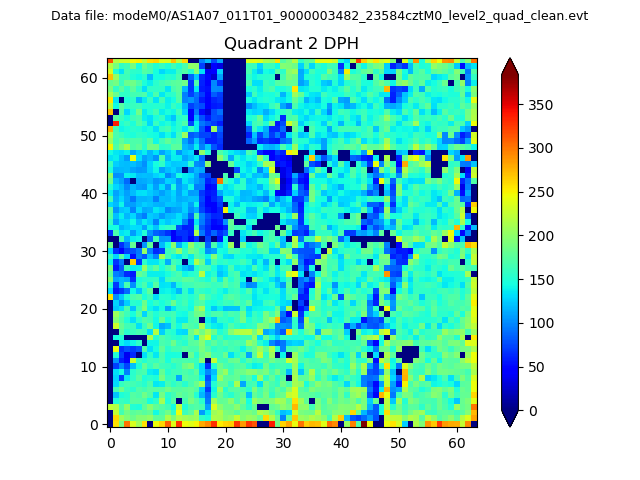 |
Quadrant C |
| Plot type | Count rate plots | Images |
|---|---|---|
| Comparison with Poisson distribution Blue bars denote a histogram of data divided into 1 sec bins. Red curve is a Poisson curve with rate = median count rate of data. |
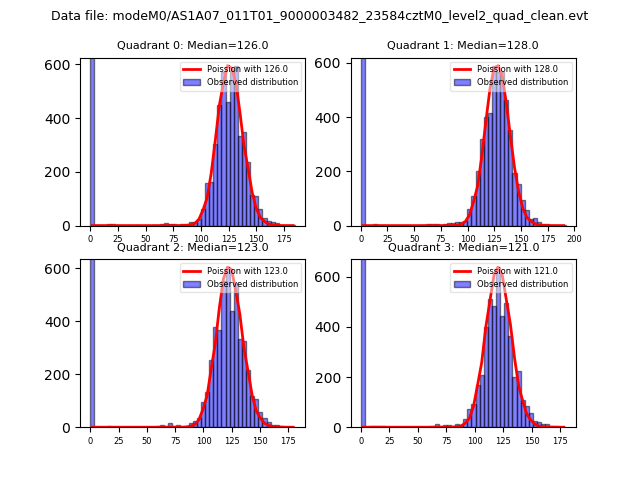 |
 |
| Quadrant-wise count rates Data is divided into 100 sec bins |
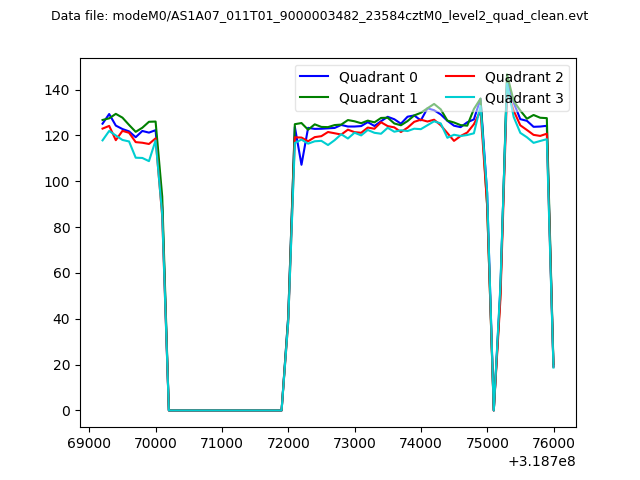 |
|
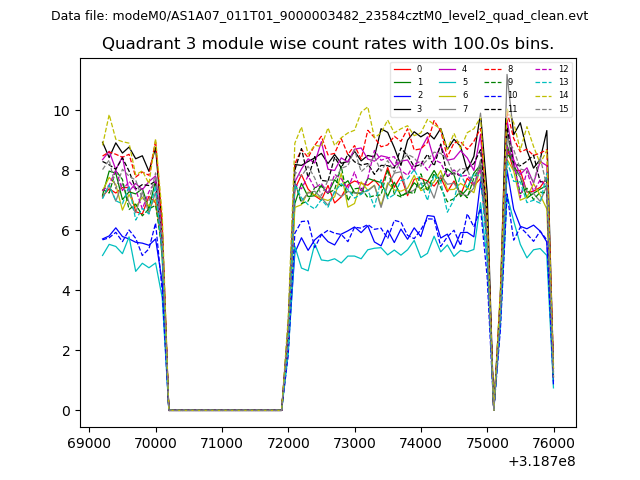
| Module-wise count rates for Quadrant A Data is divided into 100 sec bins |
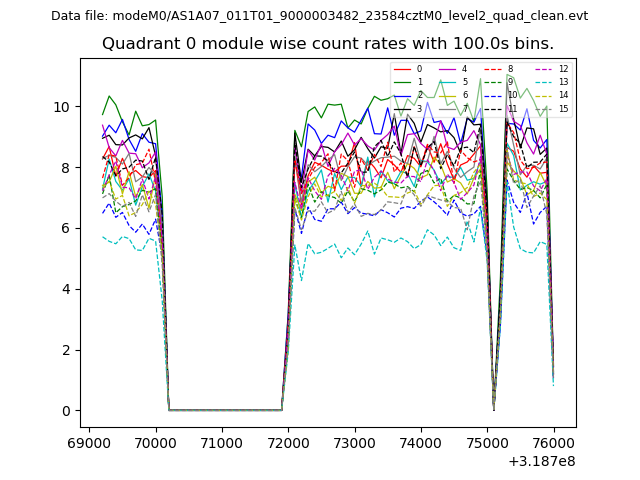 |
 |
| Module-wise count rates for Quadrant B Data is divided into 100 sec bins |
 |
 |
| Module-wise count rates for Quadrant C Data is divided into 100 sec bins |
 |
 |
| Module-wise count rates for Quadrant D Data is divided into 100 sec bins |
 |
 |
| Parameter | Plot |
|---|---|
| CZT HV Monitor |  |
| D_VDD | 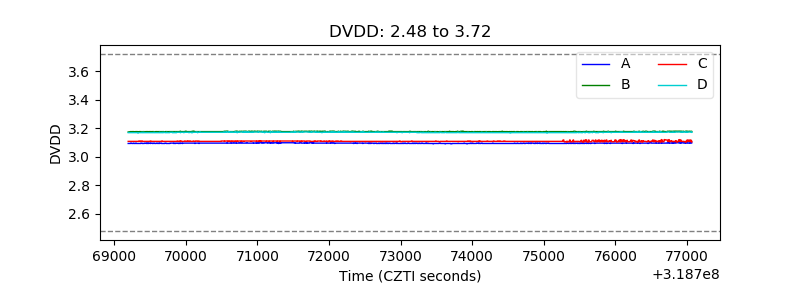 |
| Temperature 1 | 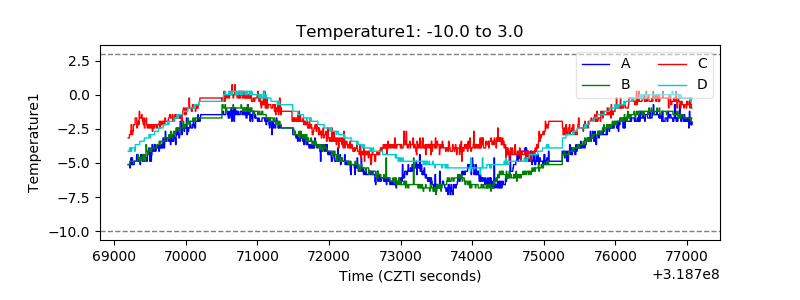 |
| Veto HV Monitor | 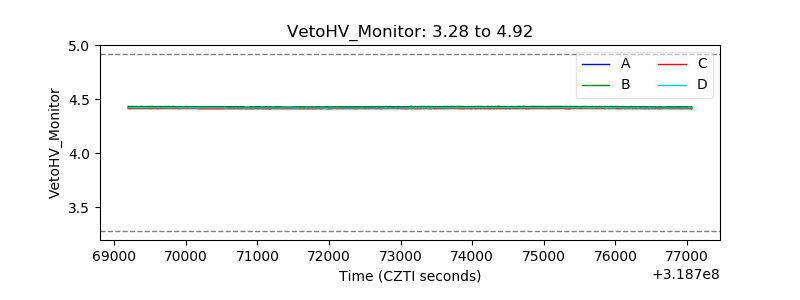 |
| Veto LLD | 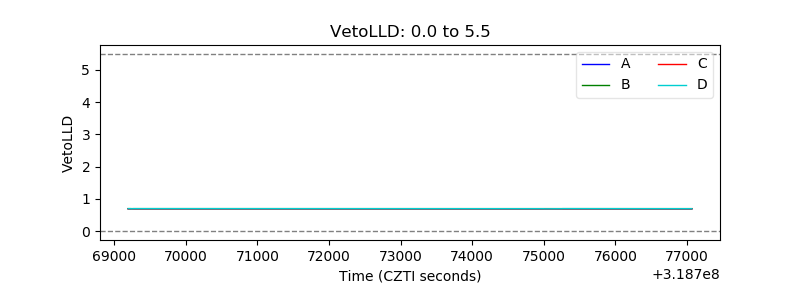 |
| Alpha Counter | 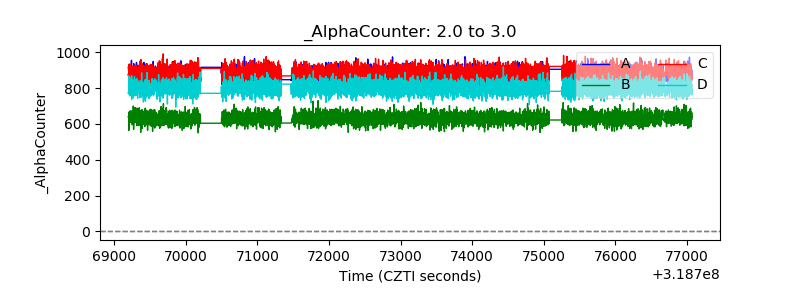 |
| _CPM_Rate | 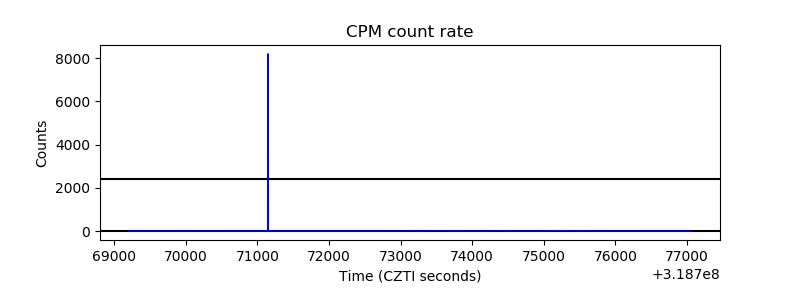 |
| CZT Counter | 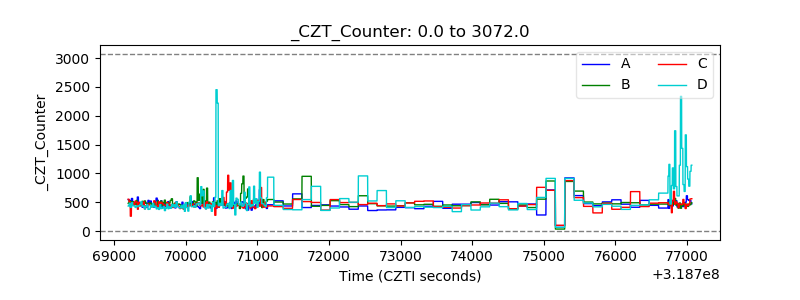 |
| +2.5 Volts monitor |  |
| +5 Volts monitor |  |
| _ROLL_ROT | 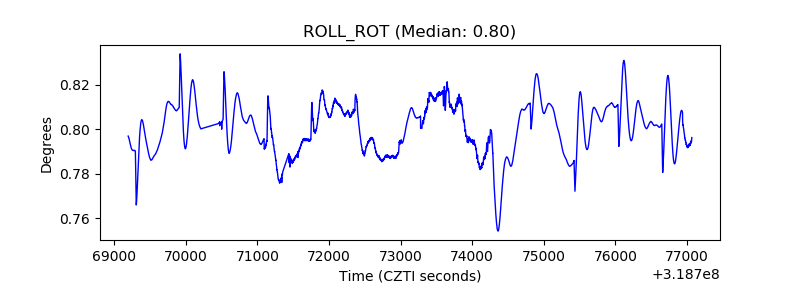 |
| _Roll_DEC | 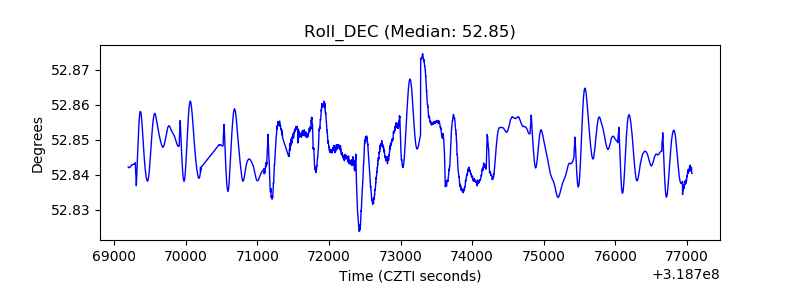 |
| _Roll_RA | 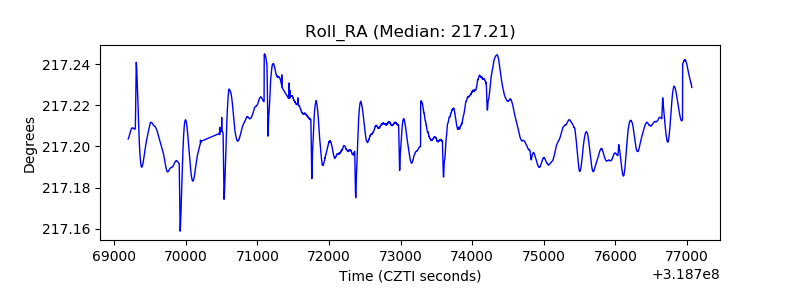 |
| Veto Counter | 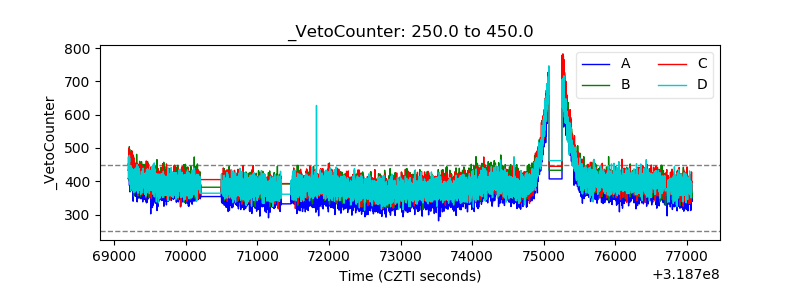 |