| Param | Original file | Final file |
|---|---|---|
| Filename | modeM0/AS1A07_024T04_9000003484cztM0_level2.fits | modeM0/AS1A07_024T04_9000003484cztM0_level2_quad_clean.evt |
| Size (bytes) | 98,925,120 | 89,893,440 |
| Size | 94.3 MB | 85.7 MB |
| Events in quadrant A | 602,446 | 519,345 |
| Events in quadrant B | 573,278 | 513,502 |
| Events in quadrant C | 586,384 | 497,987 |
| Events in quadrant D | 498,866 | 456,061 |
| Mode M0 | |||
|---|---|---|---|
| Quadrant | BADHDUFLAG | Total packets | Discarded packets |
| A | 0 | 23037 | 0 |
| B | 0 | 24760 | 0 |
| C | 0 | 22746 | 0 |
| D | 0 | 32657 | 0 |
| Mode M9 | |||
|---|---|---|---|
| Quadrant | BADHDUFLAG | Total packets | Discarded packets |
| A | 0 | 9 | 0 |
| B | 0 | 9 | 0 |
| C | 0 | 9 | 0 |
| D | 0 | 9 | 0 |
| Mode SS | |||
|---|---|---|---|
| Quadrant | BADHDUFLAG | Total packets | Discarded packets |
| A | 0 | 218 | 0 |
| B | 0 | 218 | 0 |
| C | 0 | 218 | 0 |
| D | 0 | 218 | 0 |
| Quadrant | Total seconds | Saturated seconds | Saturation percentage |
|---|---|---|---|
| A | 10604 | 87 | 0.820445% |
| B | 10602 | 285 | 2.688172% |
| C | 10604 | 144 | 1.357978% |
| D | 10603 | 794 | 7.488447% |
Noise dominated data is calculated using 1-second bins in cleaned event files. If a bin has >2000 counts, and if more than 50% of those come from <1% of pixels, then it is considered to be noise-dominated and hence unusable.
| Quadrant | # 1 sec bins | Bins with >0 counts | Bins with >2000 counts | High rate bins dominated by noise | Noise dominated (total time) | Noise dominated (detector-on time) | Marked lightcurve |
|---|---|---|---|---|---|---|---|
| A | 11578 | 10602 | 0 | 0 | 0.00% | 0.00% | 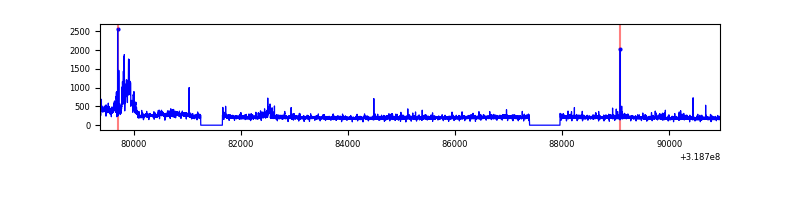 |
| B | 11579 | 10600 | 0 | 0 | 0.00% | 0.00% |  |
| C | 11579 | 10602 | 0 | 0 | 0.00% | 0.00% |  |
| D | 11579 | 10602 | 0 | 0 | 0.00% | 0.00% | 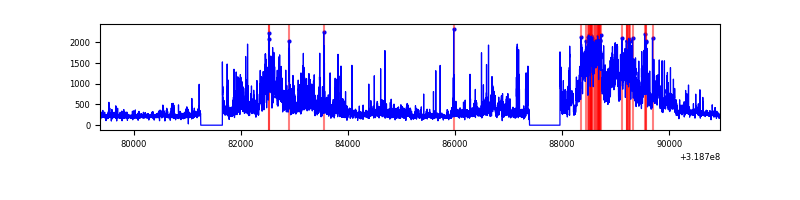 |
Top three noisy pixels from each quadrant. If the there are fewer than three noisy pixels in the level2.evt file, extra rows are filled as -1
| Pixel properties | Quadrant properties | ||||||
|---|---|---|---|---|---|---|---|
| Quadrant | DetID | PixID | Counts | Sigma | Mean | Median | Sigma |
| A | 0 | 29 | 583 | 10.34 | 156 | 146 | 42.3 |
| A | 7 | 110 | 472 | 7.71 | 156 | 146 | 42.3 |
| A | 14 | 79 | 471 | 7.69 | 156 | 146 | 42.3 |
| B | 2 | 9 | 431 | 8.82 | 151 | 143 | 32.6 |
| B | 5 | 128 | 391 | 7.6 | 151 | 143 | 32.6 |
| B | 14 | 254 | 385 | 7.41 | 151 | 143 | 32.6 |
| C | 9 | 242 | 410 | 6.48 | 155 | 144 | 41.1 |
| C | 3 | 235 | 402 | 6.28 | 155 | 144 | 41.1 |
| C | 9 | 233 | 401 | 6.26 | 155 | 144 | 41.1 |
| D | 4 | 246 | 400 | 6.85 | 142 | 128 | 39.7 |
| D | 6 | 231 | 360 | 5.84 | 142 | 128 | 39.7 |
| D | 3 | 14 | 358 | 5.79 | 142 | 128 | 39.7 |
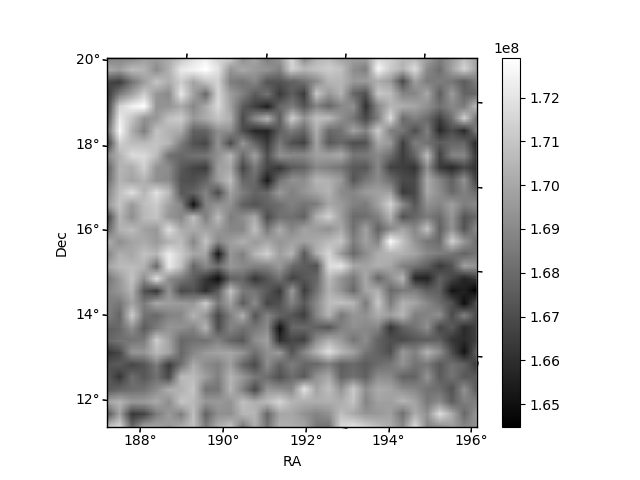
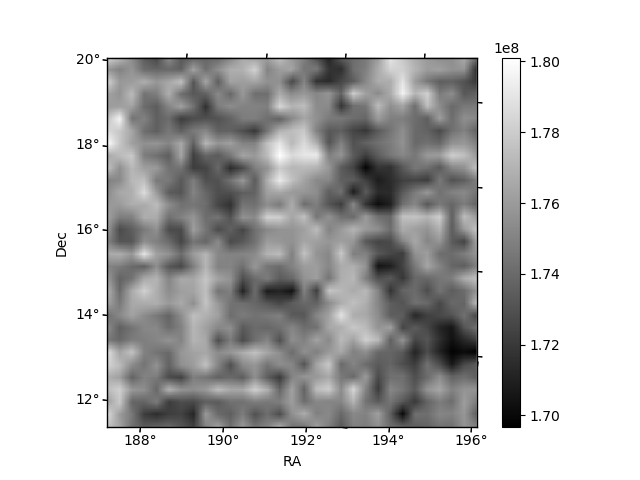
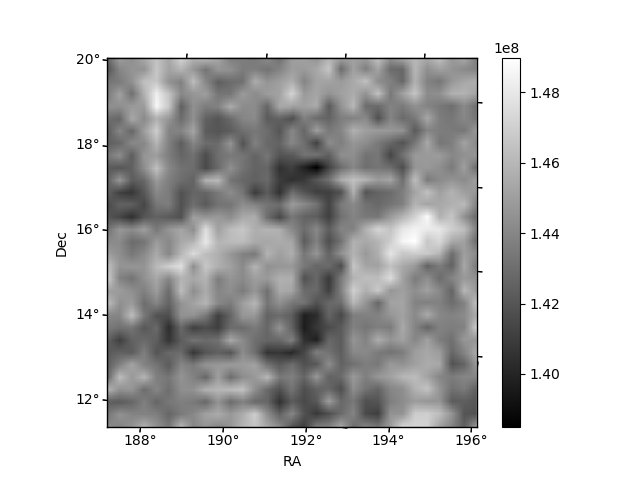
Histogram calculated using DETX and DETY for each event in the final _common_clean file
| Quadrant A | 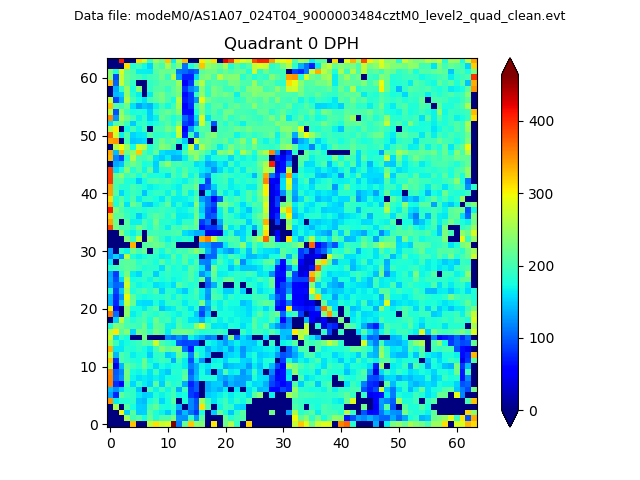 |
 |
Quadrant B |
|---|---|---|---|
| Quadrant D | 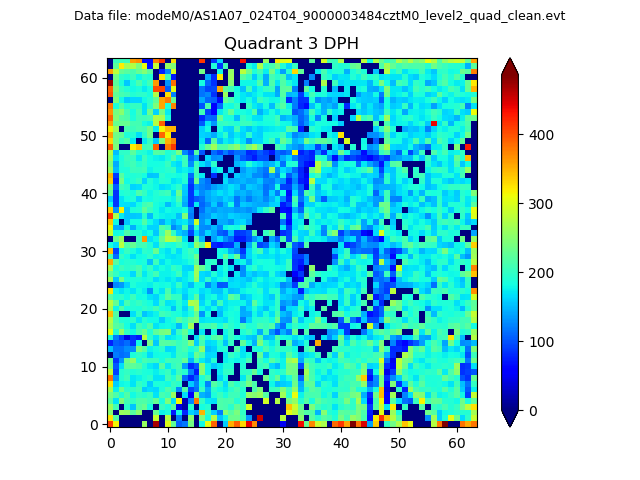 |
 |
Quadrant C |
| Plot type | Count rate plots | Images |
|---|---|---|
| Comparison with Poisson distribution Blue bars denote a histogram of data divided into 1 sec bins. Red curve is a Poisson curve with rate = median count rate of data. |
 |
 |
| Quadrant-wise count rates Data is divided into 100 sec bins |
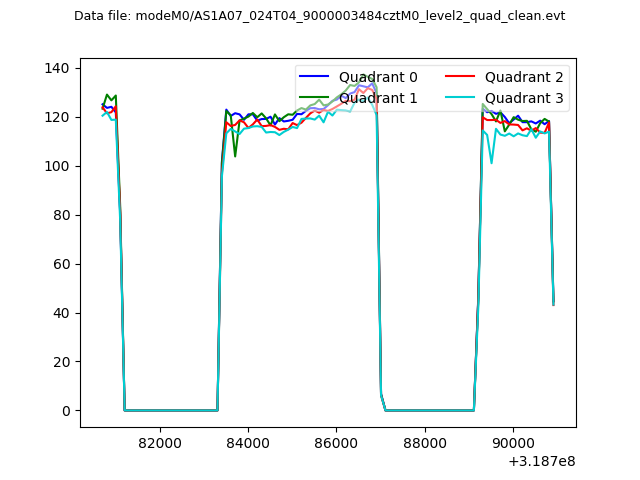 |
|
| Module-wise count rates for Quadrant A Data is divided into 100 sec bins |
 |
 |
| Module-wise count rates for Quadrant B Data is divided into 100 sec bins |
 |
 |
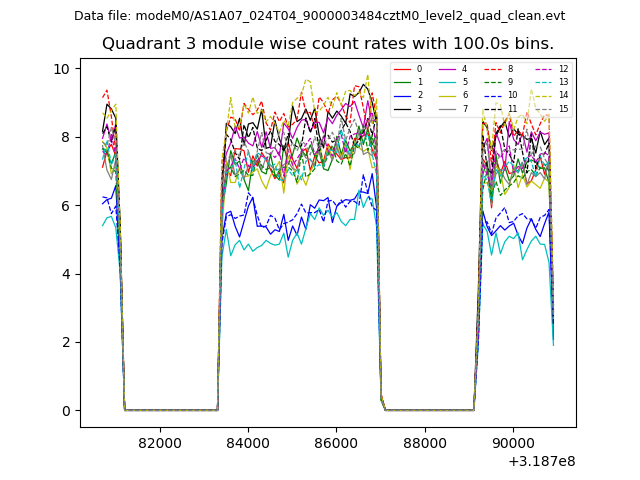
| Module-wise count rates for Quadrant C Data is divided into 100 sec bins |
 |
 |
| Module-wise count rates for Quadrant D Data is divided into 100 sec bins |
 |
 |
| Parameter | Plot |
|---|---|
| CZT HV Monitor |  |
| D_VDD | 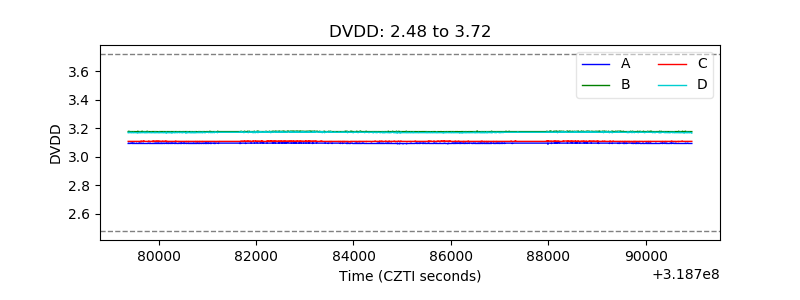 |
| Temperature 1 | 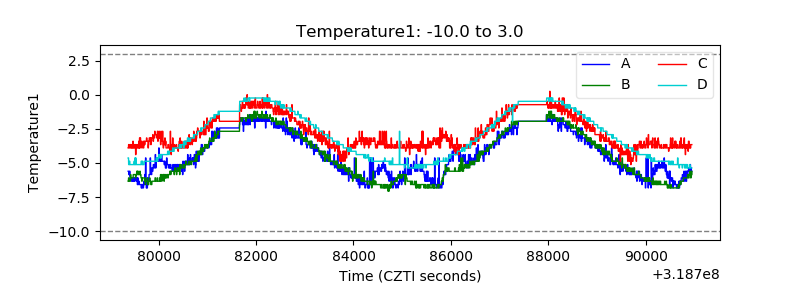 |
| Veto HV Monitor |  |
| Veto LLD | 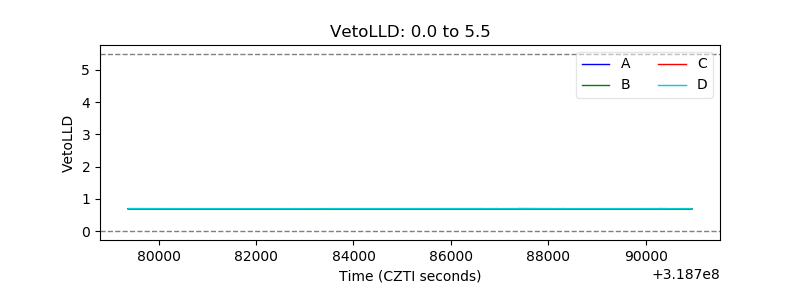 |
| Alpha Counter |  |
| _CPM_Rate |  |
| CZT Counter |  |
| +2.5 Volts monitor |  |
| +5 Volts monitor |  |
| _ROLL_ROT |  |
| _Roll_DEC | 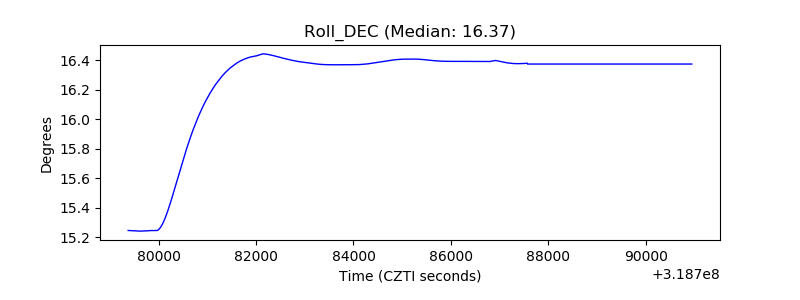 |
| _Roll_RA |  |
| Veto Counter |  |