| Param | Original file | Final file |
|---|---|---|
| Filename | modeM0/AS1A07_024T04_9000003484_23585cztM0_level2.evt | modeM0/AS1A07_024T04_9000003484_23585cztM0_level2_quad_clean.evt |
| Size (bytes) | 296,326,080 | 35,349,120 |
| Size | 282.6 MB | 33.7 MB |
| Events in quadrant A | 2,161,992 | 205,943 |
| Events in quadrant B | 2,191,059 | 209,136 |
| Events in quadrant C | 1,846,541 | 203,082 |
| Events in quadrant D | 2,533,857 | 201,615 |
| Mode M0 | |||
|---|---|---|---|
| Quadrant | BADHDUFLAG | Total packets | Discarded packets |
| A | 0 | 8618 | 1 |
| B | 0 | 8681 | 6 |
| C | 0 | 7550 | 1 |
| D | 0 | 9922 | 3 |
| Mode M9 | |||
|---|---|---|---|
| Quadrant | BADHDUFLAG | Total packets | Discarded packets |
| A | 0 | 4 | 0 |
| B | 0 | 4 | 0 |
| C | 0 | 4 | 0 |
| D | 0 | 4 | 0 |
| Mode SS | |||
|---|---|---|---|
| Quadrant | BADHDUFLAG | Total packets | Discarded packets |
| A | 0 | 74 | 0 |
| B | 0 | 74 | 0 |
| C | 0 | 74 | 0 |
| D | 0 | 74 | 0 |
| Quadrant | Total seconds | Saturated seconds | Saturation percentage |
|---|---|---|---|
| A | 3526 | 57 | 1.616563% |
| B | 3524 | 155 | 4.398411% |
| C | 3526 | 78 | 2.212138% |
| D | 3524 | 116 | 3.291714% |
Noise dominated data is calculated using 1-second bins in cleaned event files. If a bin has >2000 counts, and if more than 50% of those come from <1% of pixels, then it is considered to be noise-dominated and hence unusable.
| Quadrant | # 1 sec bins | Bins with >0 counts | Bins with >2000 counts | High rate bins dominated by noise | Noise dominated (total time) | Noise dominated (detector-on time) | Marked lightcurve |
|---|---|---|---|---|---|---|---|
| A | 3931 | 3526 | 7 | 7 | 0.18% | 0.20% | 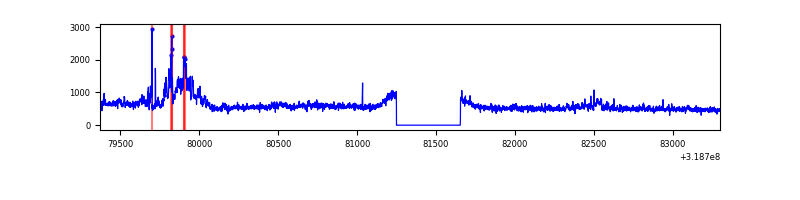 |
| B | 3931 | 3525 | 56 | 56 | 1.42% | 1.59% | 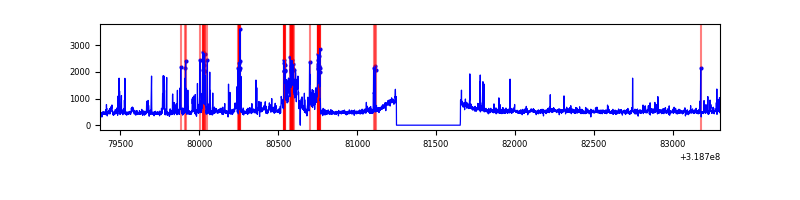 |
| C | 3931 | 3526 | 0 | 0 | 0.00% | 0.00% | 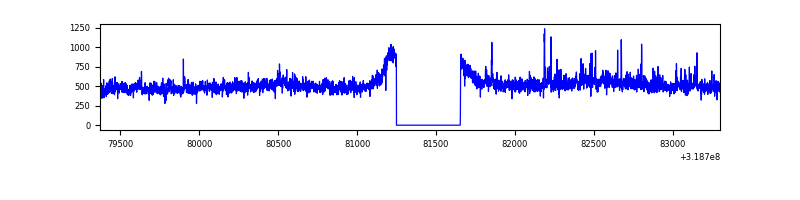 |
| D | 3930 | 3525 | 43 | 43 | 1.09% | 1.22% | 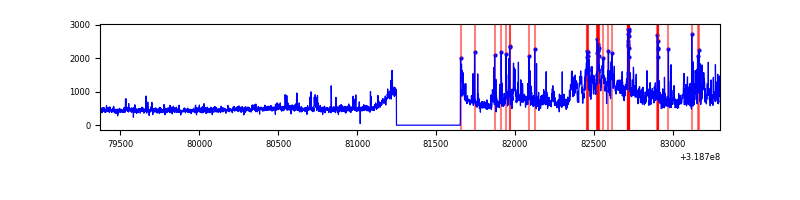 |
Top three noisy pixels from each quadrant. If the there are fewer than three noisy pixels in the level2.evt file, extra rows are filled as -1
| Pixel properties | Quadrant properties | ||||||
|---|---|---|---|---|---|---|---|
| Quadrant | DetID | PixID | Counts | Sigma | Mean | Median | Sigma |
| A | 15 | 174 | 376947 | 4034.36 | 452 | 441 | 93.3 |
| A | 6 | 16 | 40703 | 431.42 | 452 | 441 | 93.3 |
| A | 13 | 254 | 5724 | 56.61 | 452 | 441 | 93.3 |
| B | 3 | 64 | 395333 | 4500.98 | 443 | 432 | 87.7 |
| B | 0 | 189 | 30184 | 339.11 | 443 | 432 | 87.7 |
| B | 12 | 111 | 10557 | 115.4 | 443 | 432 | 87.7 |
| C | 10 | 9 | 82036 | 800.35 | 429 | 432 | 102.0 |
| C | 14 | 238 | 66179 | 644.83 | 429 | 432 | 102.0 |
| C | 7 | 247 | 19071 | 182.81 | 429 | 432 | 102.0 |
| D | 1 | 52 | 500756 | 4623.62 | 436 | 423 | 108.2 |
| D | 7 | 38 | 104855 | 965.06 | 436 | 423 | 108.2 |
| D | 7 | 223 | 101319 | 932.39 | 436 | 423 | 108.2 |
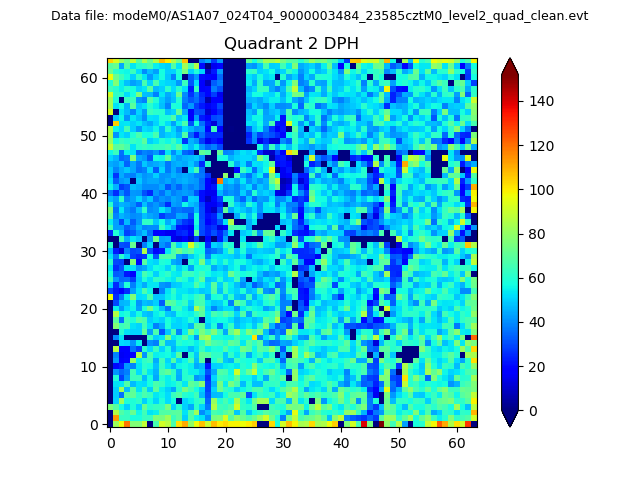
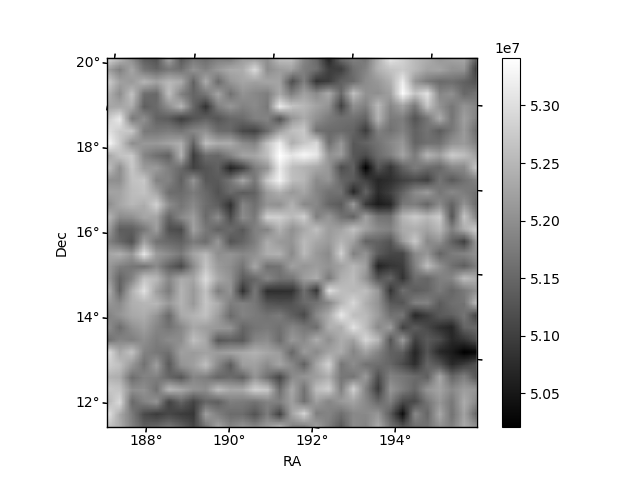
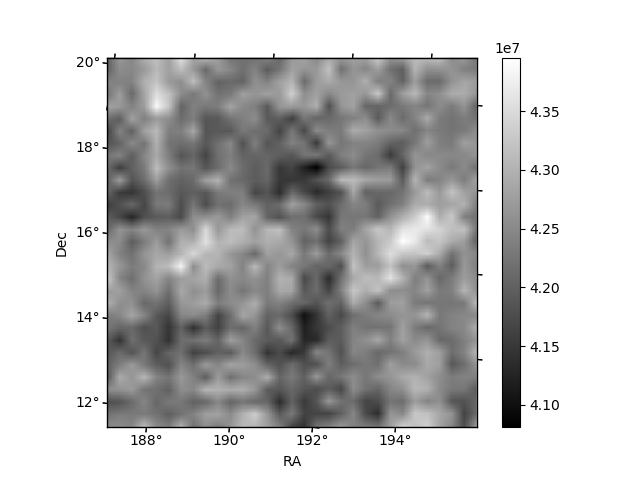
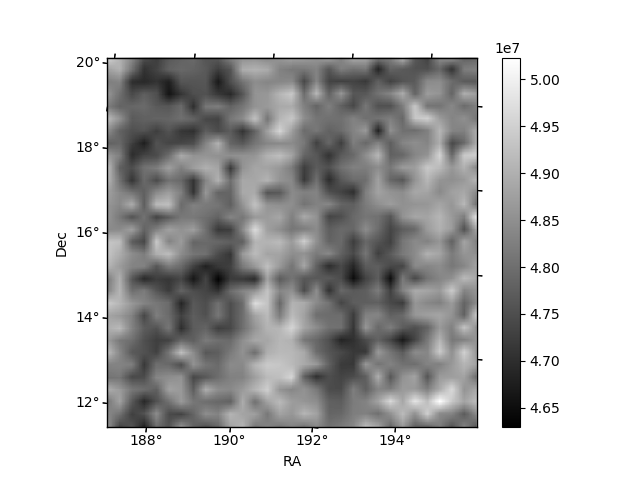
Histogram calculated using DETX and DETY for each event in the final _common_clean file
| Quadrant A | 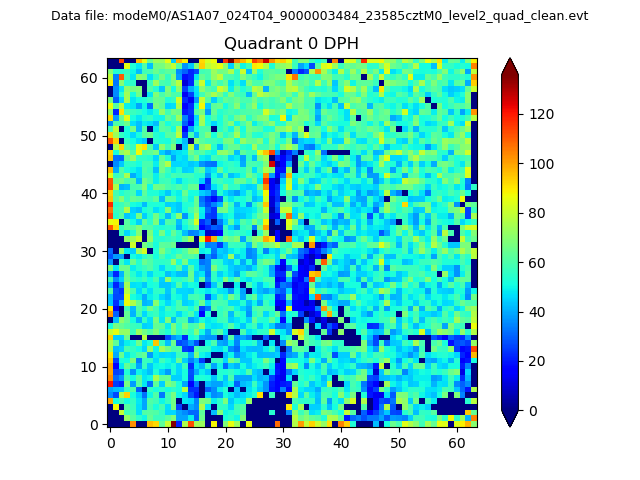 |
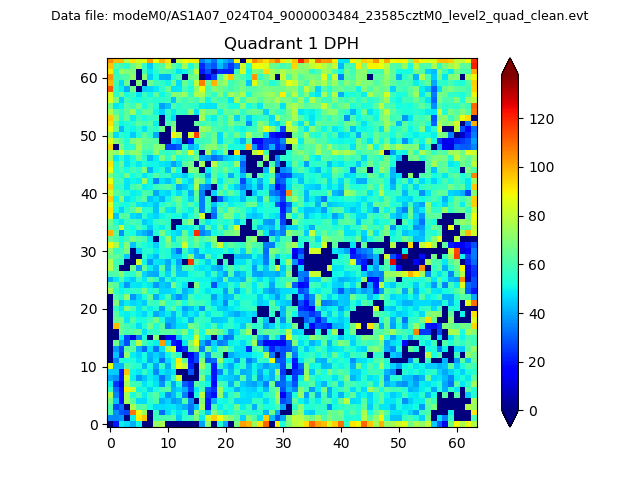 |
Quadrant B |
|---|---|---|---|
| Quadrant D | 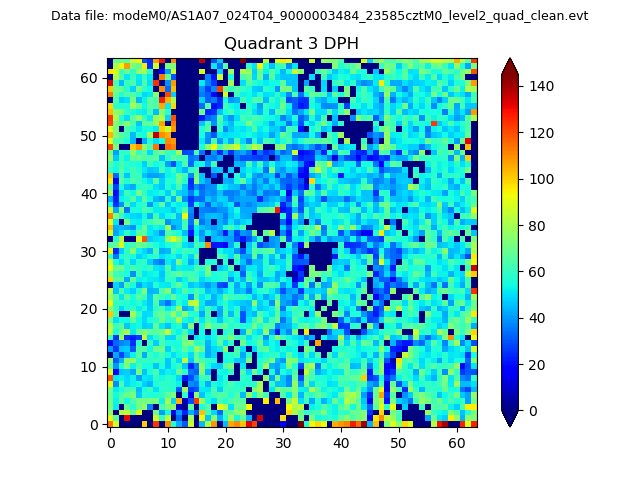 |
 |
Quadrant C |
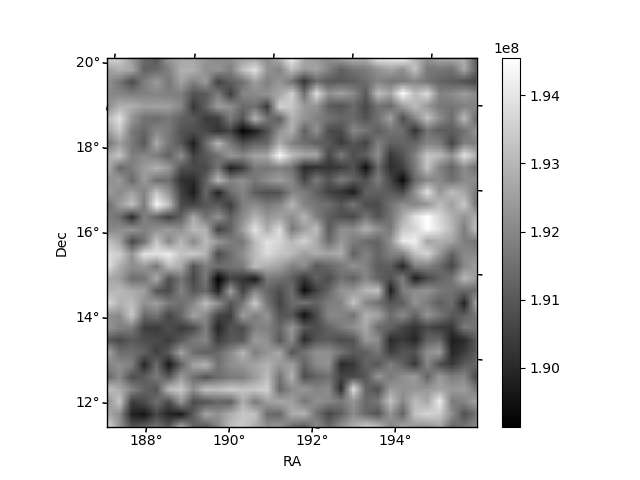
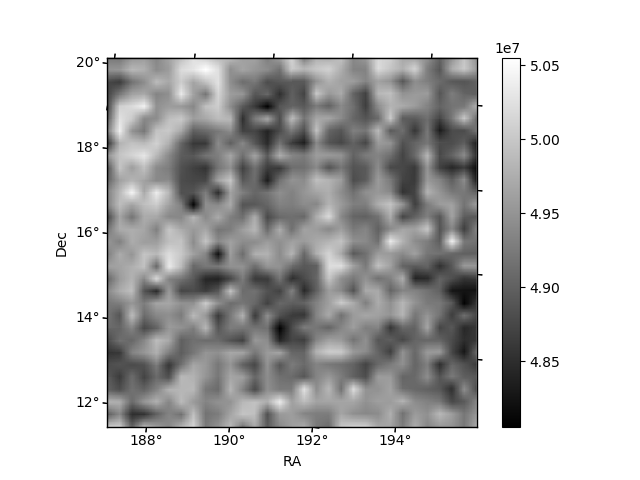
| Plot type | Count rate plots | Images |
|---|---|---|
| Comparison with Poisson distribution Blue bars denote a histogram of data divided into 1 sec bins. Red curve is a Poisson curve with rate = median count rate of data. |
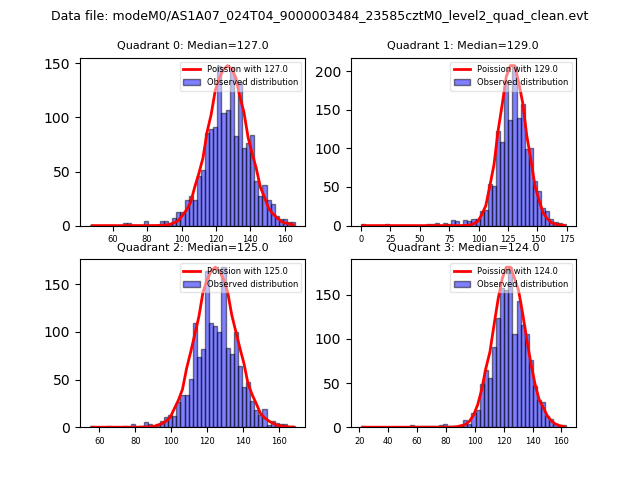 |
 |
| Quadrant-wise count rates Data is divided into 100 sec bins |
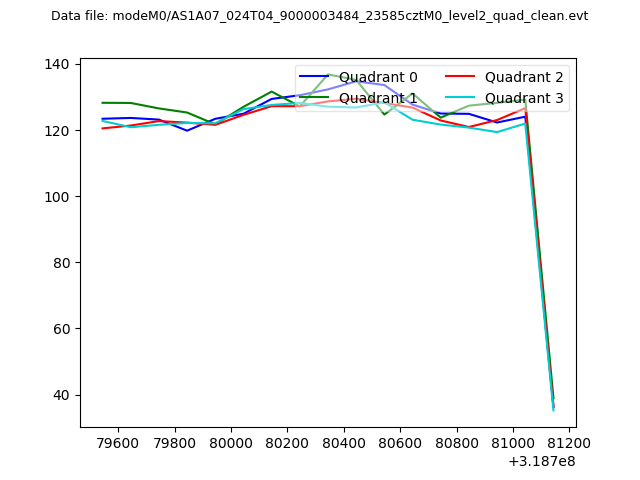 |
|
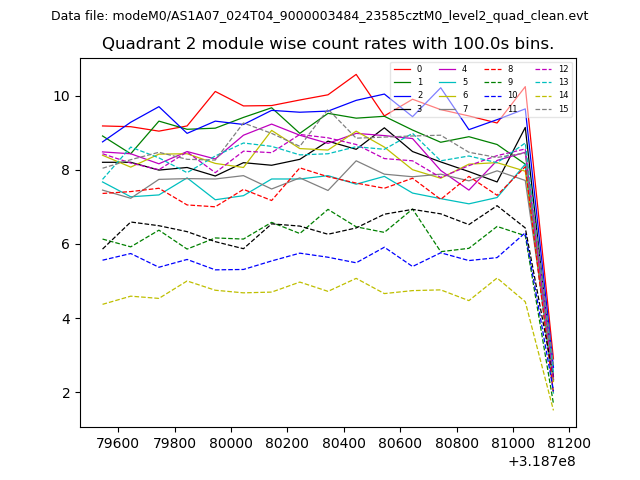
| Module-wise count rates for Quadrant A Data is divided into 100 sec bins |
 |
 |
| Module-wise count rates for Quadrant B Data is divided into 100 sec bins |
 |
 |
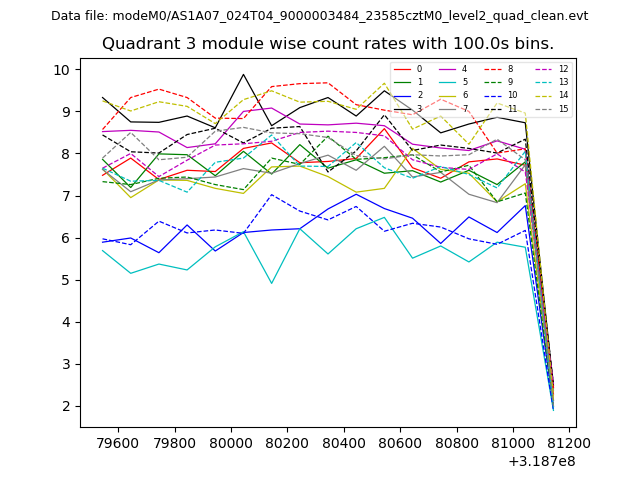
| Module-wise count rates for Quadrant C Data is divided into 100 sec bins |
 |
 |
| Module-wise count rates for Quadrant D Data is divided into 100 sec bins |
 |
 |
| Parameter | Plot |
|---|---|
| CZT HV Monitor | 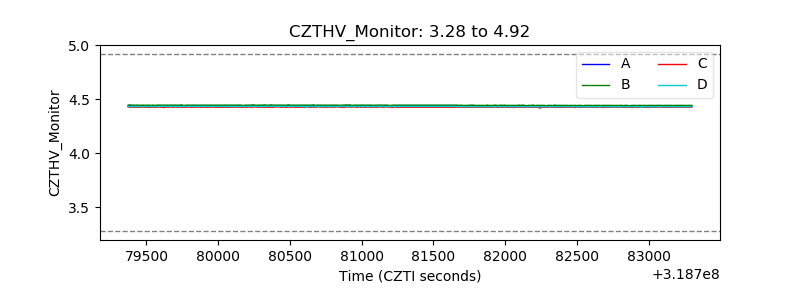 |
| D_VDD | 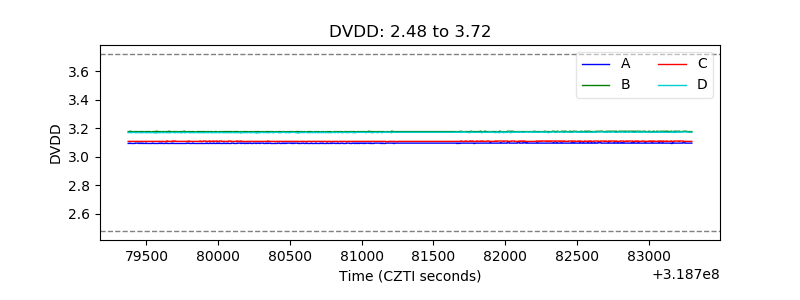 |
| Temperature 1 | 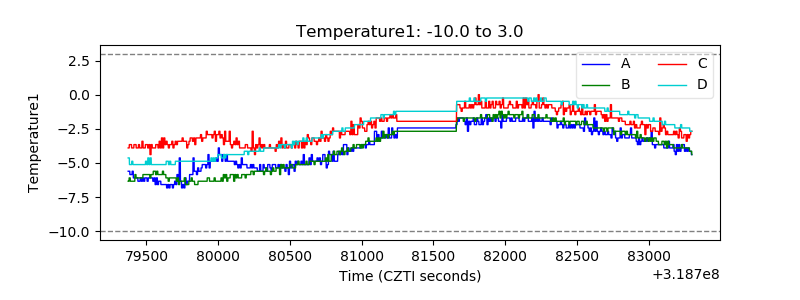 |
| Veto HV Monitor | 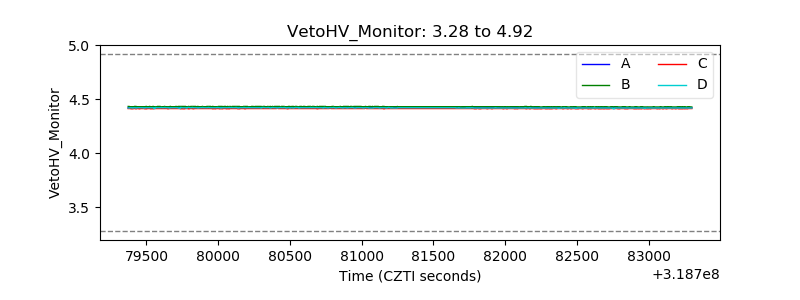 |
| Veto LLD | 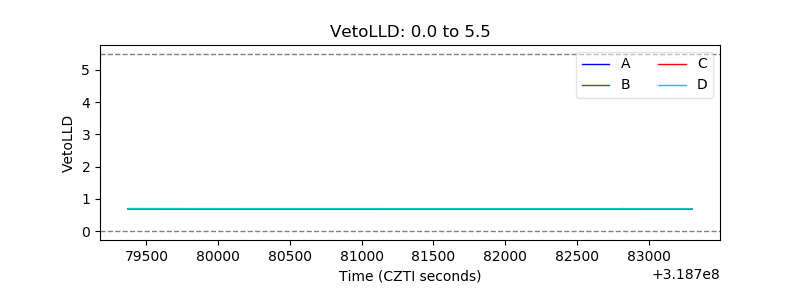 |
| Alpha Counter | 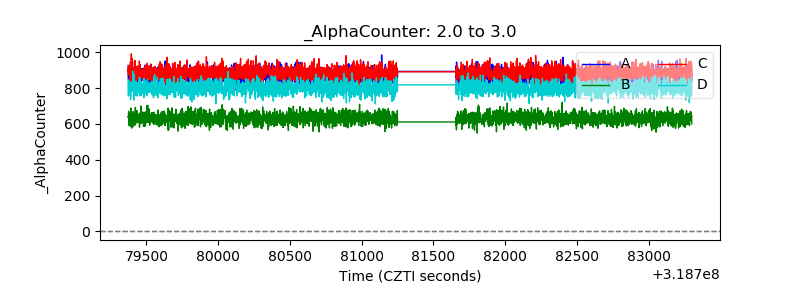 |
| _CPM_Rate | 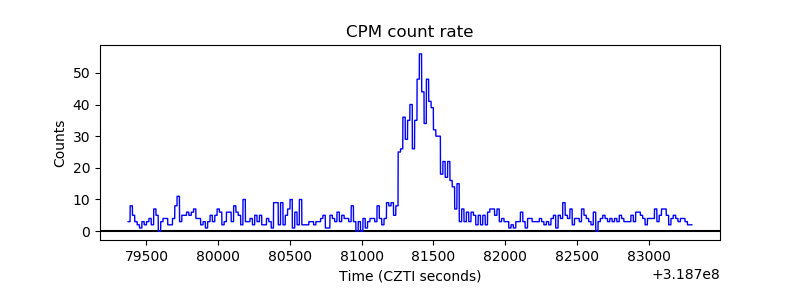 |
| CZT Counter | 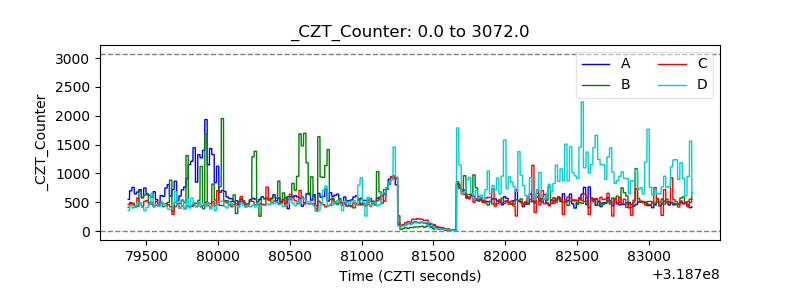 |
| +2.5 Volts monitor | 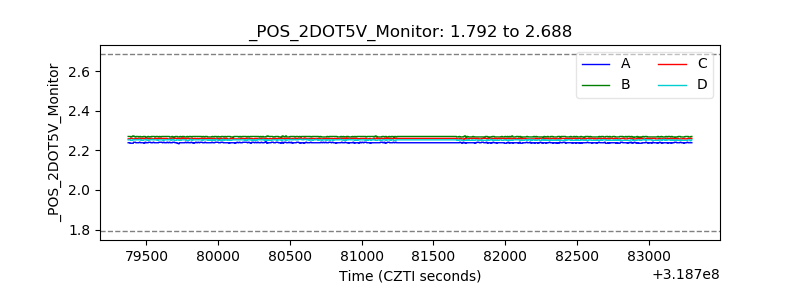 |
| +5 Volts monitor | 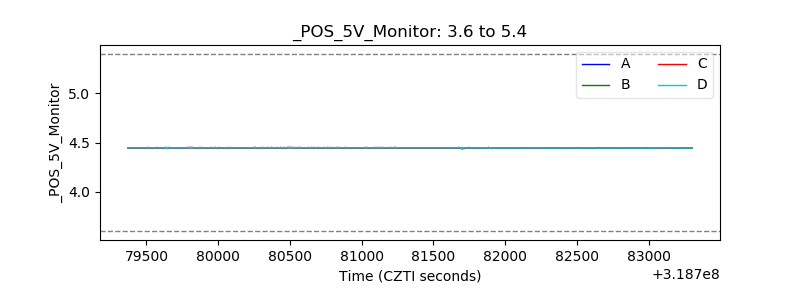 |
| _ROLL_ROT | 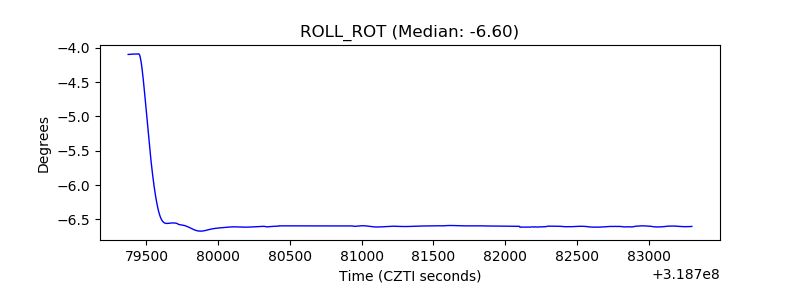 |
| _Roll_DEC | 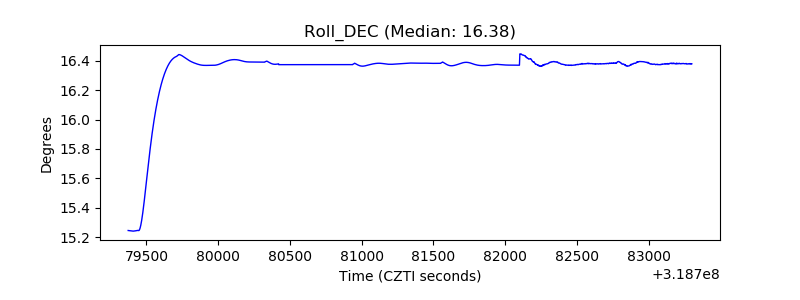 |
| _Roll_RA | 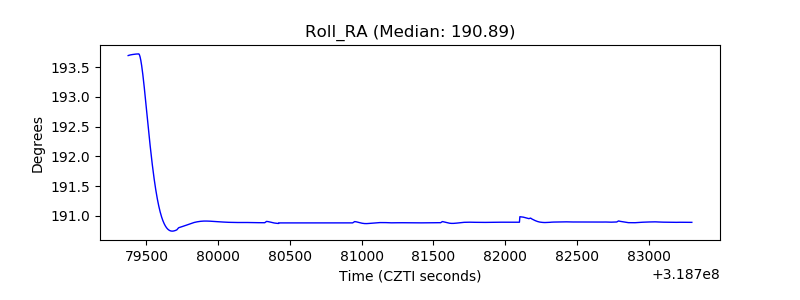 |
| Veto Counter | 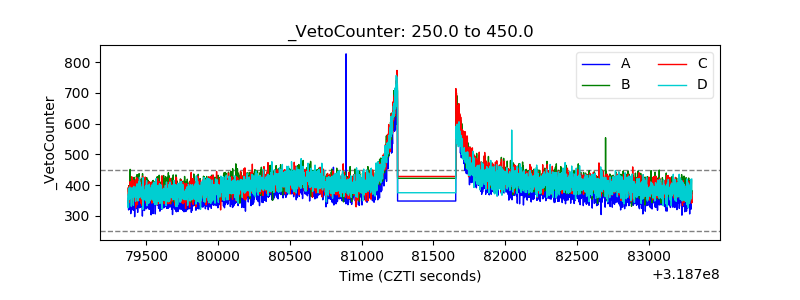 |