| Param | Original file | Final file |
|---|---|---|
| Filename | modeM0/AS1A07_024T04_9000003484_23587cztM0_level2.evt | modeM0/AS1A07_024T04_9000003484_23587cztM0_level2_quad_clean.evt |
| Size (bytes) | 738,181,440 | 108,397,440 |
| Size | 704.0 MB | 103.4 MB |
| Events in quadrant A | 4,333,220 | 673,965 |
| Events in quadrant B | 4,965,204 | 676,978 |
| Events in quadrant C | 4,589,954 | 660,183 |
| Events in quadrant D | 7,854,650 | 643,151 |
| Mode M0 | |||
|---|---|---|---|
| Quadrant | BADHDUFLAG | Total packets | Discarded packets |
| A | 0 | 18772 | 2 |
| B | 0 | 20558 | 2 |
| C | 0 | 19606 | 2 |
| D | 0 | 29479 | 2 |
| Mode M9 | |||
|---|---|---|---|
| Quadrant | BADHDUFLAG | Total packets | Discarded packets |
| A | 0 | 9 | 0 |
| B | 0 | 9 | 0 |
| C | 0 | 9 | 0 |
| D | 0 | 9 | 0 |
| Mode SS | |||
|---|---|---|---|
| Quadrant | BADHDUFLAG | Total packets | Discarded packets |
| A | 0 | 186 | 0 |
| B | 0 | 186 | 0 |
| C | 0 | 186 | 0 |
| D | 0 | 186 | 0 |
| Quadrant | Total seconds | Saturated seconds | Saturation percentage |
|---|---|---|---|
| A | 9052 | 77 | 0.850641% |
| B | 9053 | 206 | 2.275489% |
| C | 9053 | 141 | 1.557495% |
| D | 9053 | 793 | 8.759527% |
Noise dominated data is calculated using 1-second bins in cleaned event files. If a bin has >2000 counts, and if more than 50% of those come from <1% of pixels, then it is considered to be noise-dominated and hence unusable.
| Quadrant | # 1 sec bins | Bins with >0 counts | Bins with >2000 counts | High rate bins dominated by noise | Noise dominated (total time) | Noise dominated (detector-on time) | Marked lightcurve |
|---|---|---|---|---|---|---|---|
| A | 10027 | 9053 | 1 | 1 | 0.01% | 0.01% | 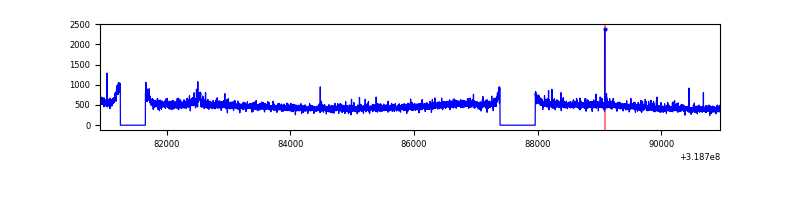 |
| B | 10028 | 9054 | 81 | 81 | 0.81% | 0.89% | 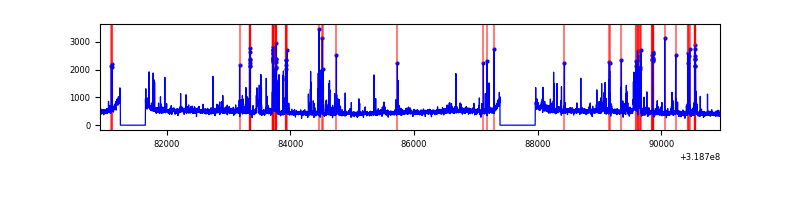 |
| C | 10028 | 9053 | 0 | 0 | 0.00% | 0.00% | 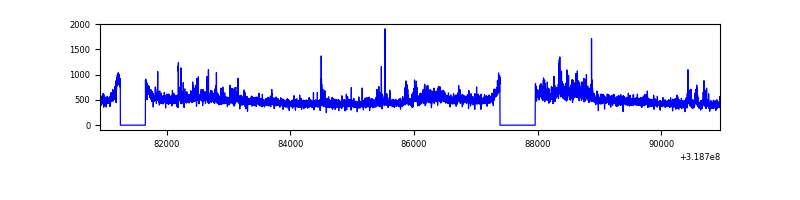 |
| D | 10028 | 9053 | 598 | 598 | 5.96% | 6.61% | 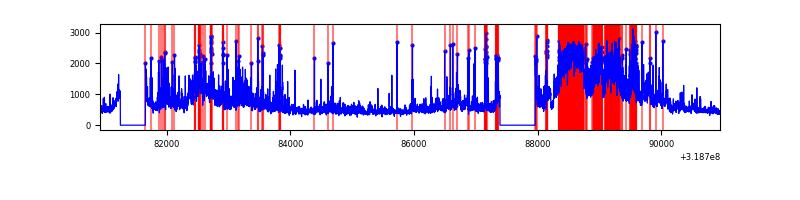 |
Top three noisy pixels from each quadrant. If the there are fewer than three noisy pixels in the level2.evt file, extra rows are filled as -1
| Pixel properties | Quadrant properties | ||||||
|---|---|---|---|---|---|---|---|
| Quadrant | DetID | PixID | Counts | Sigma | Mean | Median | Sigma |
| A | 6 | 16 | 83278 | 370.89 | 1093 | 1068 | 221.7 |
| A | 15 | 174 | 34904 | 152.65 | 1093 | 1068 | 221.7 |
| A | 13 | 254 | 15565 | 65.4 | 1093 | 1068 | 221.7 |
| B | 3 | 64 | 497850 | 2365.08 | 1083 | 1055 | 210.1 |
| B | 0 | 189 | 86725 | 407.85 | 1083 | 1055 | 210.1 |
| B | 0 | 245 | 49032 | 228.4 | 1083 | 1055 | 210.1 |
| C | 10 | 9 | 284699 | 1149.53 | 1049 | 1058 | 246.7 |
| C | 14 | 238 | 164353 | 661.79 | 1049 | 1058 | 246.7 |
| C | 7 | 247 | 41781 | 165.04 | 1049 | 1058 | 246.7 |
| D | 7 | 223 | 1822677 | 7133.84 | 1037 | 1006 | 255.4 |
| D | 1 | 52 | 1118509 | 4376.25 | 1037 | 1006 | 255.4 |
| D | 9 | 85 | 251001 | 979.0 | 1037 | 1006 | 255.4 |
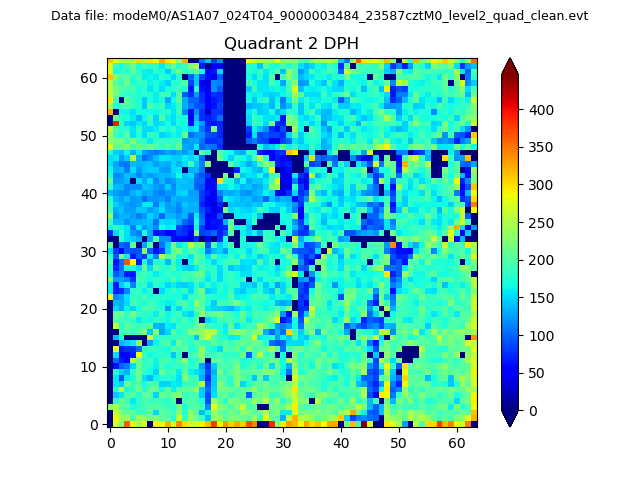
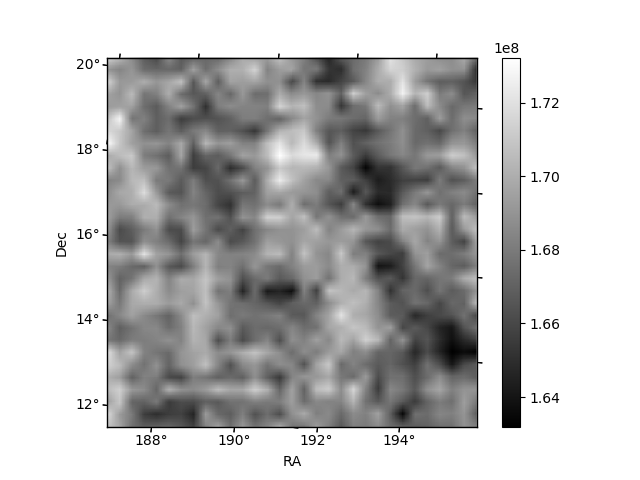
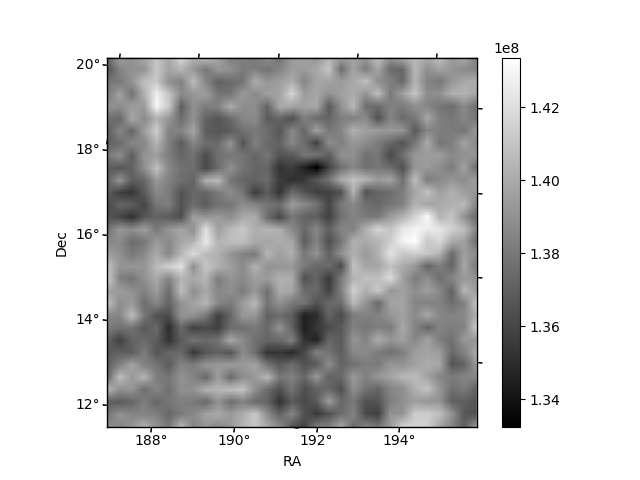
Histogram calculated using DETX and DETY for each event in the final _common_clean file
| Quadrant A | 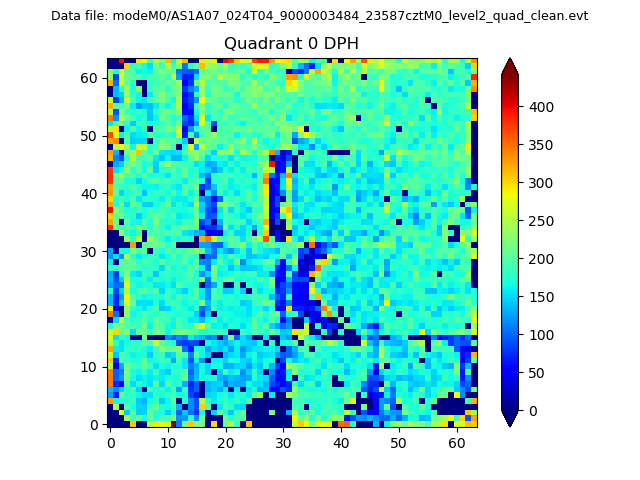 |
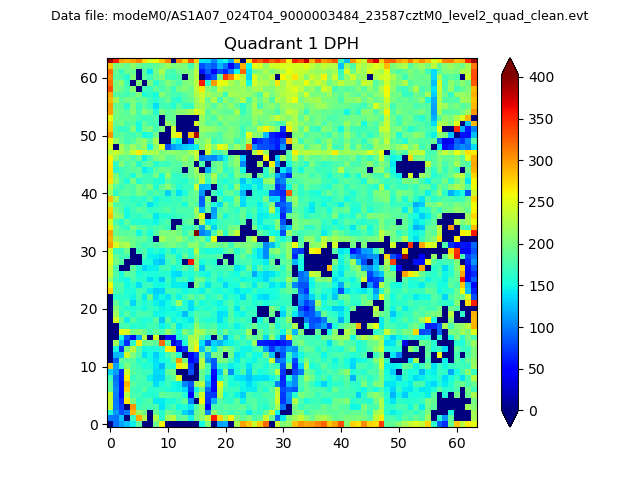 |
Quadrant B |
|---|---|---|---|
| Quadrant D | 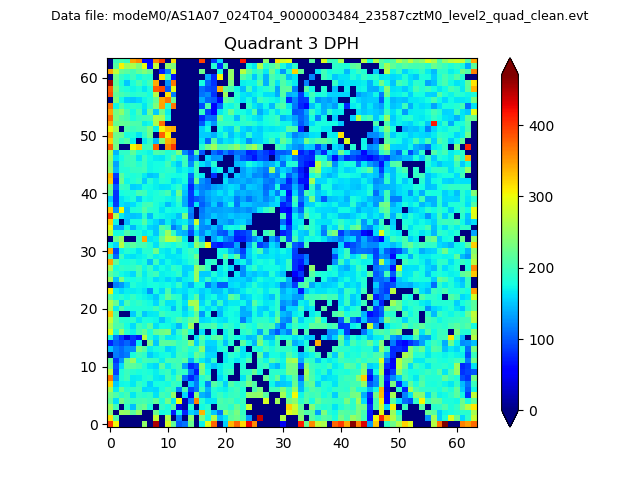 |
 |
Quadrant C |
| Plot type | Count rate plots | Images |
|---|---|---|
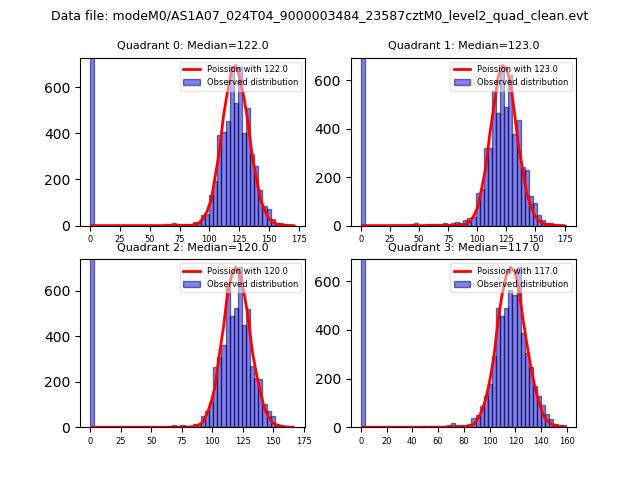
| Comparison with Poisson distribution Blue bars denote a histogram of data divided into 1 sec bins. Red curve is a Poisson curve with rate = median count rate of data. |
 |
 |
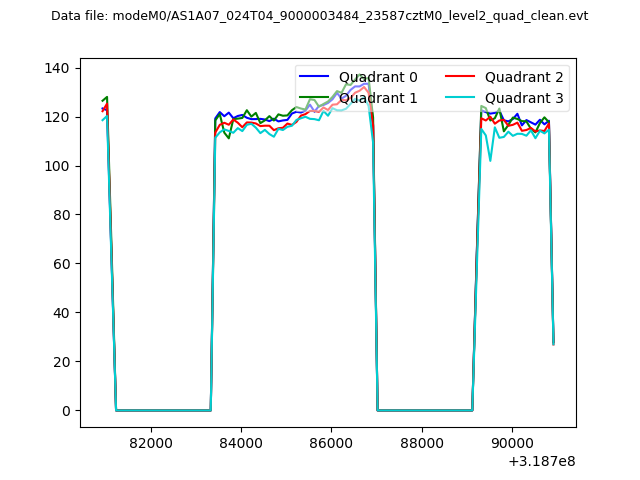
| Quadrant-wise count rates Data is divided into 100 sec bins |
 |
|
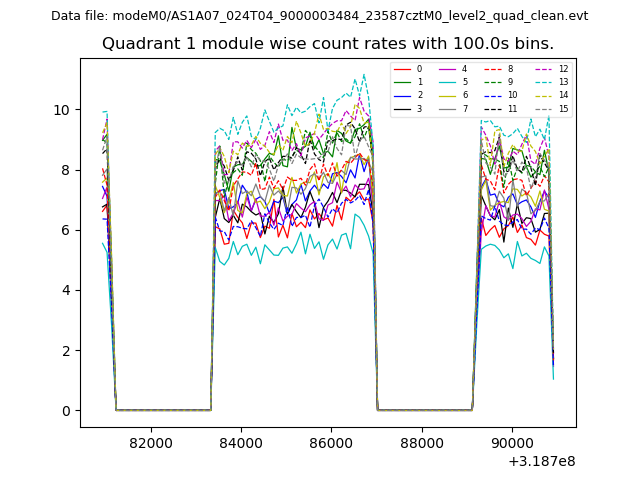
| Module-wise count rates for Quadrant A Data is divided into 100 sec bins |
 |
 |
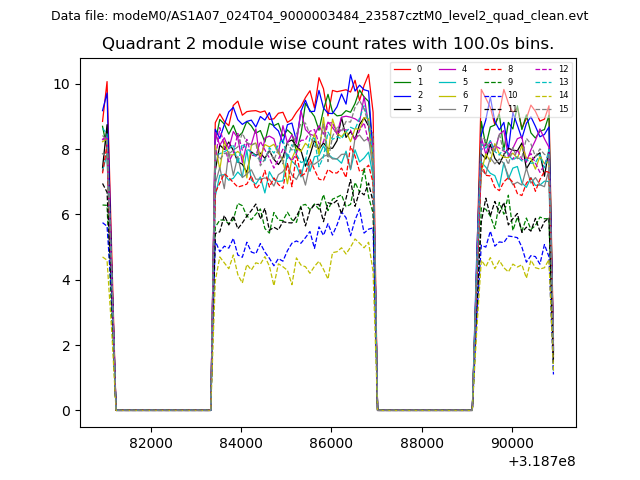
| Module-wise count rates for Quadrant B Data is divided into 100 sec bins |
 |
 |
| Module-wise count rates for Quadrant C Data is divided into 100 sec bins |
 |
 |
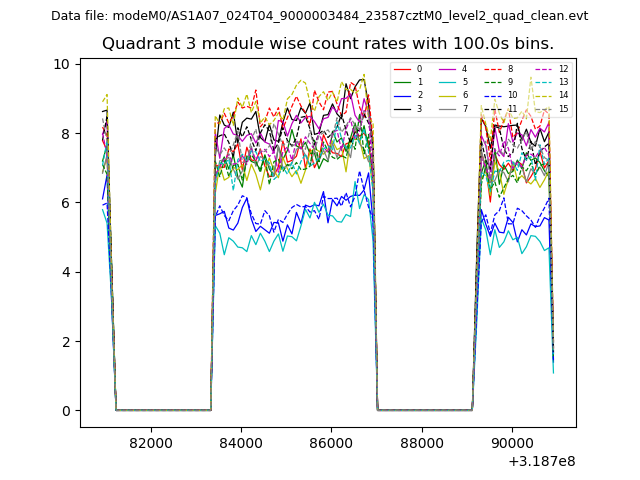
| Module-wise count rates for Quadrant D Data is divided into 100 sec bins |
 |
 |
| Parameter | Plot |
|---|---|
| CZT HV Monitor | 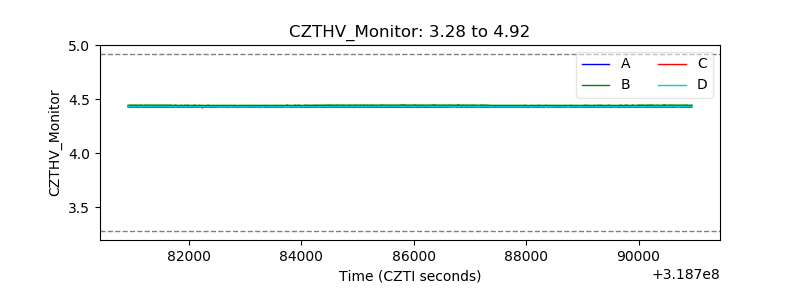 |
| D_VDD | 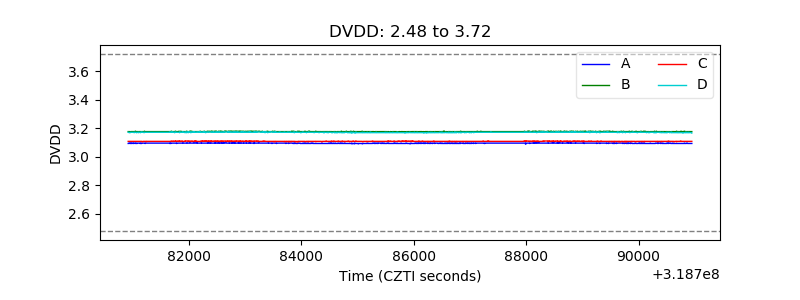 |
| Temperature 1 | 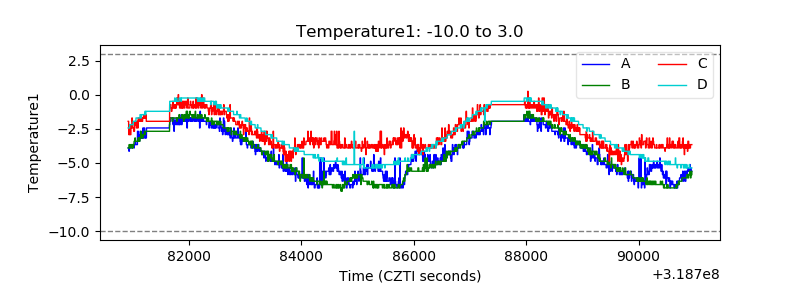 |
| Veto HV Monitor | 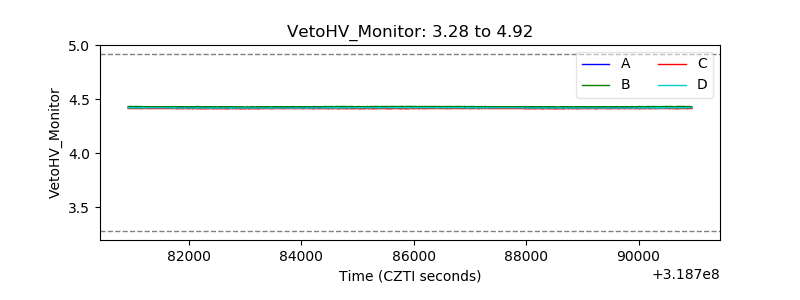 |
| Veto LLD | 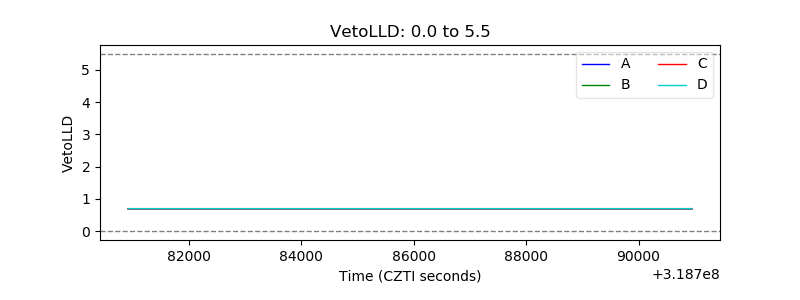 |
| Alpha Counter | 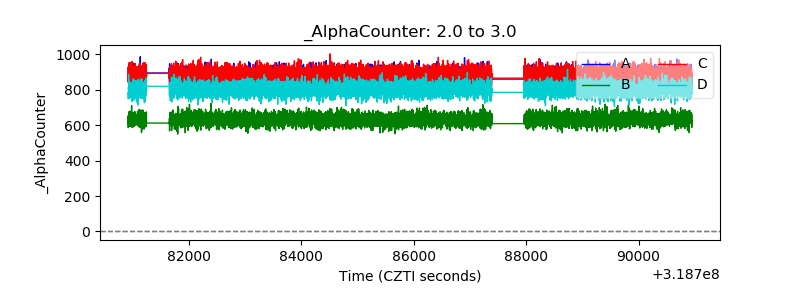 |
| _CPM_Rate | 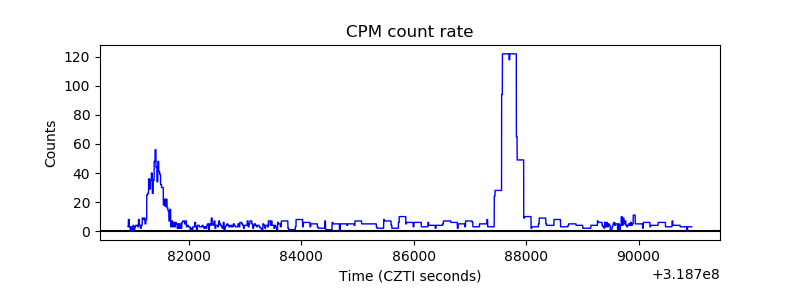 |
| CZT Counter | 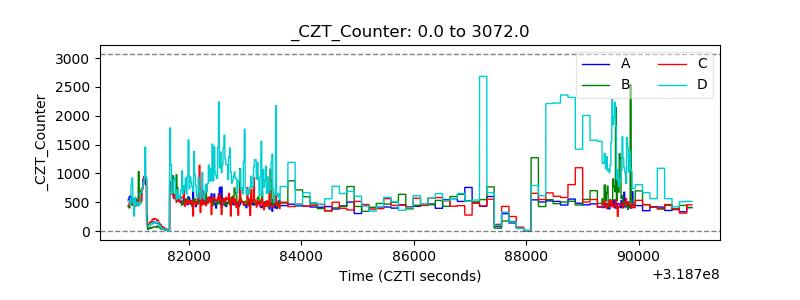 |
| +2.5 Volts monitor |  |
| +5 Volts monitor |  |
| _ROLL_ROT | 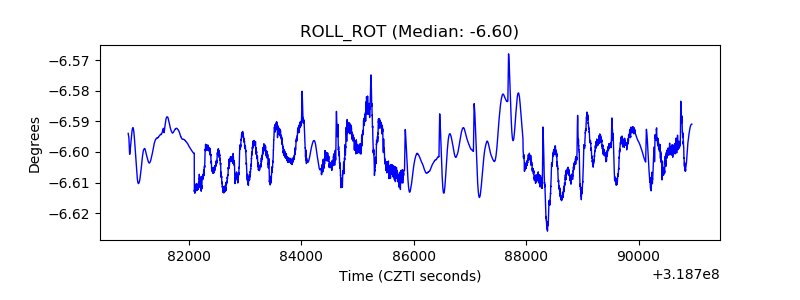 |
| _Roll_DEC | 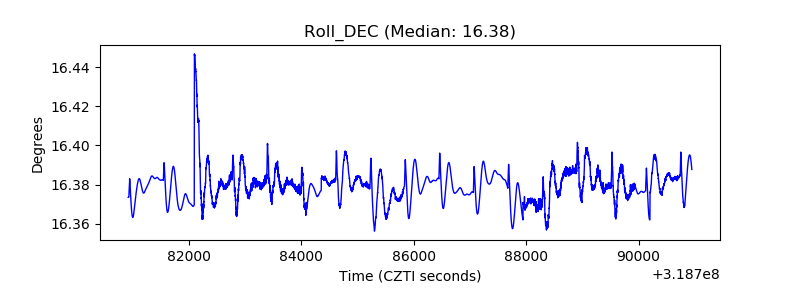 |
| _Roll_RA | 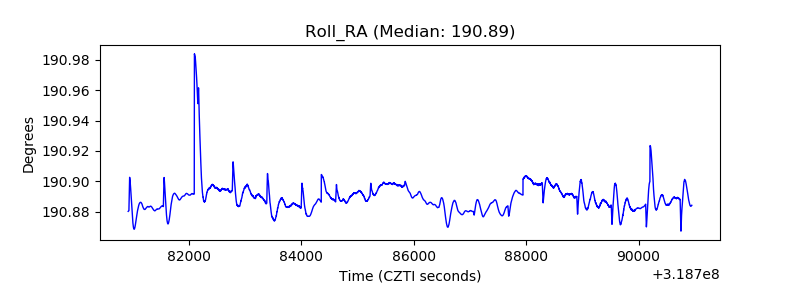 |
| Veto Counter | 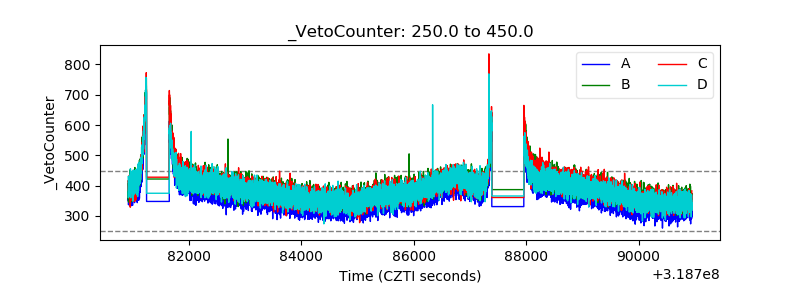 |