| Param | Original file | Final file |
|---|---|---|
| Filename | modeM0/AS1A07_054T01_9000003486cztM0_level2.fits | modeM0/AS1A07_054T01_9000003486cztM0_level2_quad_clean.evt |
| Size (bytes) | 716,002,560 | 951,661,440 |
| Size | 682.8 MB | 907.6 MB |
| Events in quadrant A | 4,430,412 | 6,289,546 |
| Events in quadrant B | 4,180,234 | 6,148,029 |
| Events in quadrant C | 4,237,256 | 5,863,853 |
| Events in quadrant D | 3,710,140 | 5,398,332 |
| Mode SS | |||
|---|---|---|---|
| Quadrant | BADHDUFLAG | Total packets | Discarded packets |
| A | 0 | 1528 | 0 |
| B | 0 | 1530 | 0 |
| C | 0 | 1530 | 0 |
| D | 0 | 1530 | 0 |
| Mode M9 | |||
|---|---|---|---|
| Quadrant | BADHDUFLAG | Total packets | Discarded packets |
| A | 0 | 124 | 0 |
| B | 0 | 125 | 0 |
| C | 0 | 125 | 0 |
| D | 0 | 125 | 0 |
| Mode M0 | |||
|---|---|---|---|
| Quadrant | BADHDUFLAG | Total packets | Discarded packets |
| A | 0 | 153147 | 0 |
| B | 0 | 171431 | 0 |
| C | 0 | 161081 | 0 |
| D | 0 | 186729 | 0 |
| Quadrant | Total seconds | Saturated seconds | Saturation percentage |
|---|---|---|---|
| A | 74736 | 633 | 0.846981% |
| B | 74730 | 2215 | 2.964004% |
| C | 74731 | 1790 | 2.395258% |
| D | 74721 | 1565 | 2.094458% |
Noise dominated data is calculated using 1-second bins in cleaned event files. If a bin has >2000 counts, and if more than 50% of those come from <1% of pixels, then it is considered to be noise-dominated and hence unusable.
| Quadrant | # 1 sec bins | Bins with >0 counts | Bins with >2000 counts | High rate bins dominated by noise | Noise dominated (total time) | Noise dominated (detector-on time) | Marked lightcurve |
|---|---|---|---|---|---|---|---|
| A | 91812 | 74748 | 0 | 0 | 0.00% | 0.00% | 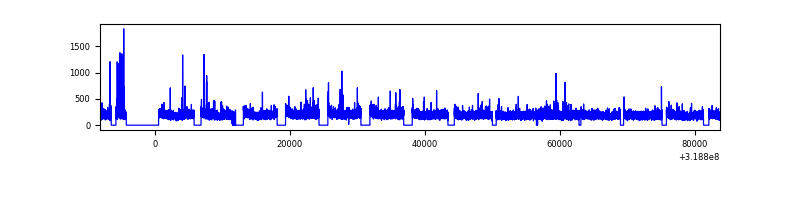 |
| B | 91812 | 74728 | 0 | 0 | 0.00% | 0.00% | 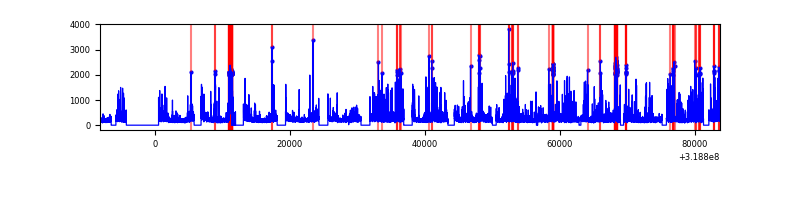 |
| C | 91812 | 74663 | 0 | 0 | 0.00% | 0.00% | 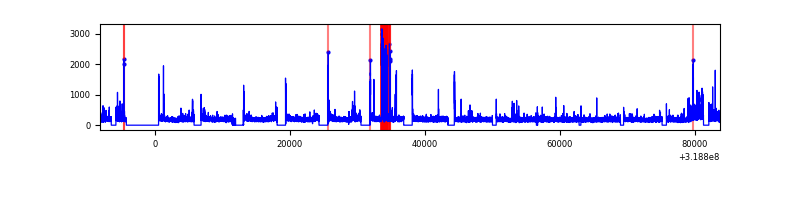 |
| D | 91812 | 74720 | 0 | 0 | 0.00% | 0.00% | 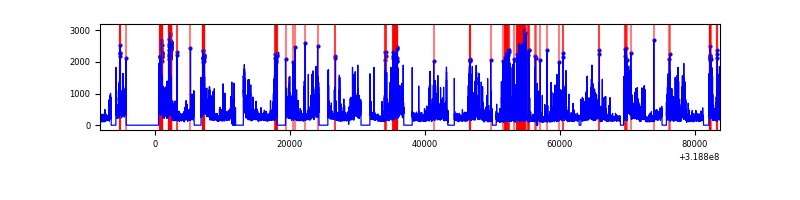 |
Top three noisy pixels from each quadrant. If the there are fewer than three noisy pixels in the level2.evt file, extra rows are filled as -1
| Pixel properties | Quadrant properties | ||||||
|---|---|---|---|---|---|---|---|
| Quadrant | DetID | PixID | Counts | Sigma | Mean | Median | Sigma |
| A | 0 | 29 | 4581 | 12.25 | 1153 | 1086 | 285.3 |
| A | 7 | 110 | 3555 | 8.66 | 1153 | 1086 | 285.3 |
| A | 0 | 30 | 3439 | 8.25 | 1153 | 1086 | 285.3 |
| B | 2 | 9 | 3398 | 10.88 | 1109 | 1063 | 214.6 |
| B | 2 | 8 | 2796 | 8.07 | 1109 | 1063 | 214.6 |
| B | 5 | 128 | 2742 | 7.82 | 1109 | 1063 | 214.6 |
| C | 12 | 241 | 2988 | 6.77 | 1120 | 1050 | 286.1 |
| C | 3 | 126 | 2903 | 6.48 | 1120 | 1050 | 286.1 |
| C | 9 | 242 | 2858 | 6.32 | 1120 | 1050 | 286.1 |
| D | 3 | 14 | 2783 | 6.46 | 1056 | 960 | 282.2 |
| D | 15 | 46 | 2643 | 5.96 | 1056 | 960 | 282.2 |
| D | 10 | 189 | 2616 | 5.87 | 1056 | 960 | 282.2 |
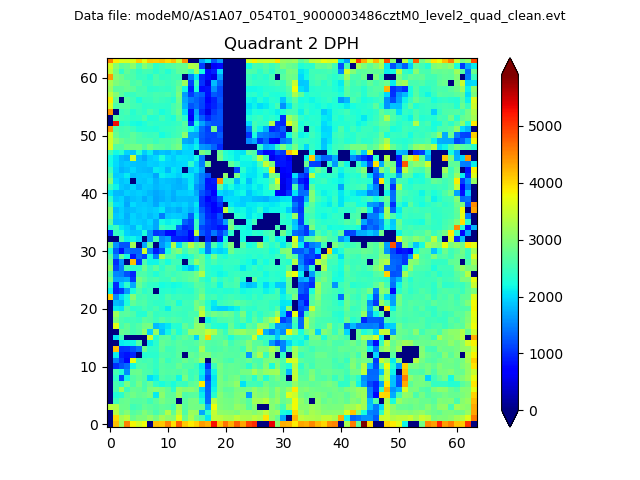
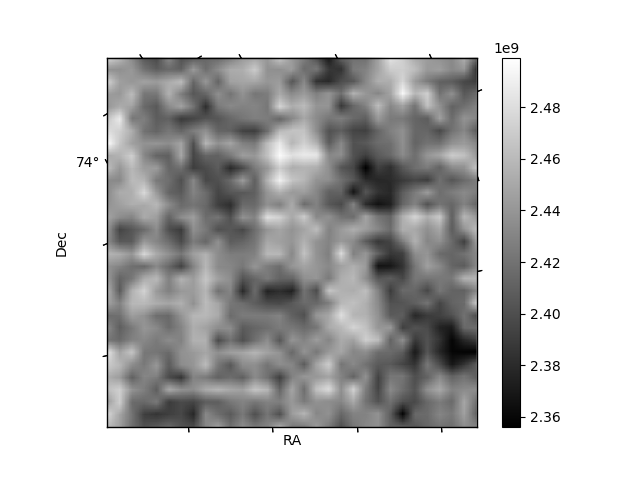
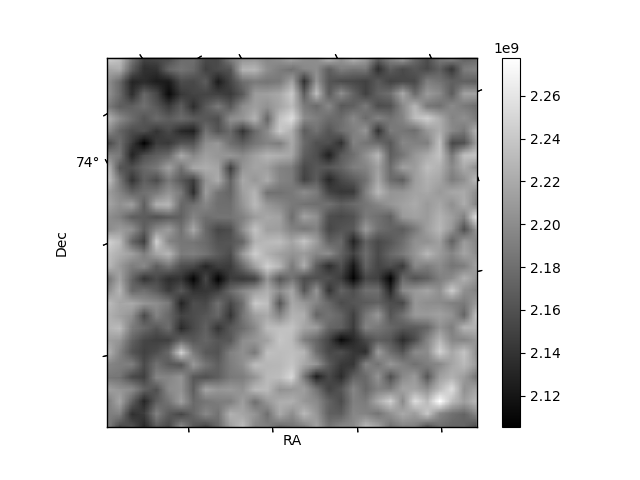
Histogram calculated using DETX and DETY for each event in the final _common_clean file
| Quadrant A | 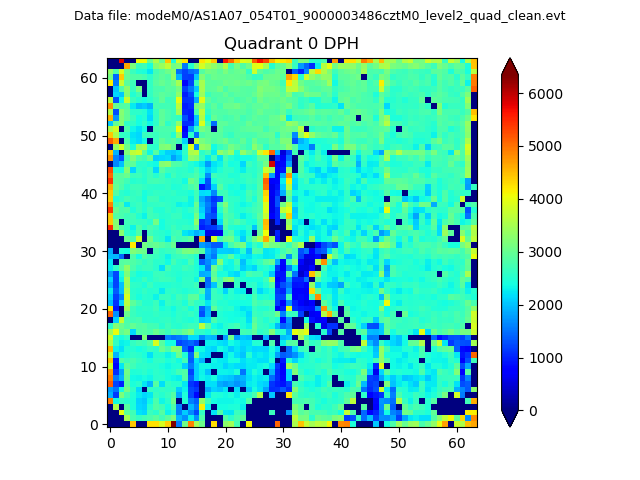 |
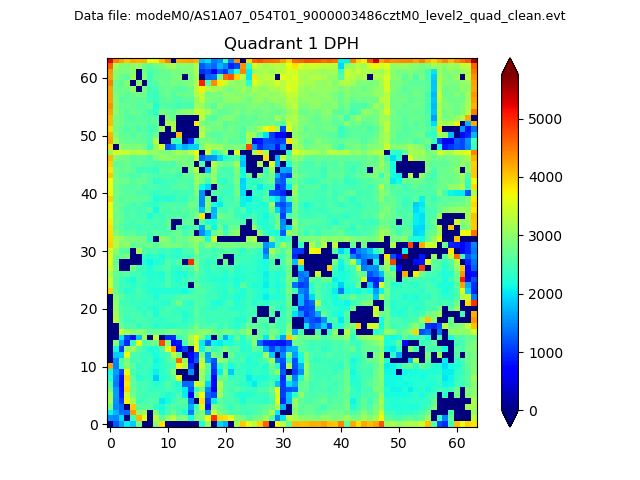 |
Quadrant B |
|---|---|---|---|
| Quadrant D | 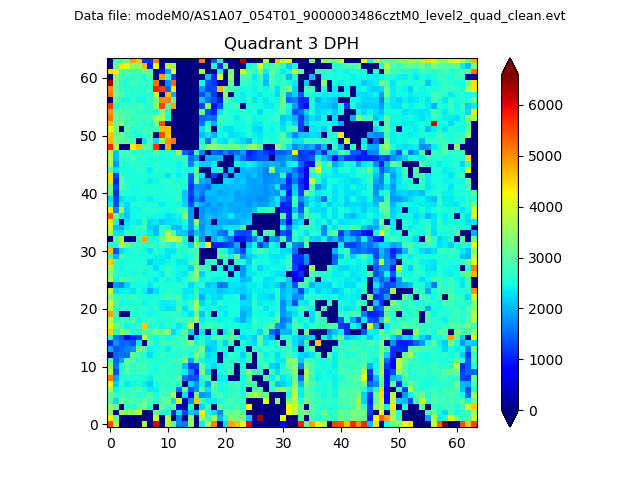 |
 |
Quadrant C |
| Plot type | Count rate plots | Images |
|---|---|---|
| Comparison with Poisson distribution Blue bars denote a histogram of data divided into 1 sec bins. Red curve is a Poisson curve with rate = median count rate of data. |
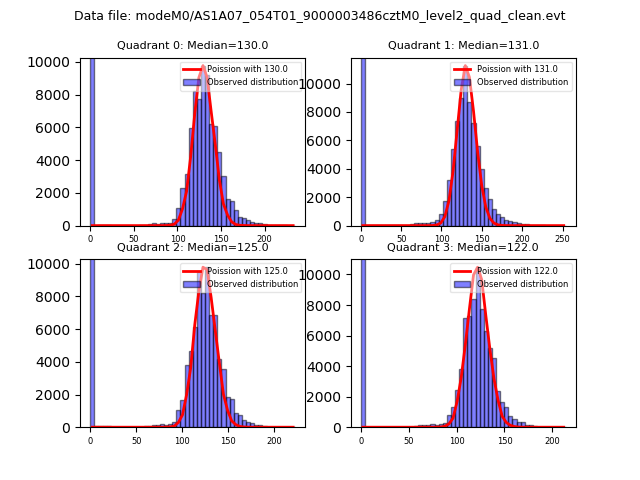 |
 |
| Quadrant-wise count rates Data is divided into 100 sec bins |
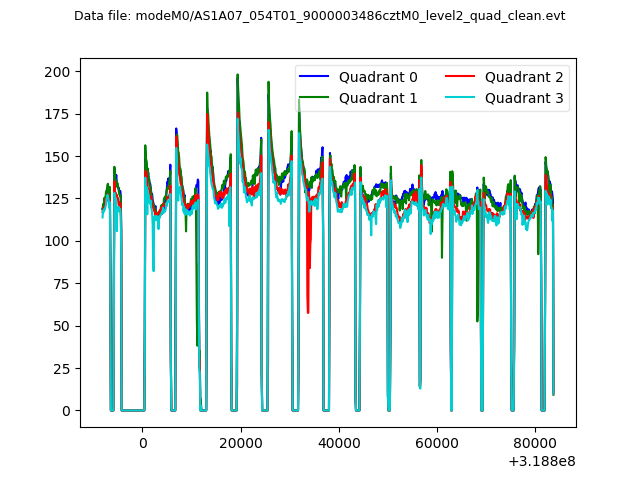 |
|
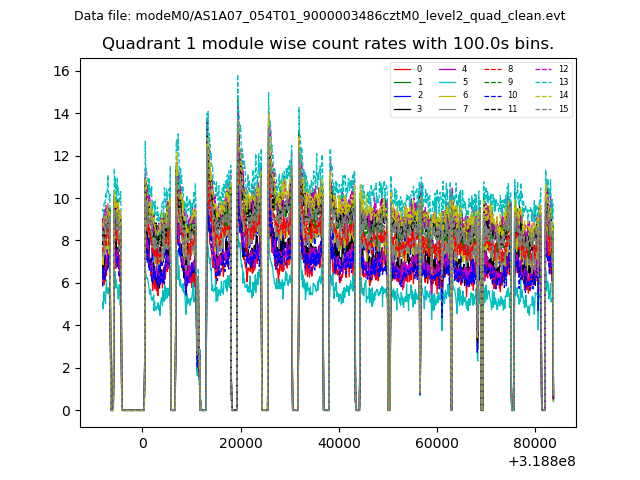
| Module-wise count rates for Quadrant A Data is divided into 100 sec bins |
 |
 |
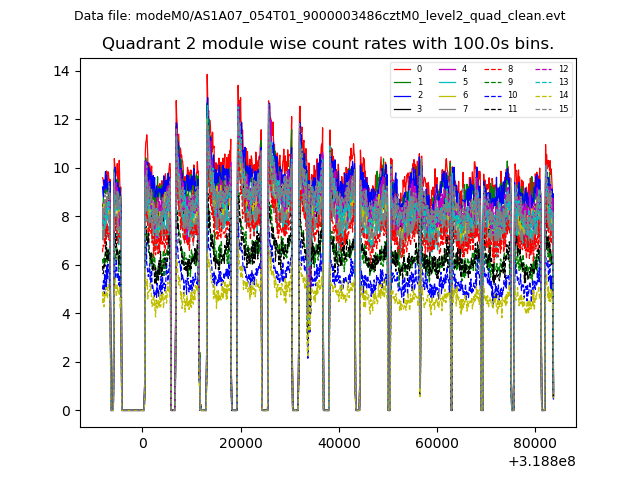
| Module-wise count rates for Quadrant B Data is divided into 100 sec bins |
 |
 |
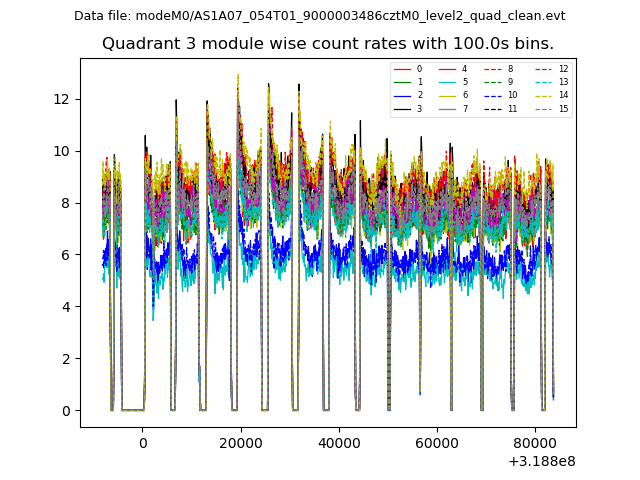
| Module-wise count rates for Quadrant C Data is divided into 100 sec bins |
 |
 |
| Module-wise count rates for Quadrant D Data is divided into 100 sec bins |
 |
 |
| Parameter | Plot |
|---|---|
| CZT HV Monitor |  |
| D_VDD | 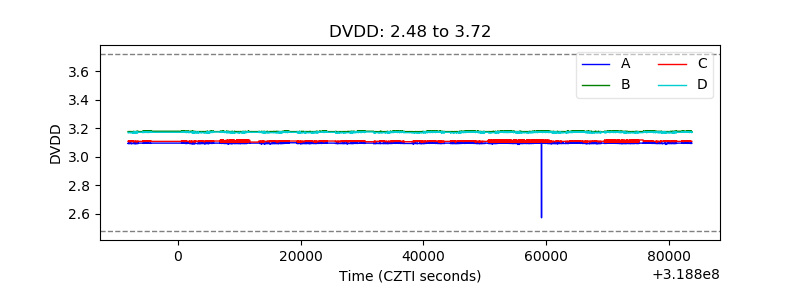 |
| Temperature 1 | 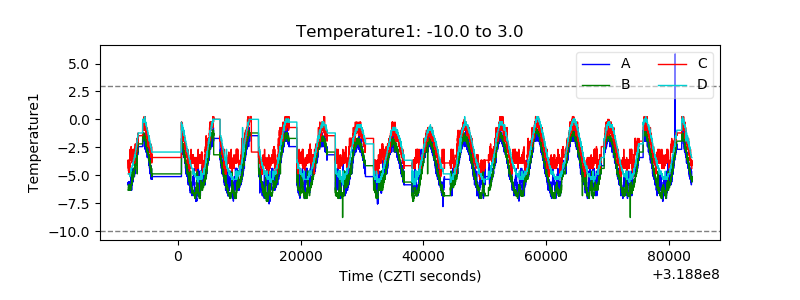 |
| Veto HV Monitor |  |
| Veto LLD | 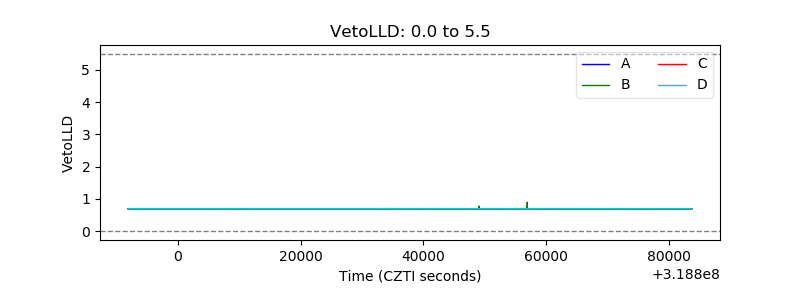 |
| Alpha Counter | 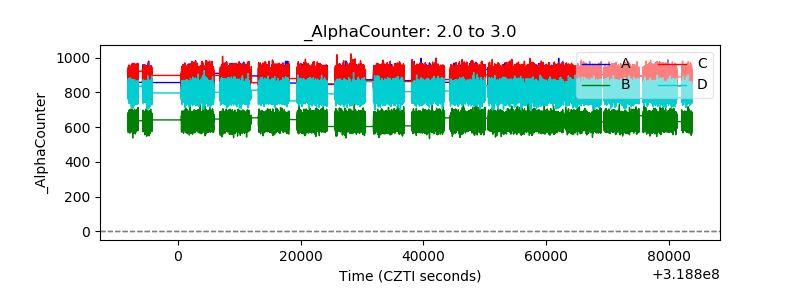 |
| _CPM_Rate | 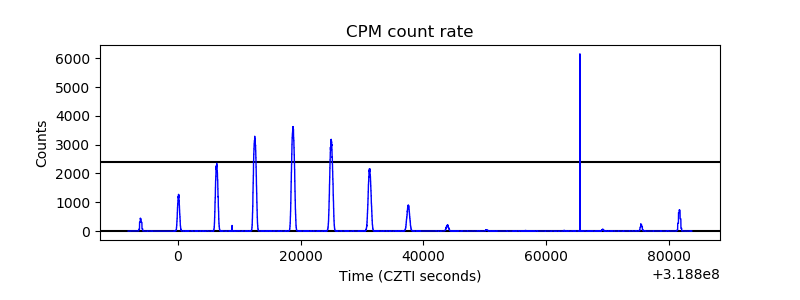 |
| CZT Counter |  |
| +2.5 Volts monitor | 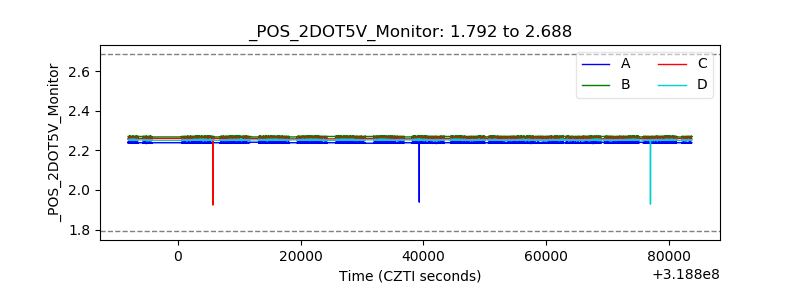 |
| +5 Volts monitor |  |
| _ROLL_ROT | 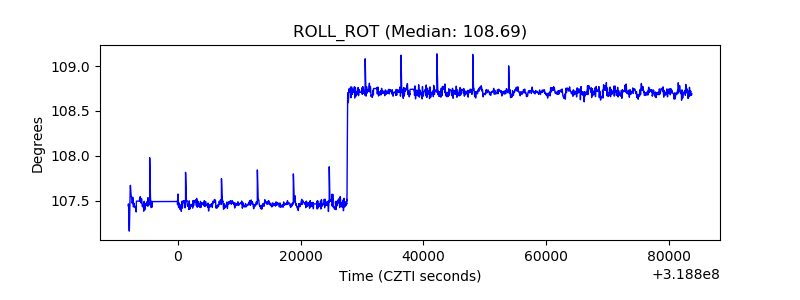 |
| _Roll_DEC | 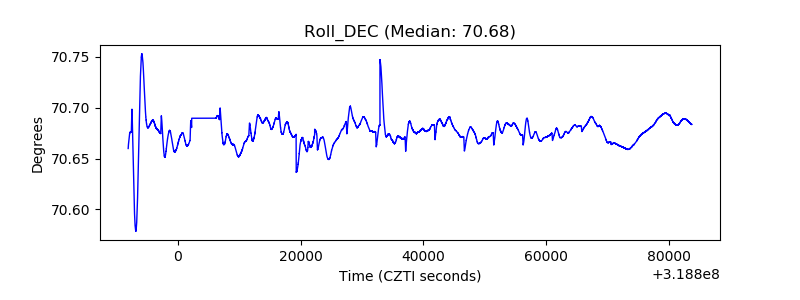 |
| _Roll_RA | 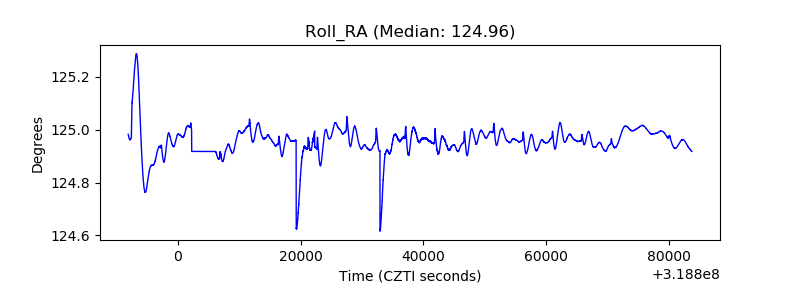 |
| Veto Counter |  |