| Param | Original file | Final file |
|---|---|---|
| Filename | modeM0/AS1A07_054T01_9000003486_23589cztM0_level2.evt | modeM0/AS1A07_054T01_9000003486_23589cztM0_level2_quad_clean.evt |
| Size (bytes) | 501,295,680 | 125,323,200 |
| Size | 478.1 MB | 119.5 MB |
| Events in quadrant A | 3,043,058 | 856,799 |
| Events in quadrant B | 3,437,659 | 865,675 |
| Events in quadrant C | 3,245,878 | 829,503 |
| Events in quadrant D | 5,011,397 | 787,663 |
| Mode SS | |||
|---|---|---|---|
| Quadrant | BADHDUFLAG | Total packets | Discarded packets |
| A | 0 | 134 | 0 |
| B | 0 | 134 | 0 |
| C | 0 | 134 | 0 |
| D | 0 | 134 | 0 |
| Mode M9 | |||
|---|---|---|---|
| Quadrant | BADHDUFLAG | Total packets | Discarded packets |
| A | 0 | 16 | 0 |
| B | 0 | 17 | 0 |
| C | 0 | 17 | 0 |
| D | 0 | 17 | 0 |
| Mode M0 | |||
|---|---|---|---|
| Quadrant | BADHDUFLAG | Total packets | Discarded packets |
| A | 0 | 13525 | 2 |
| B | 0 | 14743 | 3 |
| C | 0 | 14099 | 2 |
| D | 0 | 19503 | 2 |
| Quadrant | Total seconds | Saturated seconds | Saturation percentage |
|---|---|---|---|
| A | 6534 | 29 | 0.443832% |
| B | 6533 | 96 | 1.469463% |
| C | 6533 | 117 | 1.790908% |
| D | 6533 | 314 | 4.806368% |
Noise dominated data is calculated using 1-second bins in cleaned event files. If a bin has >2000 counts, and if more than 50% of those come from <1% of pixels, then it is considered to be noise-dominated and hence unusable.
| Quadrant | # 1 sec bins | Bins with >0 counts | Bins with >2000 counts | High rate bins dominated by noise | Noise dominated (total time) | Noise dominated (detector-on time) | Marked lightcurve |
|---|---|---|---|---|---|---|---|
| A | 7569 | 6535 | 0 | 0 | 0.00% | 0.00% | 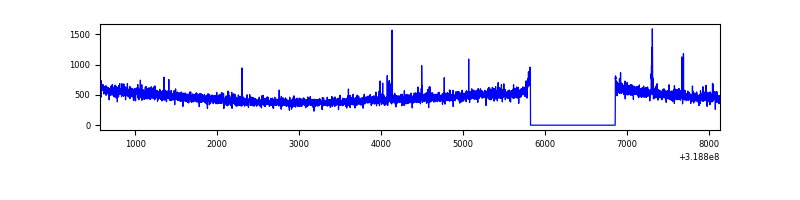 |
| B | 7568 | 6533 | 15 | 15 | 0.20% | 0.23% | 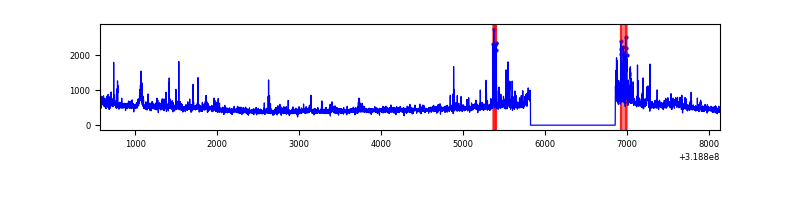 |
| C | 7568 | 6533 | 29 | 29 | 0.38% | 0.44% | 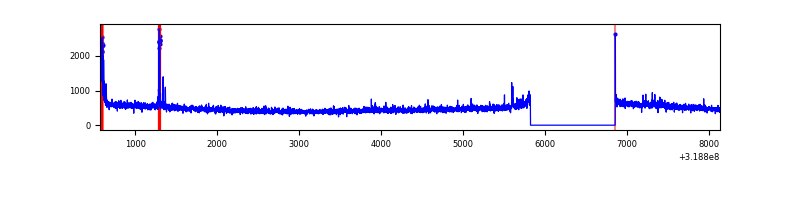 |
| D | 7568 | 6533 | 231 | 231 | 3.05% | 3.54% | 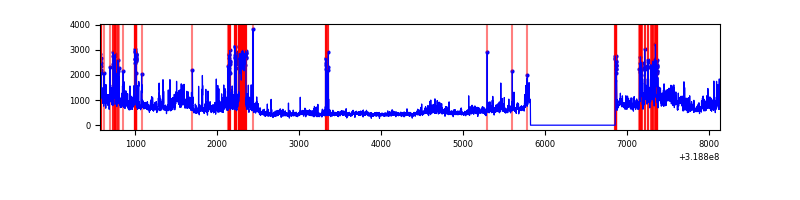 |
Top three noisy pixels from each quadrant. If the there are fewer than three noisy pixels in the level2.evt file, extra rows are filled as -1
| Pixel properties | Quadrant properties | ||||||
|---|---|---|---|---|---|---|---|
| Quadrant | DetID | PixID | Counts | Sigma | Mean | Median | Sigma |
| A | 6 | 16 | 29997 | 187.93 | 780 | 762 | 155.6 |
| A | 13 | 254 | 12366 | 74.59 | 780 | 762 | 155.6 |
| A | 3 | 137 | 6733 | 38.38 | 780 | 762 | 155.6 |
| B | 0 | 189 | 151255 | 1033.35 | 780 | 761 | 145.6 |
| B | 0 | 230 | 83178 | 565.91 | 780 | 761 | 145.6 |
| B | 3 | 64 | 78716 | 535.27 | 780 | 761 | 145.6 |
| C | 14 | 238 | 119456 | 679.9 | 753 | 758 | 174.6 |
| C | 0 | 10 | 79579 | 451.48 | 753 | 758 | 174.6 |
| C | 10 | 9 | 48490 | 273.41 | 753 | 758 | 174.6 |
| D | 1 | 52 | 1041802 | 5755.24 | 748 | 725 | 180.9 |
| D | 9 | 85 | 477111 | 2633.54 | 748 | 725 | 180.9 |
| D | 7 | 223 | 422573 | 2332.04 | 748 | 725 | 180.9 |
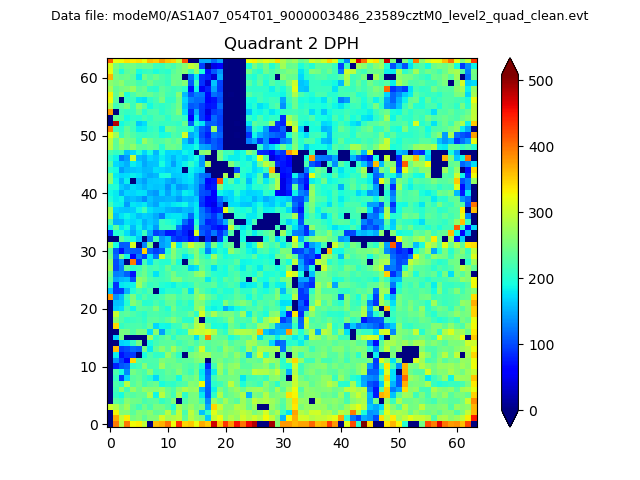
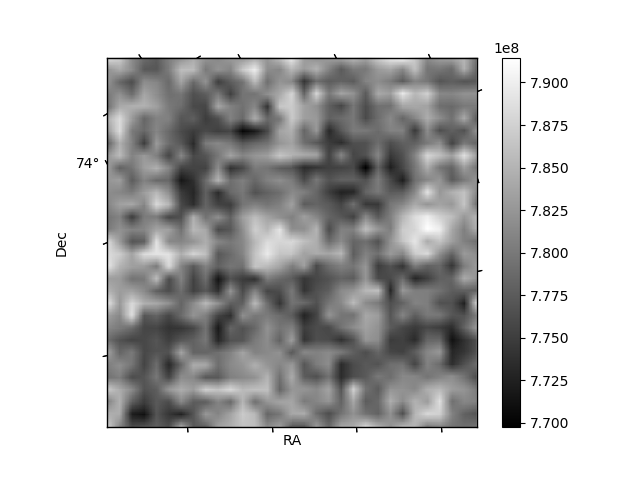
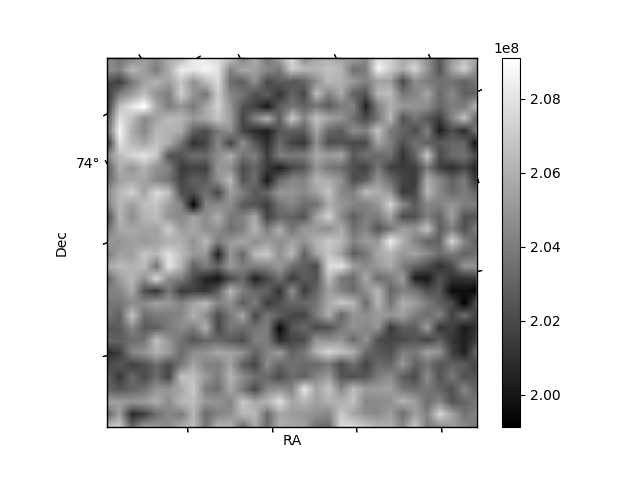
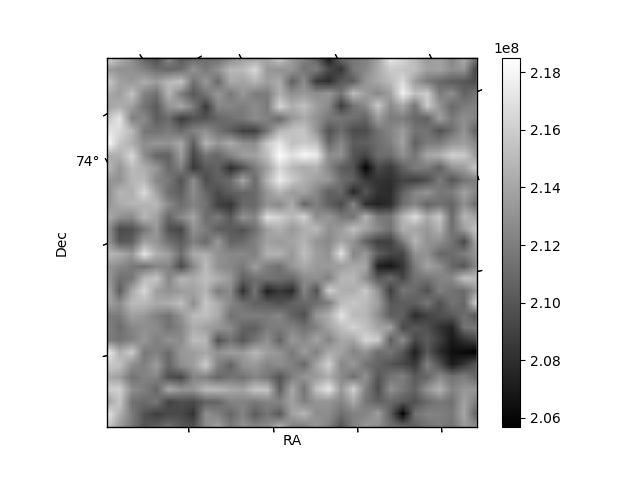
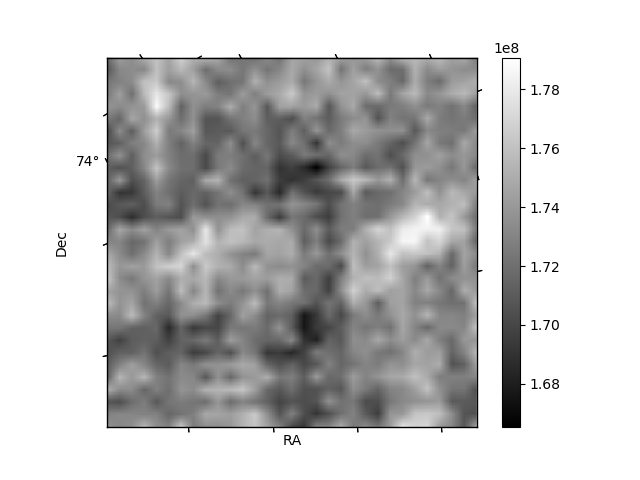
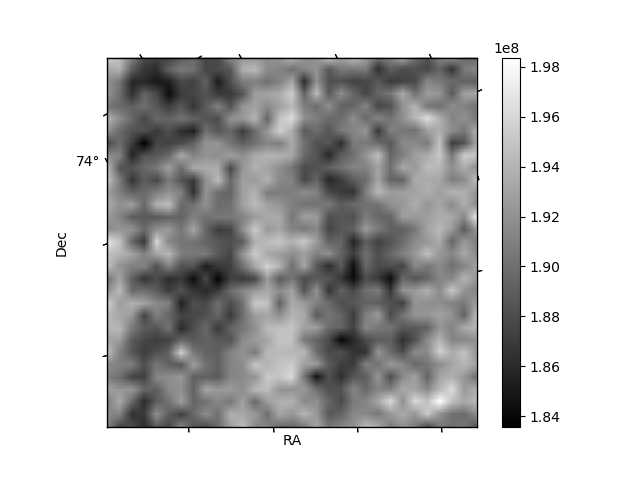
Histogram calculated using DETX and DETY for each event in the final _common_clean file
| Quadrant A | 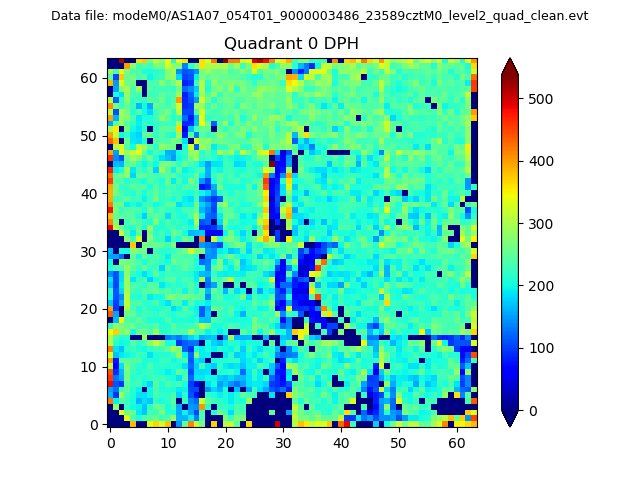 |
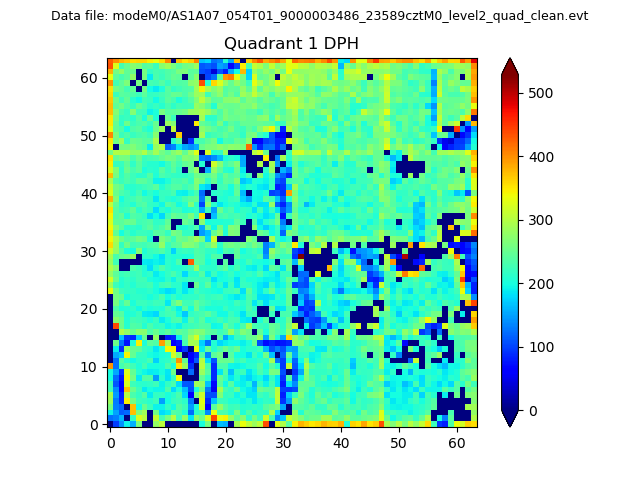 |
Quadrant B |
|---|---|---|---|
| Quadrant D | 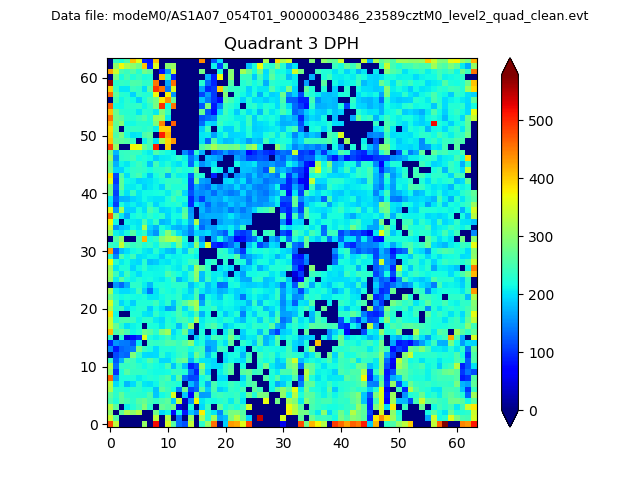 |
 |
Quadrant C |
| Plot type | Count rate plots | Images |
|---|---|---|
| Comparison with Poisson distribution Blue bars denote a histogram of data divided into 1 sec bins. Red curve is a Poisson curve with rate = median count rate of data. |
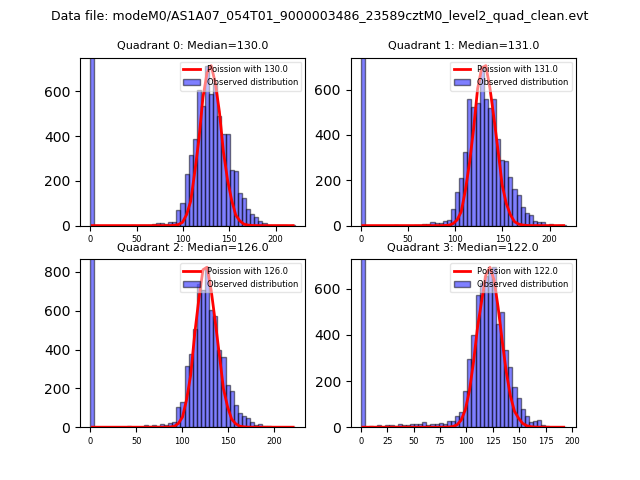 |
 |
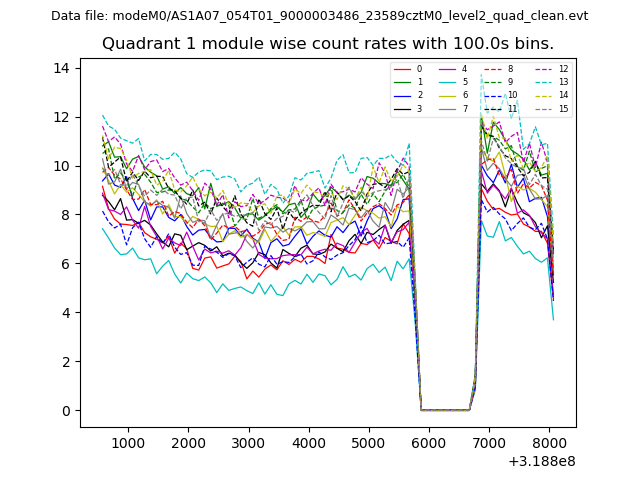
| Quadrant-wise count rates Data is divided into 100 sec bins |
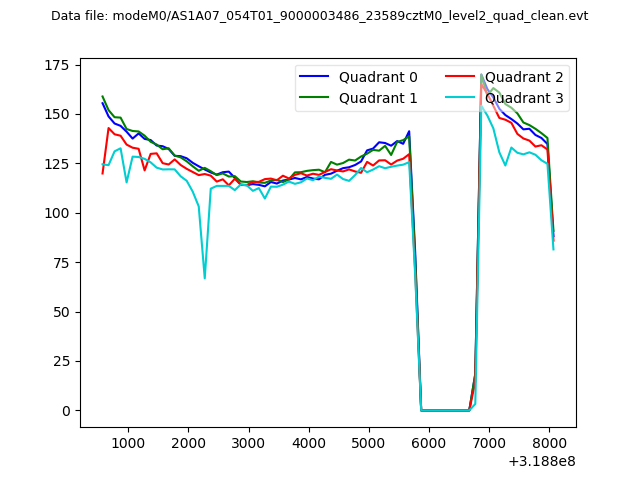 |
|
| Module-wise count rates for Quadrant A Data is divided into 100 sec bins |
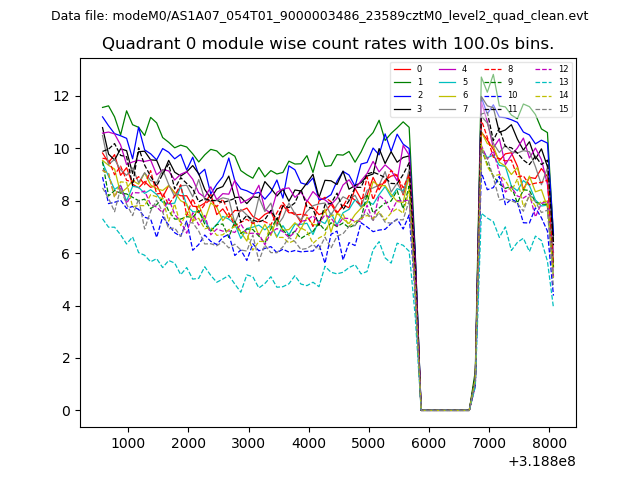 |
 |
| Module-wise count rates for Quadrant B Data is divided into 100 sec bins |
 |
 |
| Module-wise count rates for Quadrant C Data is divided into 100 sec bins |
 |
 |
| Module-wise count rates for Quadrant D Data is divided into 100 sec bins |
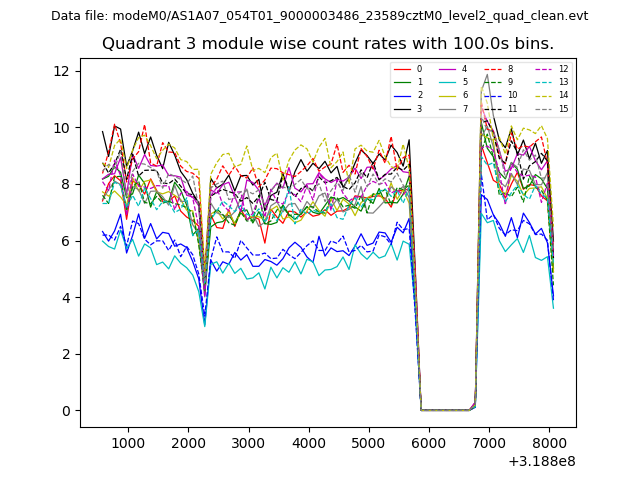 |
 |
| Parameter | Plot |
|---|---|
| CZT HV Monitor |  |
| D_VDD | 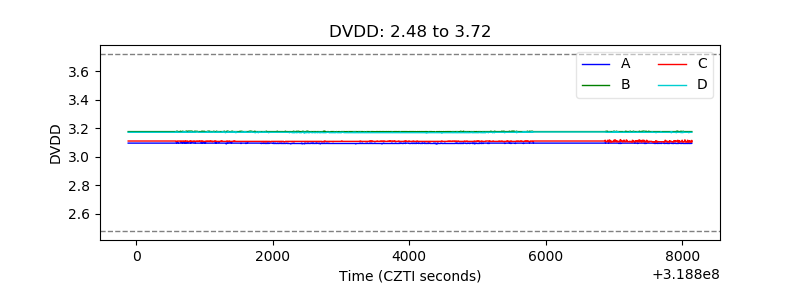 |
| Temperature 1 | 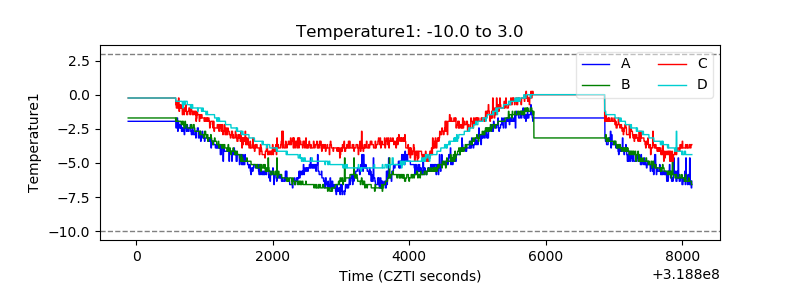 |
| Veto HV Monitor | 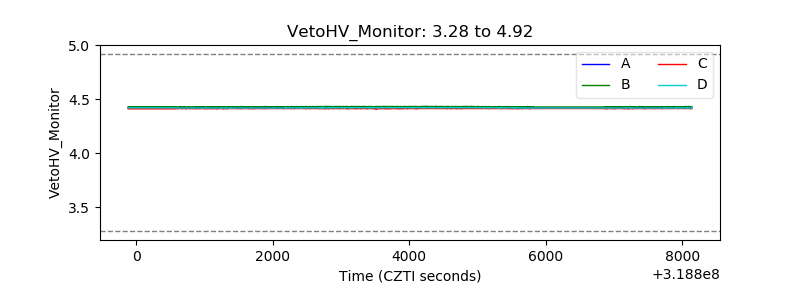 |
| Veto LLD | 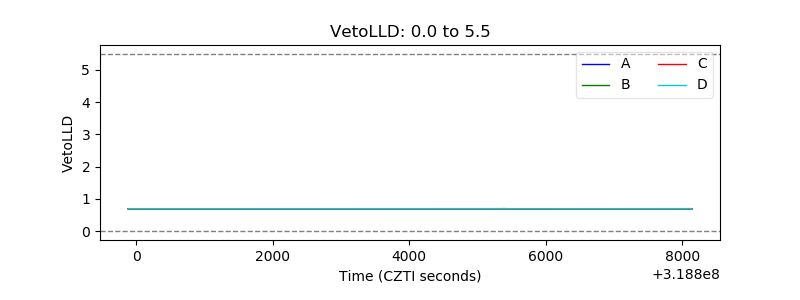 |
| Alpha Counter | 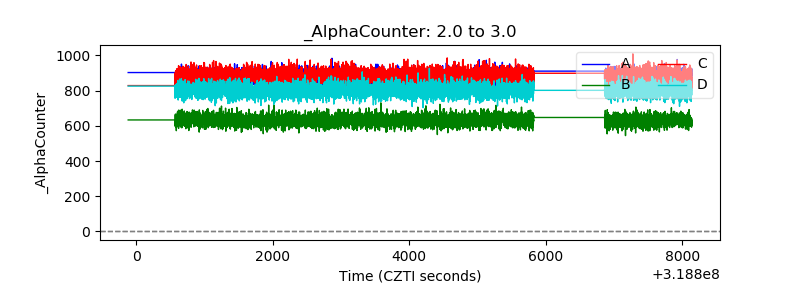 |
| _CPM_Rate | 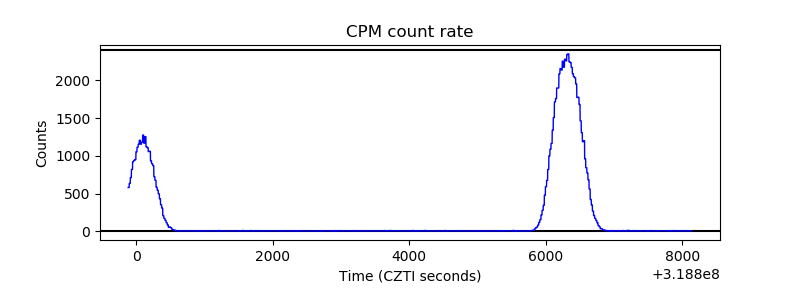 |
| CZT Counter | 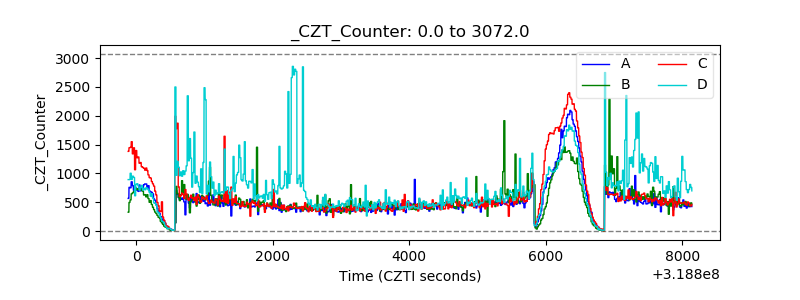 |
| +2.5 Volts monitor |  |
| +5 Volts monitor |  |
| _ROLL_ROT | 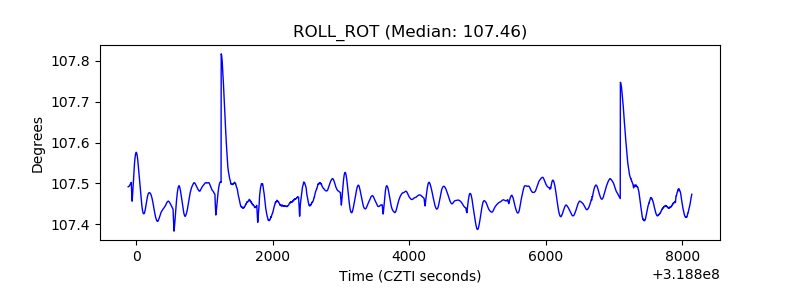 |
| _Roll_DEC | 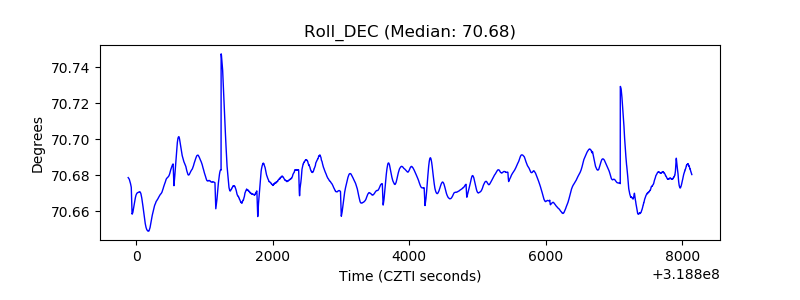 |
| _Roll_RA | 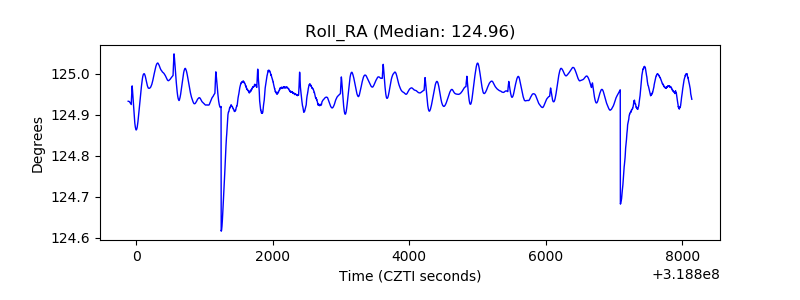 |
| Veto Counter | 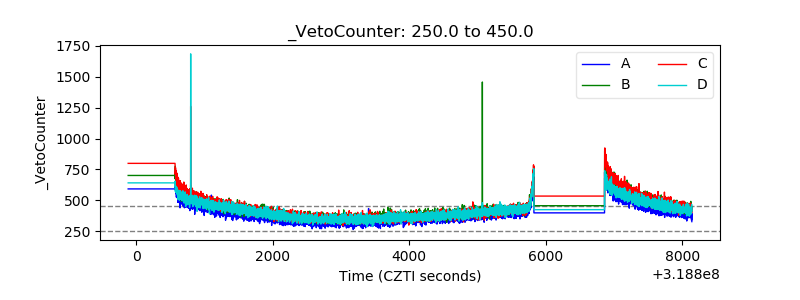 |