| Param | Original file | Final file |
|---|---|---|
| Filename | modeM0/AS1A07_054T01_9000003486_23592cztM0_level2.evt | modeM0/AS1A07_054T01_9000003486_23592cztM0_level2_quad_clean.evt |
| Size (bytes) | 461,537,280 | 130,334,400 |
| Size | 440.2 MB | 124.3 MB |
| Events in quadrant A | 2,991,413 | 899,527 |
| Events in quadrant B | 3,257,852 | 921,770 |
| Events in quadrant C | 3,241,362 | 861,577 |
| Events in quadrant D | 4,061,704 | 827,656 |
| Mode SS | |||
|---|---|---|---|
| Quadrant | BADHDUFLAG | Total packets | Discarded packets |
| A | 0 | 128 | 0 |
| B | 0 | 128 | 0 |
| C | 0 | 128 | 0 |
| D | 0 | 128 | 0 |
| Mode M9 | |||
|---|---|---|---|
| Quadrant | BADHDUFLAG | Total packets | Discarded packets |
| A | 0 | 22 | 0 |
| B | 0 | 23 | 0 |
| C | 0 | 23 | 0 |
| D | 0 | 23 | 0 |
| Mode M0 | |||
|---|---|---|---|
| Quadrant | BADHDUFLAG | Total packets | Discarded packets |
| A | 0 | 12979 | 2 |
| B | 0 | 13772 | 2 |
| C | 0 | 13750 | 2 |
| D | 0 | 16212 | 3 |
| Quadrant | Total seconds | Saturated seconds | Saturation percentage |
|---|---|---|---|
| A | 6261 | 6 | 0.095831% |
| B | 6261 | 38 | 0.606932% |
| C | 6261 | 160 | 2.555502% |
| D | 6260 | 108 | 1.725240% |
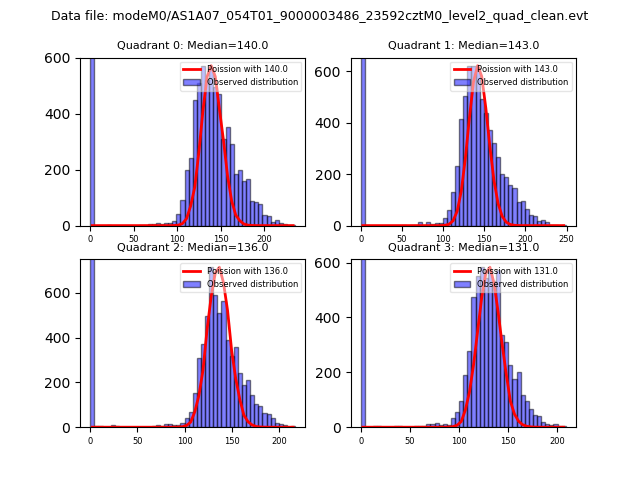
Noise dominated data is calculated using 1-second bins in cleaned event files. If a bin has >2000 counts, and if more than 50% of those come from <1% of pixels, then it is considered to be noise-dominated and hence unusable.
| Quadrant | # 1 sec bins | Bins with >0 counts | Bins with >2000 counts | High rate bins dominated by noise | Noise dominated (total time) | Noise dominated (detector-on time) | Marked lightcurve |
|---|---|---|---|---|---|---|---|
| A | 7511 | 6262 | 0 | 0 | 0.00% | 0.00% | 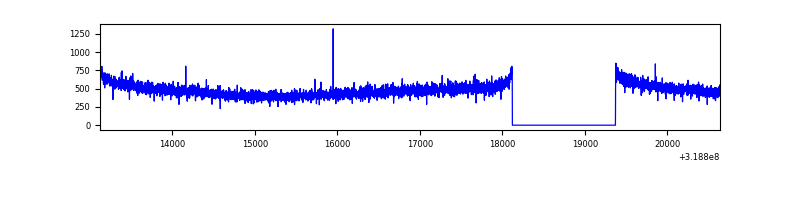 |
| B | 7511 | 6261 | 8 | 8 | 0.11% | 0.13% | 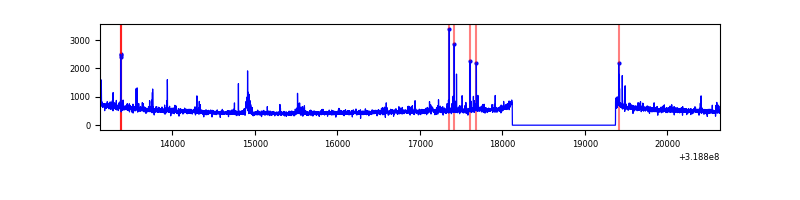 |
| C | 7511 | 6262 | 61 | 61 | 0.81% | 0.97% | 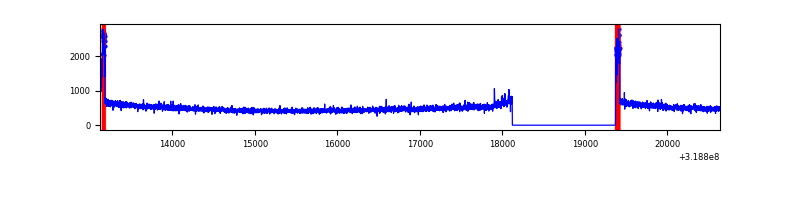 |
| D | 7510 | 6261 | 83 | 83 | 1.11% | 1.33% | 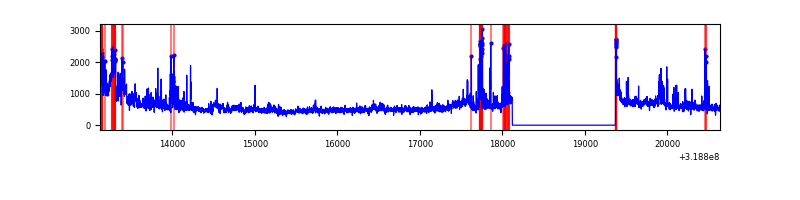 |
Top three noisy pixels from each quadrant. If the there are fewer than three noisy pixels in the level2.evt file, extra rows are filled as -1
| Pixel properties | Quadrant properties | ||||||
|---|---|---|---|---|---|---|---|
| Quadrant | DetID | PixID | Counts | Sigma | Mean | Median | Sigma |
| A | 13 | 254 | 10810 | 65.39 | 774 | 758 | 153.7 |
| A | 0 | 226 | 6488 | 37.28 | 774 | 758 | 153.7 |
| A | 3 | 137 | 6458 | 37.08 | 774 | 758 | 153.7 |
| B | 0 | 189 | 80986 | 556.98 | 782 | 764 | 144.0 |
| B | 3 | 64 | 39599 | 269.63 | 782 | 764 | 144.0 |
| B | 0 | 230 | 21411 | 143.35 | 782 | 764 | 144.0 |
| C | 0 | 10 | 218854 | 1282.43 | 737 | 743 | 170.1 |
| C | 14 | 238 | 120213 | 702.45 | 737 | 743 | 170.1 |
| C | 3 | 233 | 20117 | 113.91 | 737 | 743 | 170.1 |
| D | 1 | 52 | 584395 | 3234.83 | 742 | 719 | 180.4 |
| D | 7 | 223 | 357107 | 1975.16 | 742 | 719 | 180.4 |
| D | 9 | 85 | 140549 | 774.96 | 742 | 719 | 180.4 |
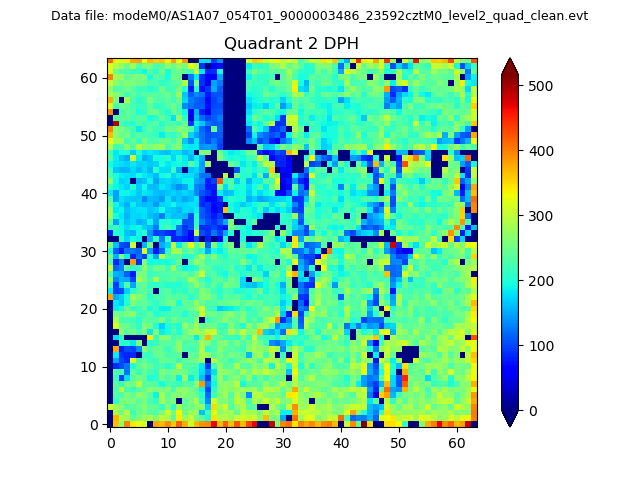
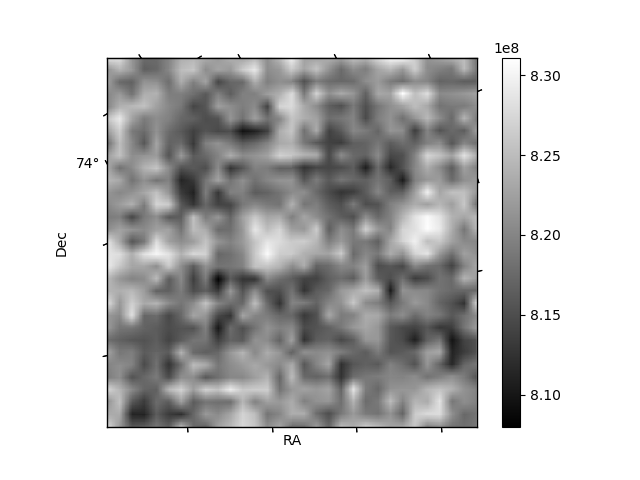
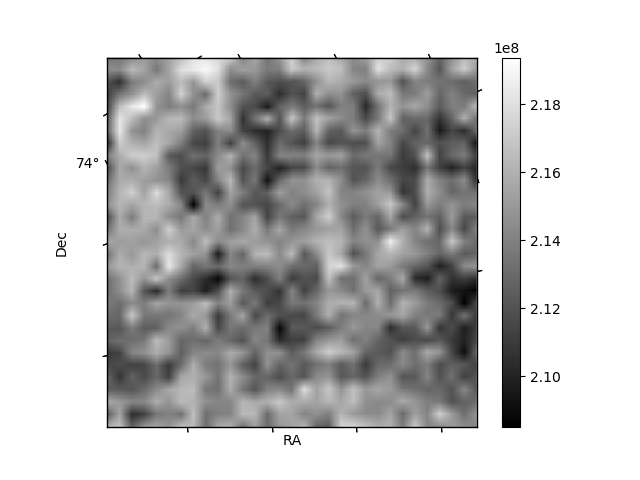
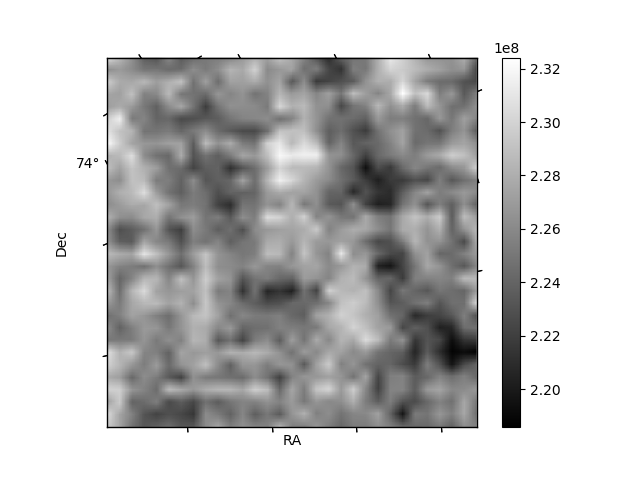
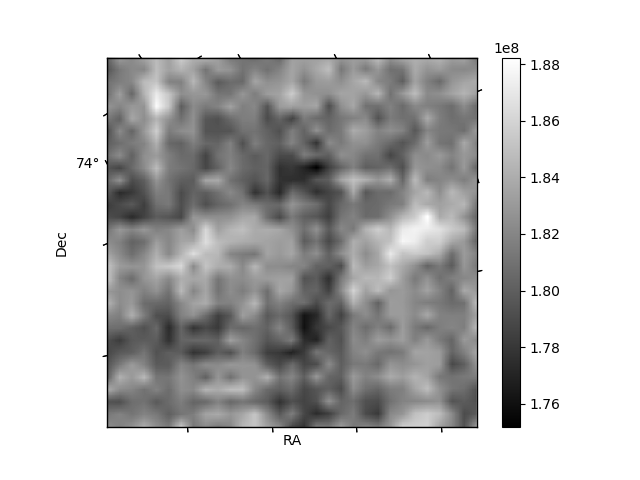
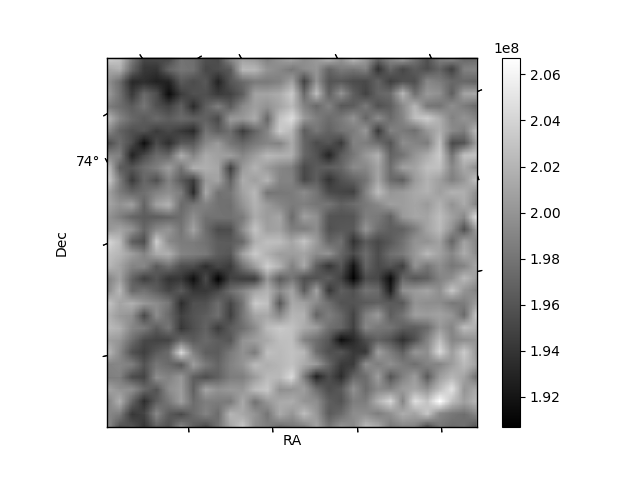
Histogram calculated using DETX and DETY for each event in the final _common_clean file
| Quadrant A | 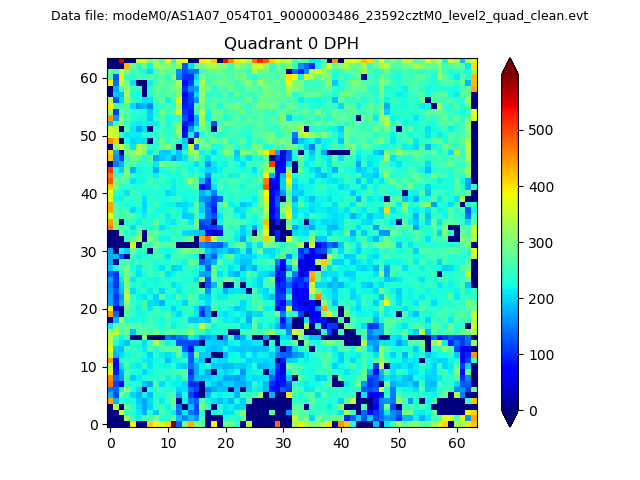 |
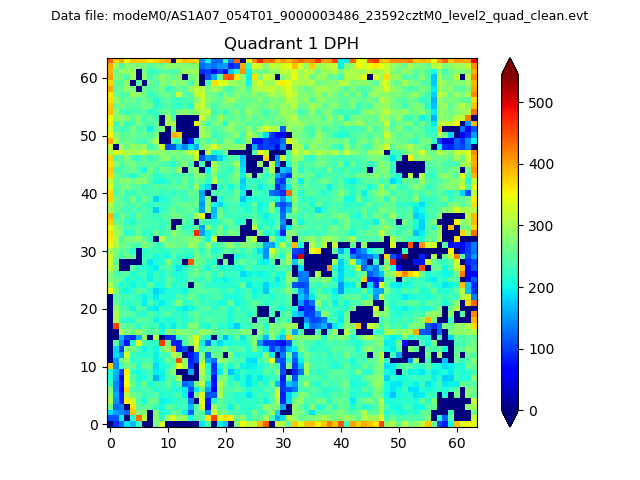 |
Quadrant B |
|---|---|---|---|
| Quadrant D | 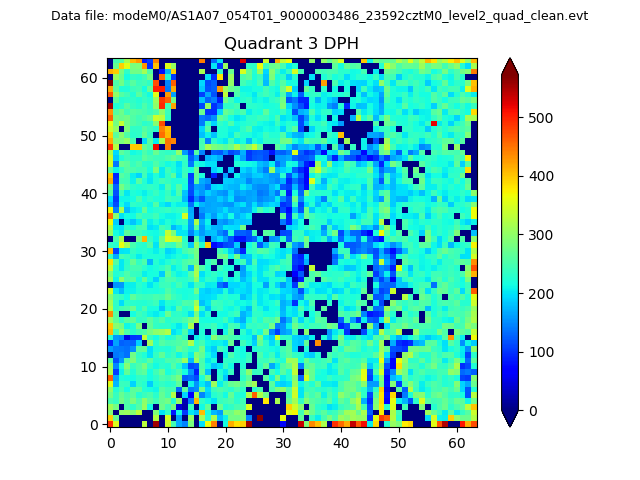 |
 |
Quadrant C |
| Plot type | Count rate plots | Images |
|---|---|---|
| Comparison with Poisson distribution Blue bars denote a histogram of data divided into 1 sec bins. Red curve is a Poisson curve with rate = median count rate of data. |
 |
 |
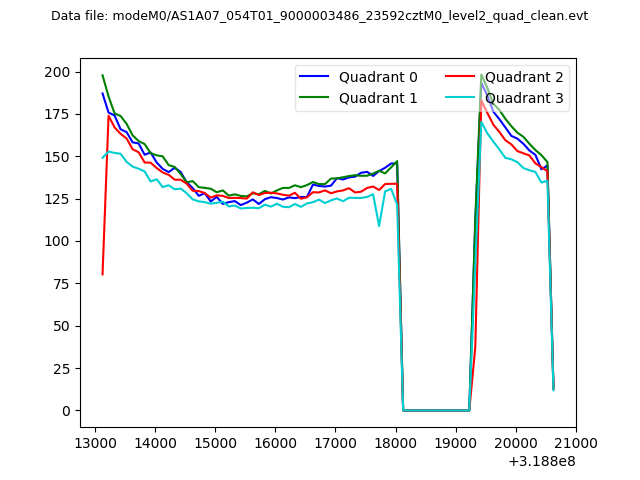
| Quadrant-wise count rates Data is divided into 100 sec bins |
 |
|
| Module-wise count rates for Quadrant A Data is divided into 100 sec bins |
 |
 |
| Module-wise count rates for Quadrant B Data is divided into 100 sec bins |
 |
 |
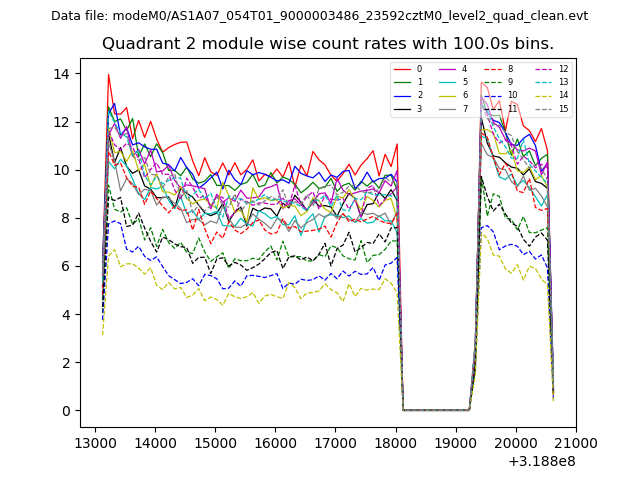
| Module-wise count rates for Quadrant C Data is divided into 100 sec bins |
 |
 |
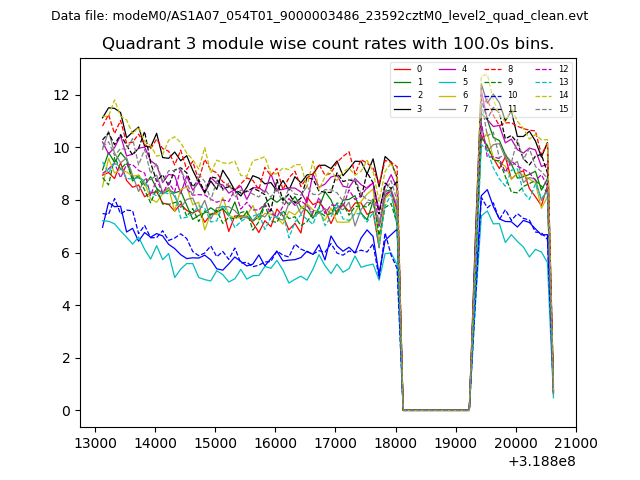
| Module-wise count rates for Quadrant D Data is divided into 100 sec bins |
 |
 |
| Parameter | Plot |
|---|---|
| CZT HV Monitor | 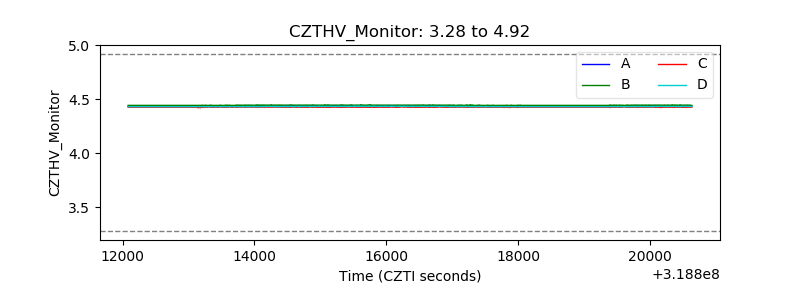 |
| D_VDD | 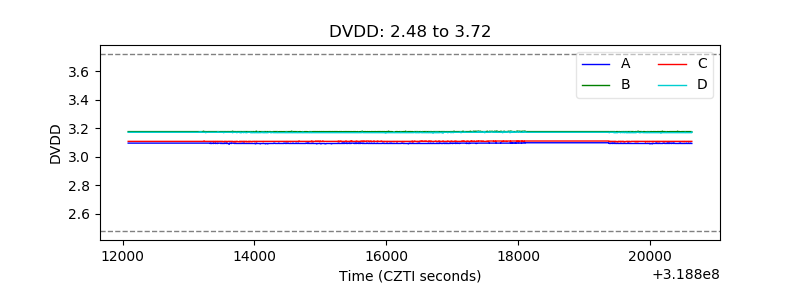 |
| Temperature 1 | 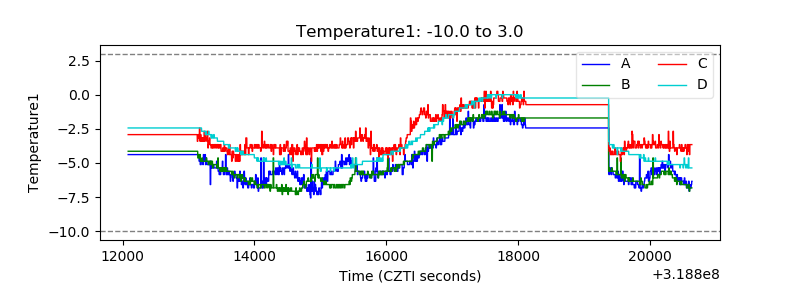 |
| Veto HV Monitor | 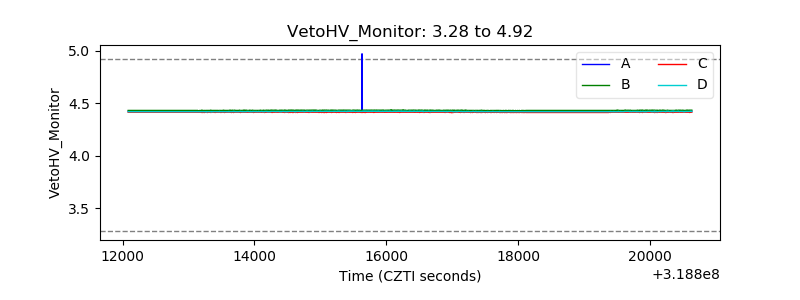 |
| Veto LLD | 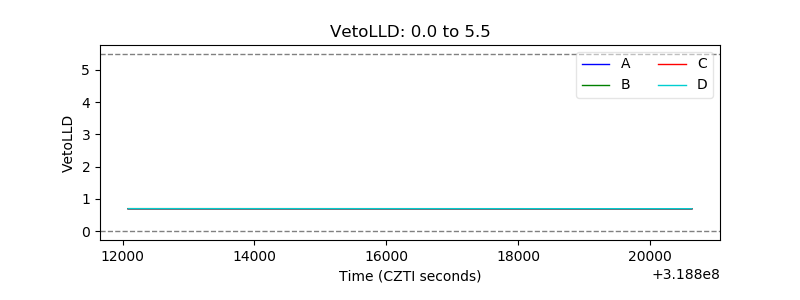 |
| Alpha Counter | 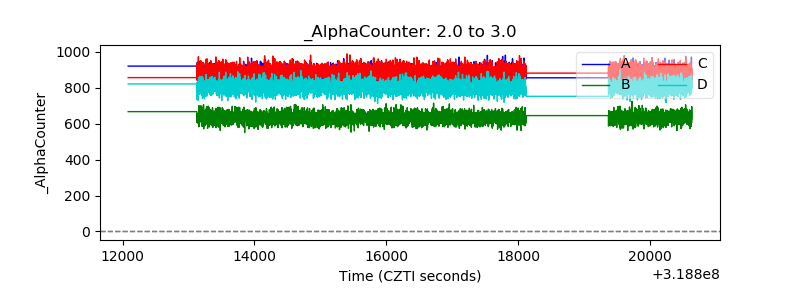 |
| _CPM_Rate | 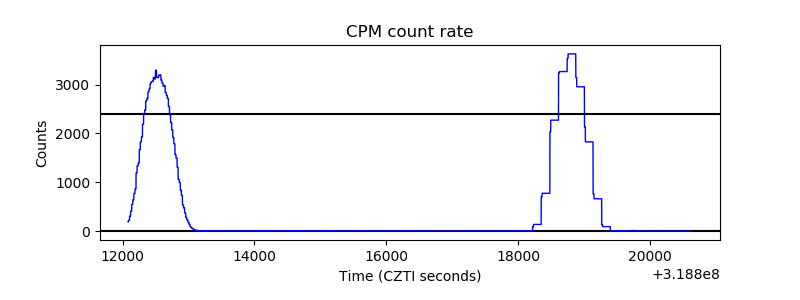 |
| CZT Counter | 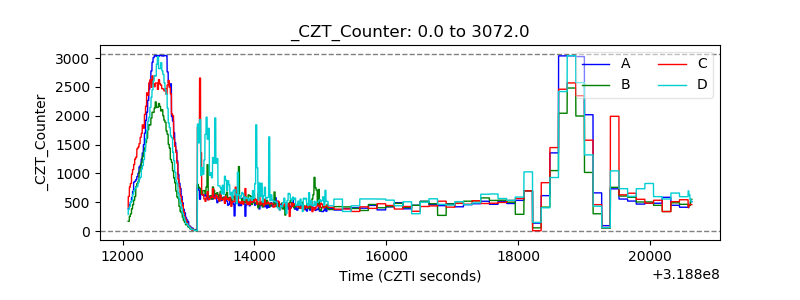 |
| +2.5 Volts monitor |  |
| +5 Volts monitor | 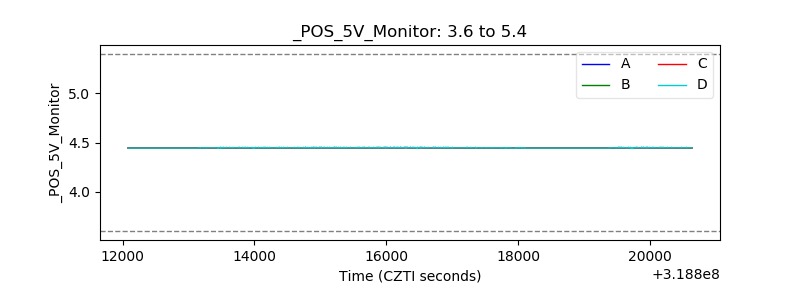 |
| _ROLL_ROT |  |
| _Roll_DEC | 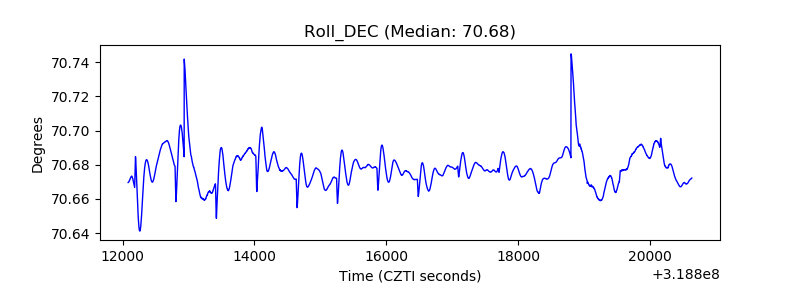 |
| _Roll_RA | 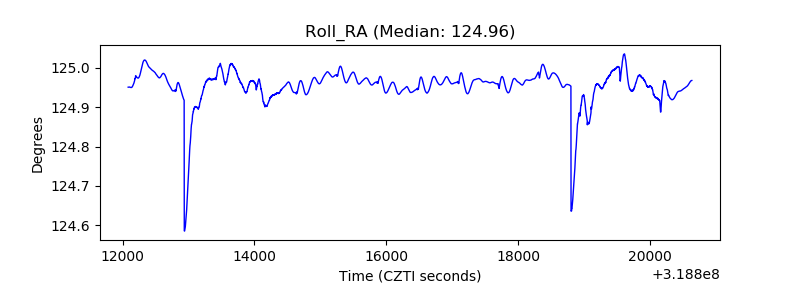 |
| Veto Counter | 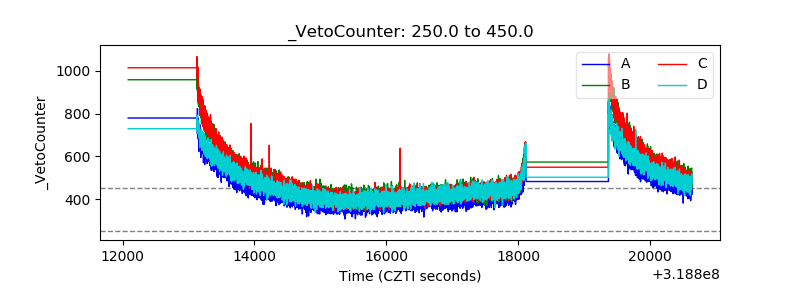 |