| Param | Original file | Final file |
|---|---|---|
| Filename | modeM0/AS1A07_054T01_9000003486_23593cztM0_level2.evt | modeM0/AS1A07_054T01_9000003486_23593cztM0_level2_quad_clean.evt |
| Size (bytes) | 483,459,840 | 138,502,080 |
| Size | 461.1 MB | 132.1 MB |
| Events in quadrant A | 3,192,559 | 960,156 |
| Events in quadrant B | 3,469,303 | 984,235 |
| Events in quadrant C | 3,411,961 | 911,912 |
| Events in quadrant D | 4,124,265 | 883,327 |
| Mode SS | |||
|---|---|---|---|
| Quadrant | BADHDUFLAG | Total packets | Discarded packets |
| A | 0 | 134 | 0 |
| B | 0 | 134 | 0 |
| C | 0 | 134 | 0 |
| D | 0 | 134 | 0 |
| Mode M9 | |||
|---|---|---|---|
| Quadrant | BADHDUFLAG | Total packets | Discarded packets |
| A | 0 | 15 | 0 |
| B | 0 | 16 | 0 |
| C | 0 | 16 | 0 |
| D | 0 | 16 | 0 |
| Mode M0 | |||
|---|---|---|---|
| Quadrant | BADHDUFLAG | Total packets | Discarded packets |
| A | 0 | 13591 | 2 |
| B | 0 | 14465 | 2 |
| C | 0 | 14282 | 2 |
| D | 0 | 16627 | 2 |
| Quadrant | Total seconds | Saturated seconds | Saturation percentage |
|---|---|---|---|
| A | 6528 | 16 | 0.245098% |
| B | 6528 | 53 | 0.811887% |
| C | 6528 | 174 | 2.665441% |
| D | 6528 | 104 | 1.593137% |
Noise dominated data is calculated using 1-second bins in cleaned event files. If a bin has >2000 counts, and if more than 50% of those come from <1% of pixels, then it is considered to be noise-dominated and hence unusable.
| Quadrant | # 1 sec bins | Bins with >0 counts | Bins with >2000 counts | High rate bins dominated by noise | Noise dominated (total time) | Noise dominated (detector-on time) | Marked lightcurve |
|---|---|---|---|---|---|---|---|
| A | 7848 | 6529 | 0 | 0 | 0.00% | 0.00% | 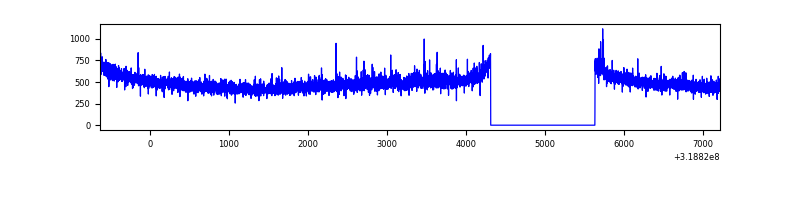 |
| B | 7848 | 6528 | 13 | 13 | 0.17% | 0.20% | 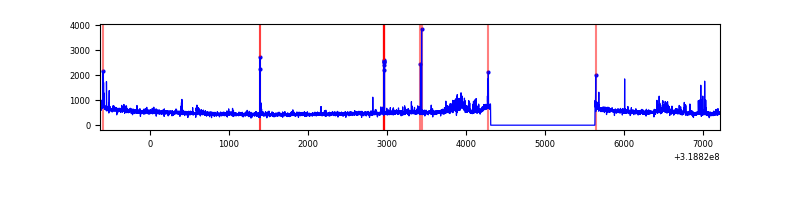 |
| C | 7848 | 6528 | 89 | 89 | 1.13% | 1.36% | 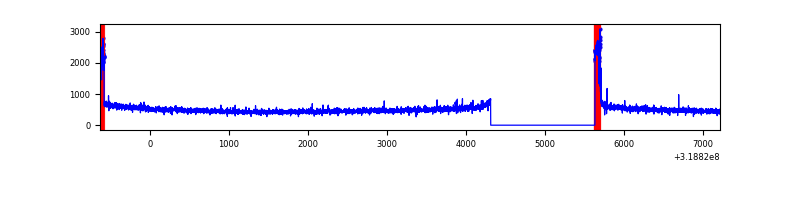 |
| D | 7848 | 6529 | 55 | 55 | 0.70% | 0.84% | 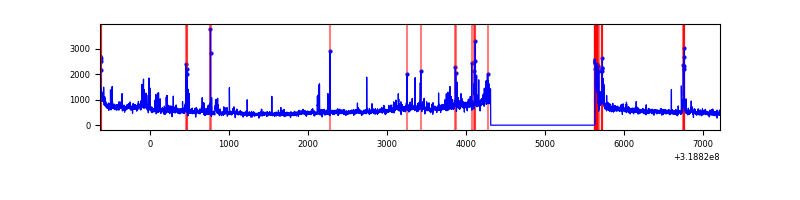 |
Top three noisy pixels from each quadrant. If the there are fewer than three noisy pixels in the level2.evt file, extra rows are filled as -1
| Pixel properties | Quadrant properties | ||||||
|---|---|---|---|---|---|---|---|
| Quadrant | DetID | PixID | Counts | Sigma | Mean | Median | Sigma |
| A | 6 | 16 | 30401 | 181.68 | 819 | 806 | 162.9 |
| A | 13 | 254 | 11342 | 64.68 | 819 | 806 | 162.9 |
| A | 0 | 226 | 7018 | 38.13 | 819 | 806 | 162.9 |
| B | 0 | 189 | 159367 | 1058.64 | 823 | 804 | 149.8 |
| B | 3 | 64 | 22225 | 143.01 | 823 | 804 | 149.8 |
| B | 12 | 111 | 17563 | 111.89 | 823 | 804 | 149.8 |
| C | 0 | 10 | 250276 | 1405.24 | 774 | 779 | 177.5 |
| C | 14 | 238 | 127868 | 715.8 | 774 | 779 | 177.5 |
| C | 7 | 247 | 9570 | 49.51 | 774 | 779 | 177.5 |
| D | 7 | 223 | 565106 | 3022.6 | 778 | 758 | 186.7 |
| D | 1 | 52 | 478235 | 2557.32 | 778 | 758 | 186.7 |
| D | 13 | 174 | 62628 | 331.37 | 778 | 758 | 186.7 |
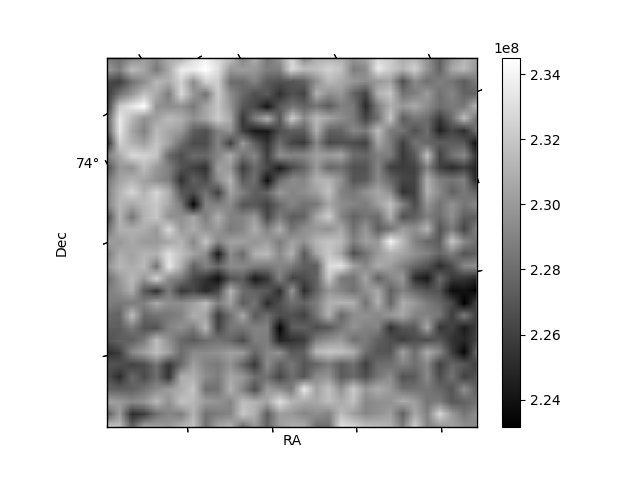
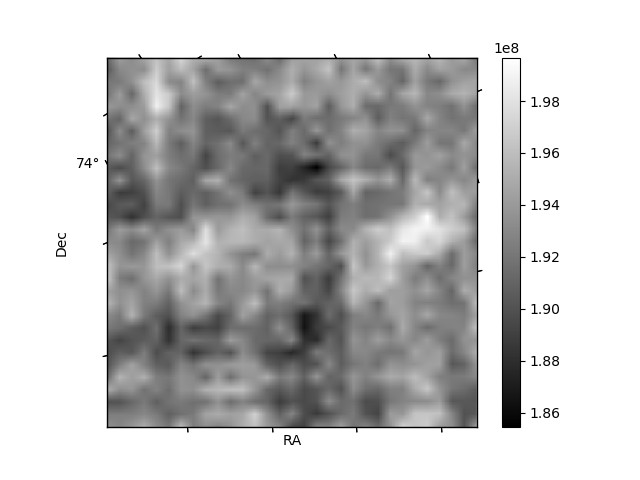
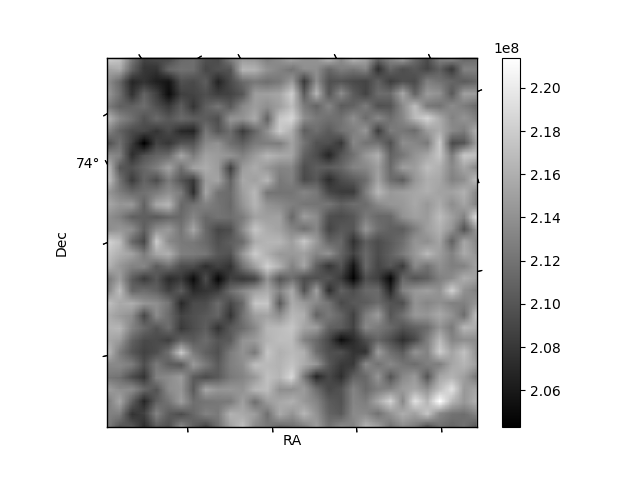
Histogram calculated using DETX and DETY for each event in the final _common_clean file
| Quadrant A |  |
 |
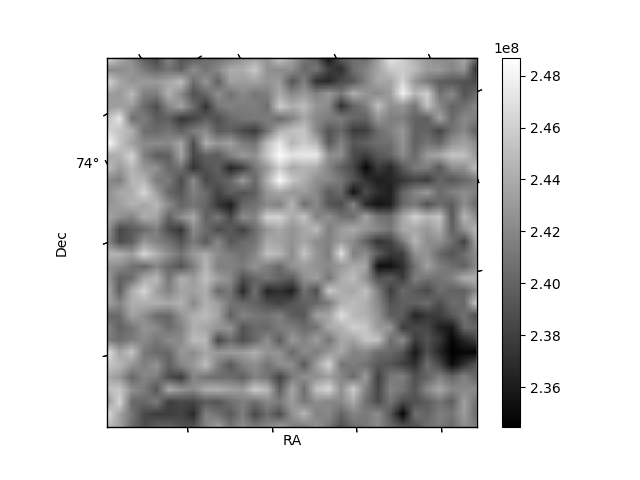
Quadrant B |
|---|---|---|---|
| Quadrant D | 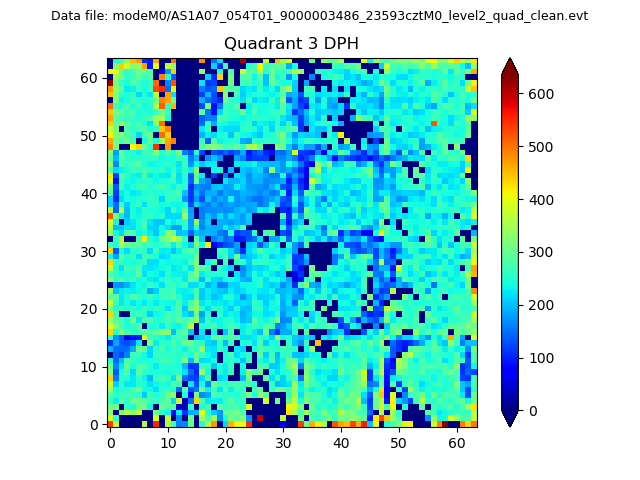 |
 |
Quadrant C |
| Plot type | Count rate plots | Images |
|---|---|---|
| Comparison with Poisson distribution Blue bars denote a histogram of data divided into 1 sec bins. Red curve is a Poisson curve with rate = median count rate of data. |
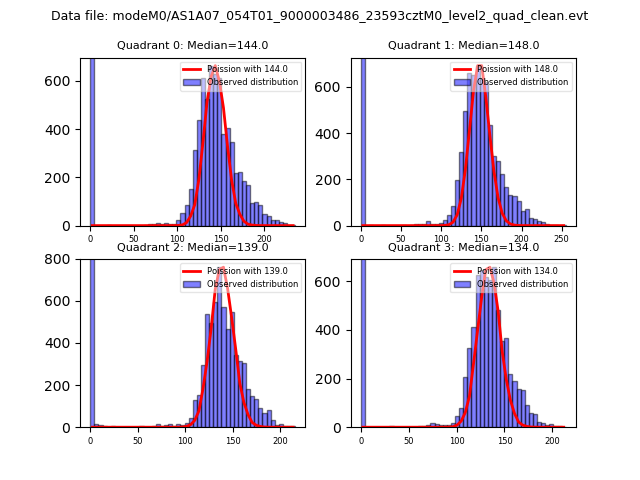 |
 |
| Quadrant-wise count rates Data is divided into 100 sec bins |
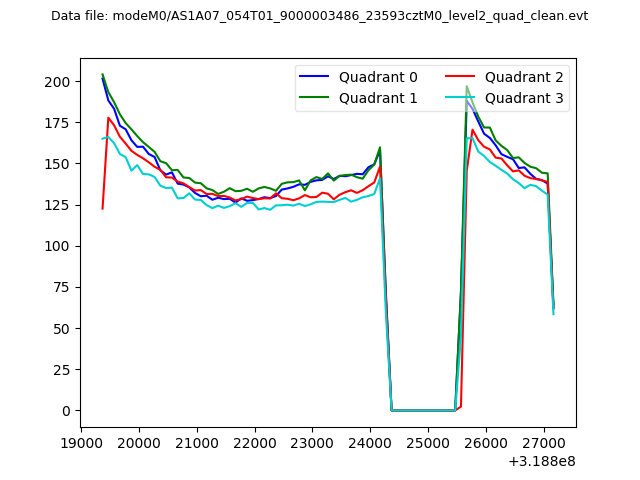 |
|
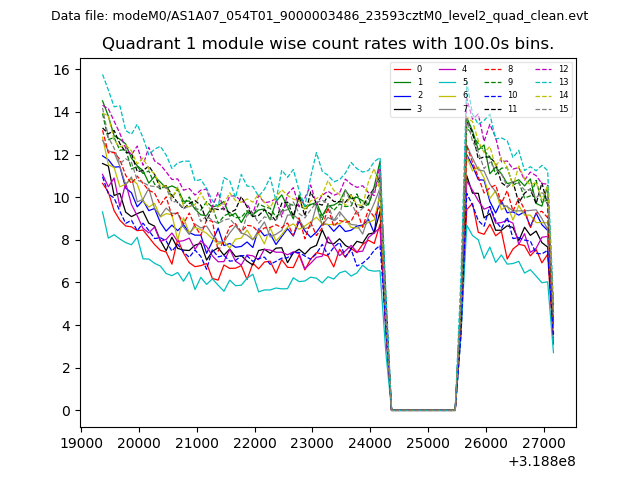
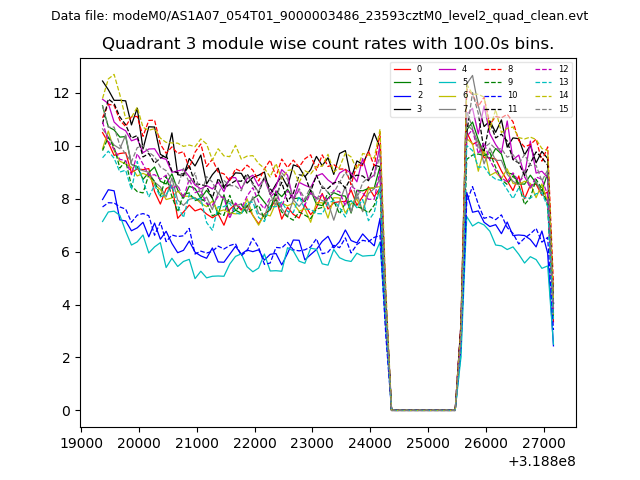
| Module-wise count rates for Quadrant A Data is divided into 100 sec bins |
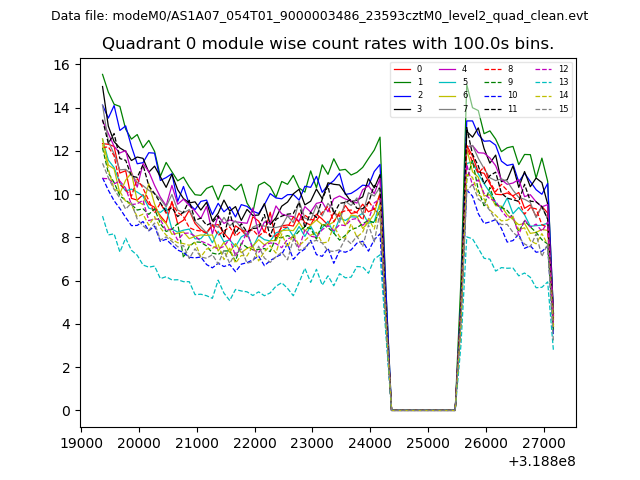 |
 |
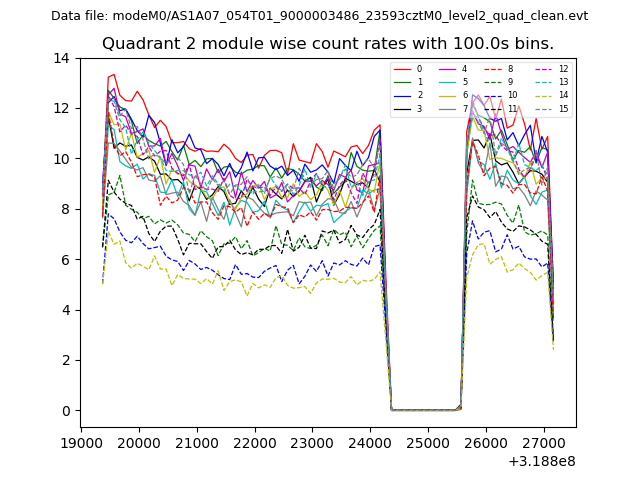
| Module-wise count rates for Quadrant B Data is divided into 100 sec bins |
 |
 |
| Module-wise count rates for Quadrant C Data is divided into 100 sec bins |
 |
 |
| Module-wise count rates for Quadrant D Data is divided into 100 sec bins |
 |
 |
| Parameter | Plot |
|---|---|
| CZT HV Monitor | 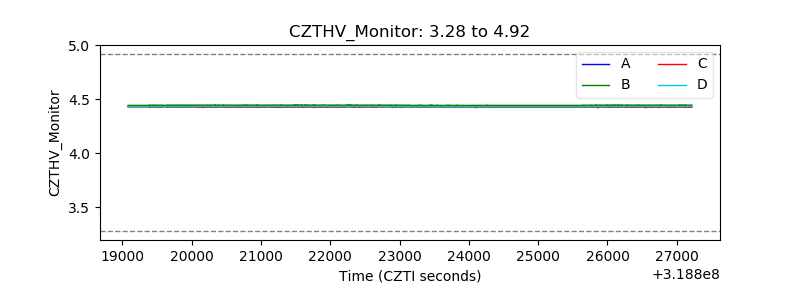 |
| D_VDD | 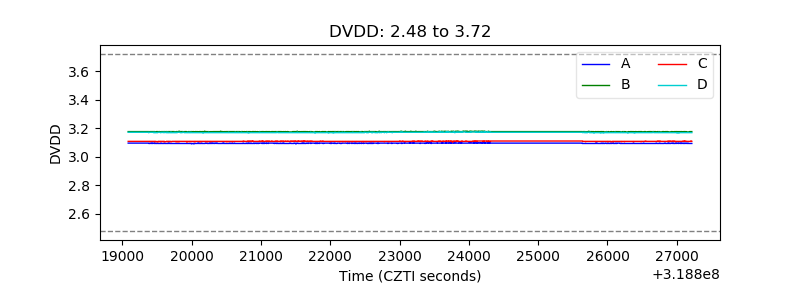 |
| Temperature 1 | 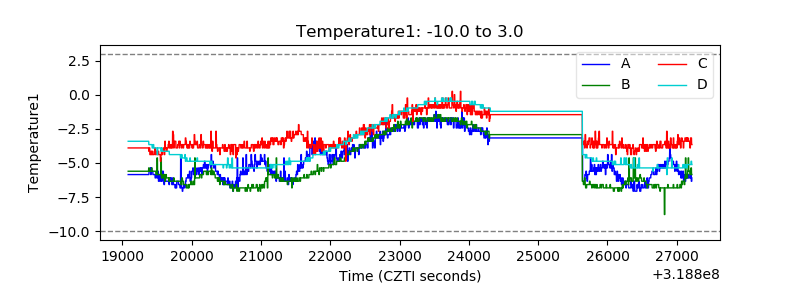 |
| Veto HV Monitor | 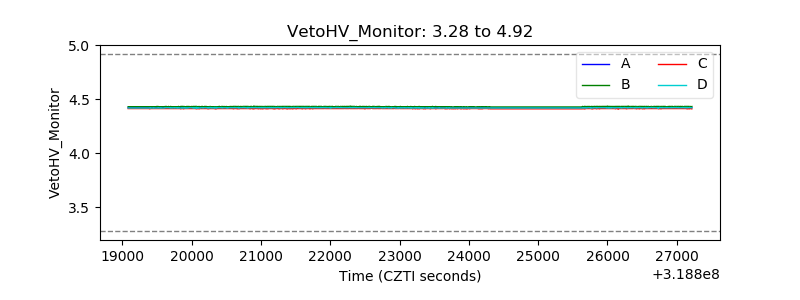 |
| Veto LLD | 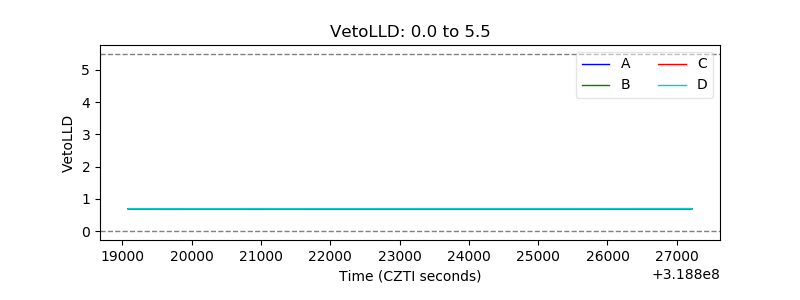 |
| Alpha Counter | 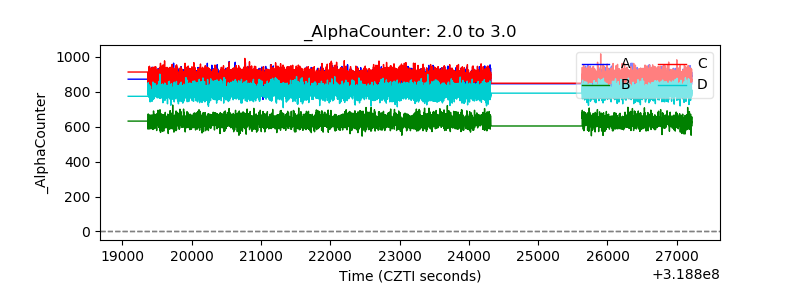 |
| _CPM_Rate | 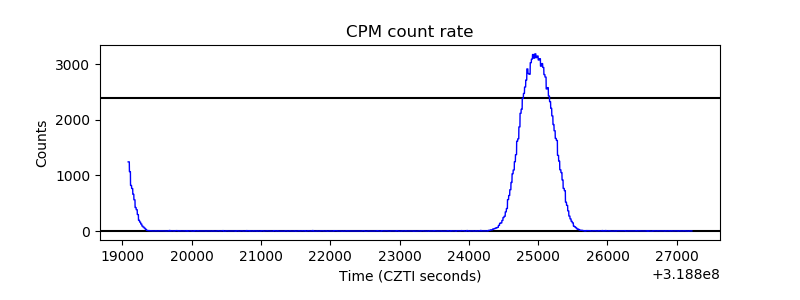 |
| CZT Counter |  |
| +2.5 Volts monitor |  |
| +5 Volts monitor |  |
| _ROLL_ROT |  |
| _Roll_DEC | 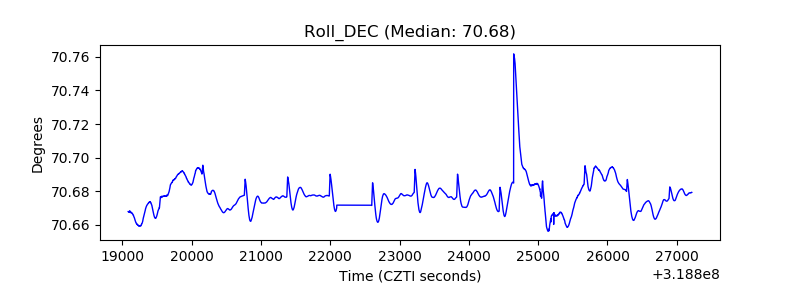 |
| _Roll_RA |  |
| Veto Counter | 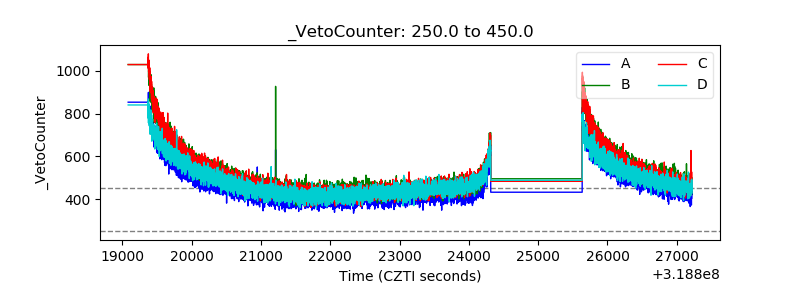 |