| Param | Original file | Final file |
|---|---|---|
| Filename | modeM0/AS1A07_054T01_9000003486_23594cztM0_level2.evt | modeM0/AS1A07_054T01_9000003486_23594cztM0_level2_quad_clean.evt |
| Size (bytes) | 1,383,966,720 | 379,350,720 |
| Size | 1.3 GB | 361.8 MB |
| Events in quadrant A | 8,917,214 | 2,627,468 |
| Events in quadrant B | 10,756,053 | 2,647,058 |
| Events in quadrant C | 9,470,621 | 2,506,576 |
| Events in quadrant D | 11,513,672 | 2,428,747 |
| Mode SS | |||
|---|---|---|---|
| Quadrant | BADHDUFLAG | Total packets | Discarded packets |
| A | 0 | 380 | 0 |
| B | 0 | 380 | 0 |
| C | 0 | 380 | 0 |
| D | 0 | 380 | 0 |
| Mode M9 | |||
|---|---|---|---|
| Quadrant | BADHDUFLAG | Total packets | Discarded packets |
| A | 0 | 50 | 0 |
| B | 0 | 50 | 0 |
| C | 0 | 50 | 0 |
| D | 0 | 50 | 0 |
| Mode M0 | |||
|---|---|---|---|
| Quadrant | BADHDUFLAG | Total packets | Discarded packets |
| A | 0 | 38391 | 4 |
| B | 0 | 43986 | 4 |
| C | 0 | 40159 | 4 |
| D | 0 | 46491 | 4 |
| Quadrant | Total seconds | Saturated seconds | Saturation percentage |
|---|---|---|---|
| A | 18596 | 51 | 0.274253% |
| B | 18597 | 657 | 3.532828% |
| C | 18597 | 414 | 2.226166% |
| D | 18597 | 260 | 1.398075% |
Noise dominated data is calculated using 1-second bins in cleaned event files. If a bin has >2000 counts, and if more than 50% of those come from <1% of pixels, then it is considered to be noise-dominated and hence unusable.
| Quadrant | # 1 sec bins | Bins with >0 counts | Bins with >2000 counts | High rate bins dominated by noise | Noise dominated (total time) | Noise dominated (detector-on time) | Marked lightcurve |
|---|---|---|---|---|---|---|---|
| A | 23662 | 18600 | 0 | 0 | 0.00% | 0.00% | 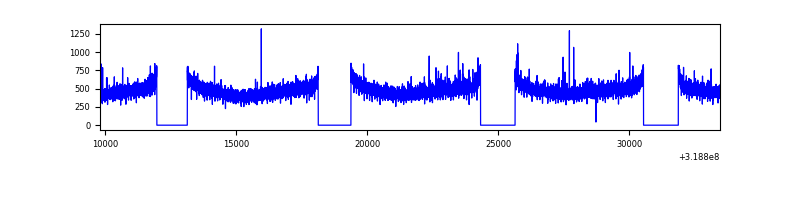 |
| B | 23663 | 18600 | 451 | 451 | 1.91% | 2.42% | 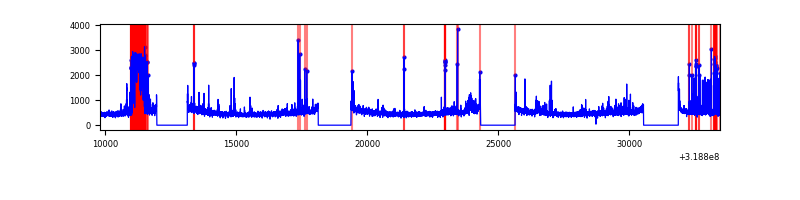 |
| C | 23663 | 18600 | 171 | 171 | 0.72% | 0.92% | 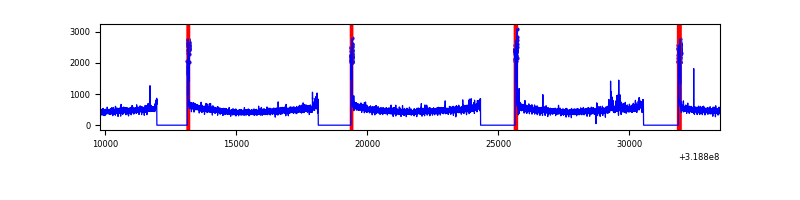 |
| D | 23663 | 18601 | 147 | 147 | 0.62% | 0.79% | 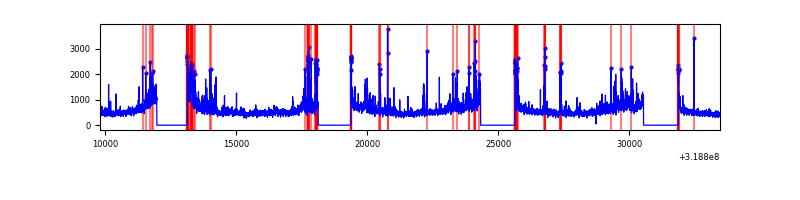 |
Top three noisy pixels from each quadrant. If the there are fewer than three noisy pixels in the level2.evt file, extra rows are filled as -1
| Pixel properties | Quadrant properties | ||||||
|---|---|---|---|---|---|---|---|
| Quadrant | DetID | PixID | Counts | Sigma | Mean | Median | Sigma |
| A | 6 | 16 | 44456 | 93.22 | 2299 | 2254 | 452.7 |
| A | 13 | 254 | 32154 | 66.05 | 2299 | 2254 | 452.7 |
| A | 0 | 226 | 19759 | 38.67 | 2299 | 2254 | 452.7 |
| B | 3 | 64 | 1323509 | 3187.08 | 2268 | 2215 | 414.6 |
| B | 0 | 189 | 387761 | 929.97 | 2268 | 2215 | 414.6 |
| B | 0 | 230 | 52014 | 120.12 | 2268 | 2215 | 414.6 |
| C | 0 | 10 | 590092 | 1187.37 | 2162 | 2173 | 495.1 |
| C | 14 | 238 | 354278 | 711.12 | 2162 | 2173 | 495.1 |
| C | 7 | 247 | 46664 | 89.85 | 2162 | 2173 | 495.1 |
| D | 1 | 52 | 1573349 | 2978.52 | 2189 | 2122 | 527.5 |
| D | 7 | 223 | 1053831 | 1993.69 | 2189 | 2122 | 527.5 |
| D | 9 | 85 | 234510 | 440.53 | 2189 | 2122 | 527.5 |
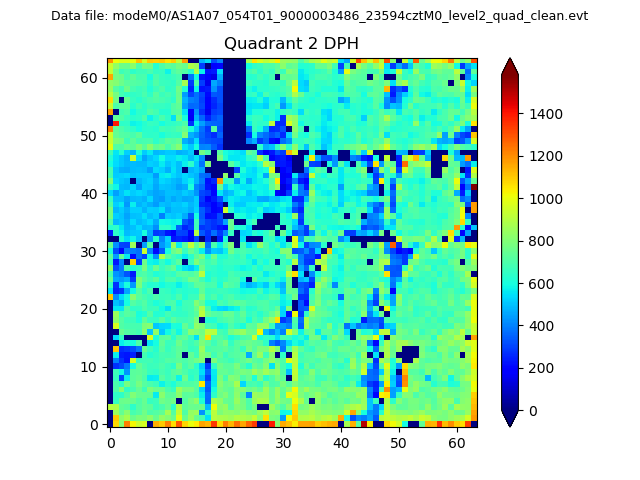
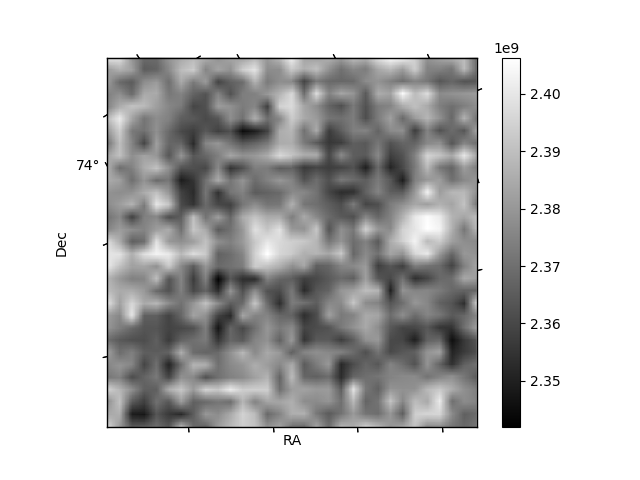
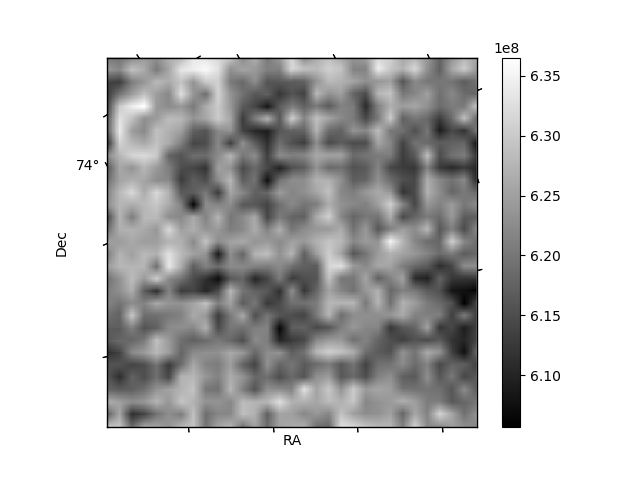
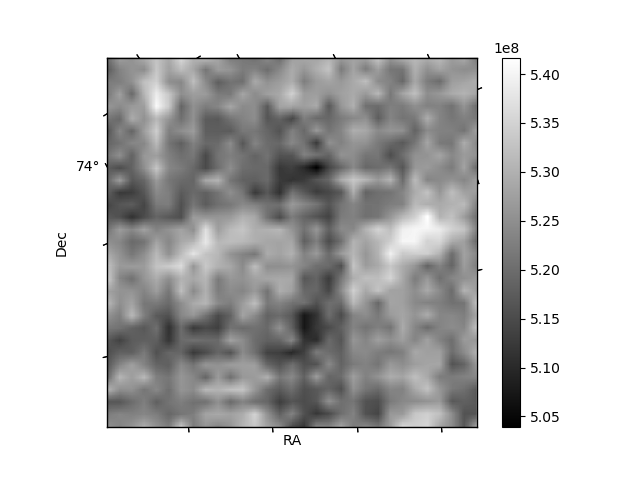
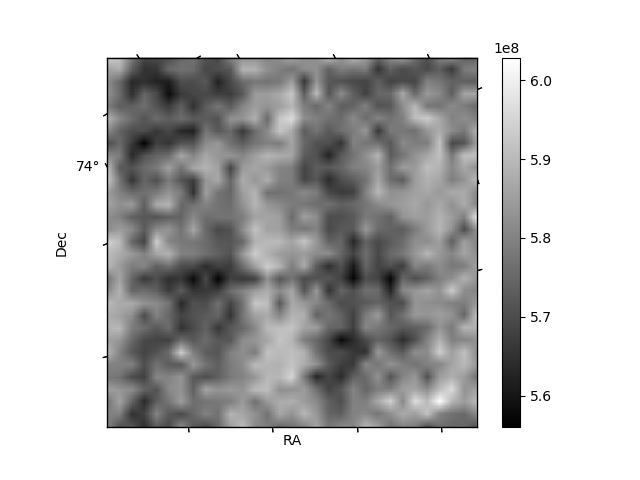
Histogram calculated using DETX and DETY for each event in the final _common_clean file
| Quadrant A | 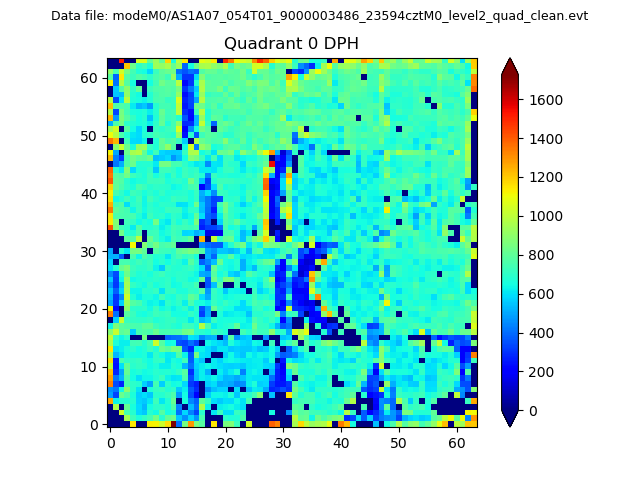 |
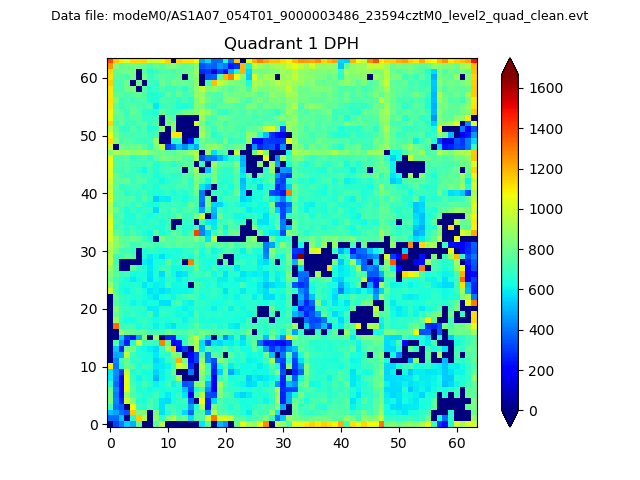 |
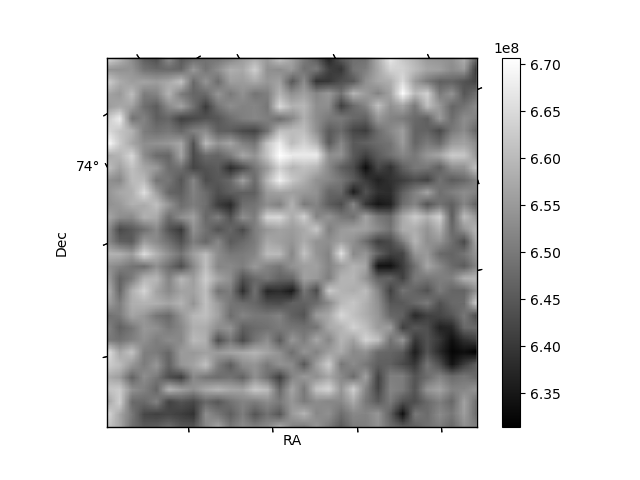
Quadrant B |
|---|---|---|---|
| Quadrant D | 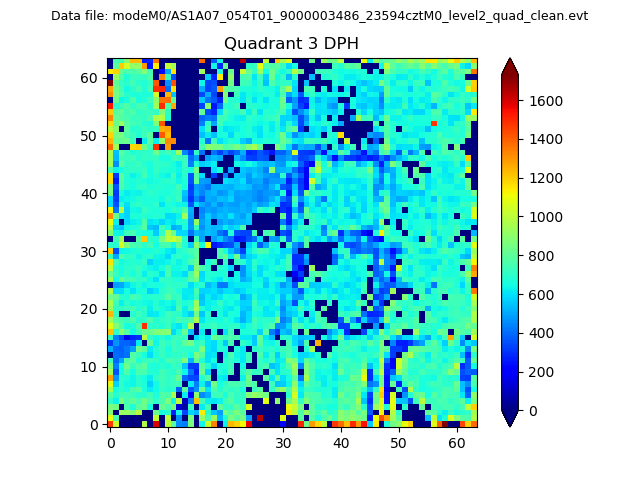 |
 |
Quadrant C |
| Plot type | Count rate plots | Images |
|---|---|---|
| Comparison with Poisson distribution Blue bars denote a histogram of data divided into 1 sec bins. Red curve is a Poisson curve with rate = median count rate of data. |
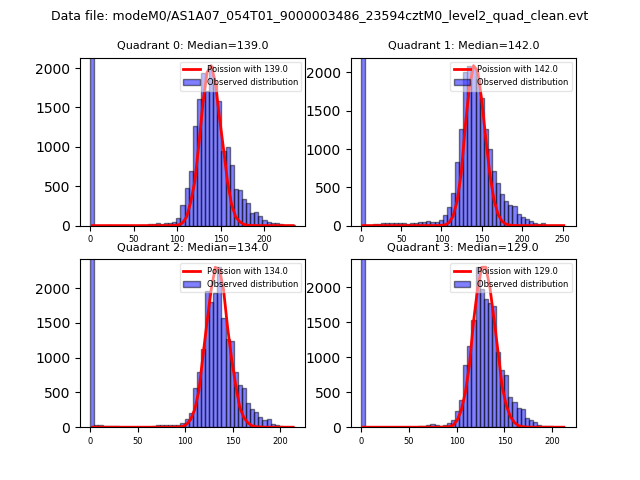 |
 |
| Quadrant-wise count rates Data is divided into 100 sec bins |
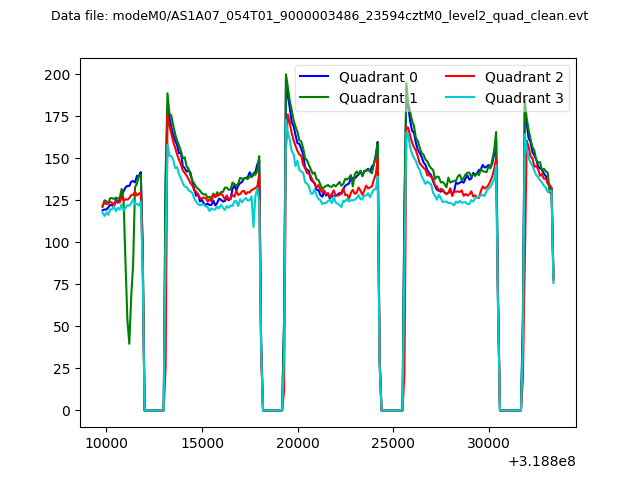 |
|
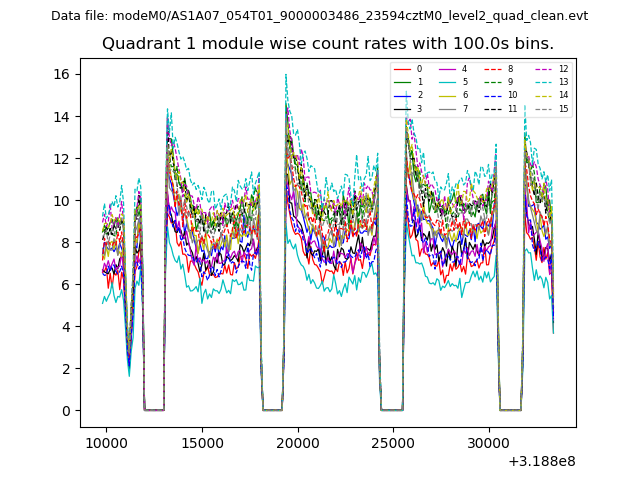
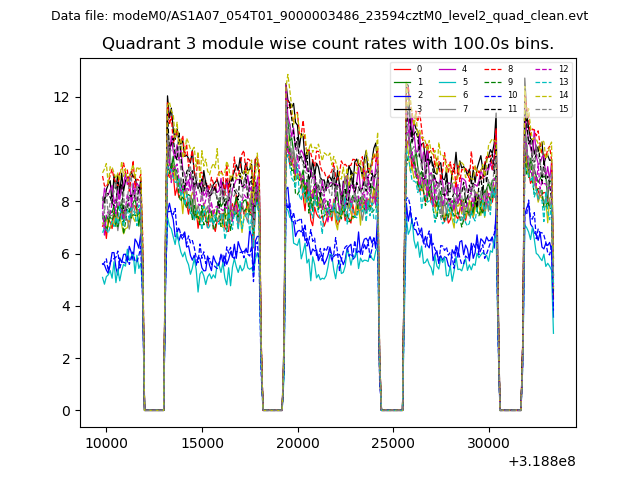
| Module-wise count rates for Quadrant A Data is divided into 100 sec bins |
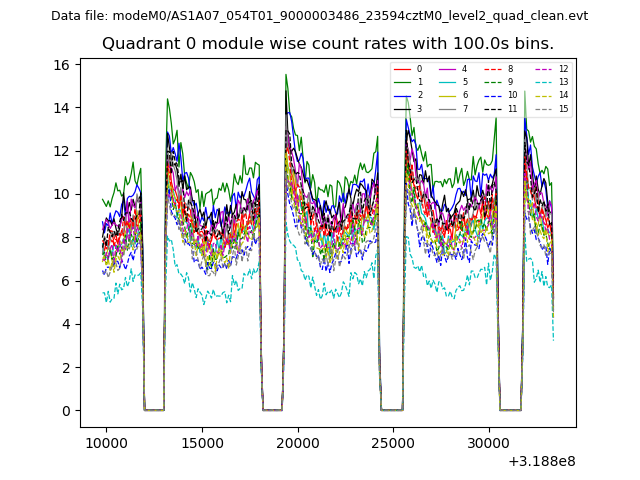 |
 |
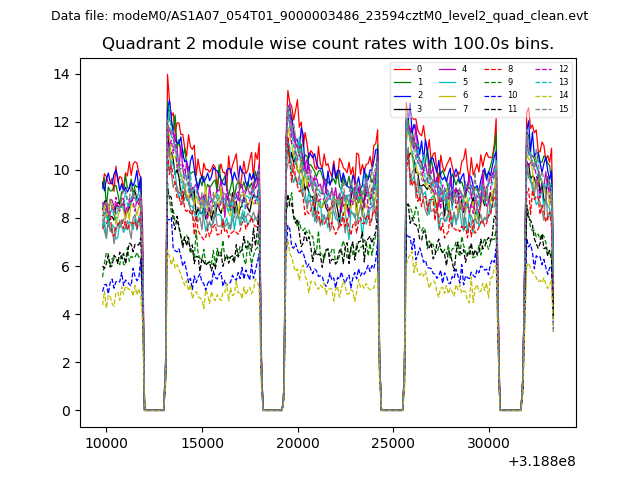
| Module-wise count rates for Quadrant B Data is divided into 100 sec bins |
 |
 |
| Module-wise count rates for Quadrant C Data is divided into 100 sec bins |
 |
 |
| Module-wise count rates for Quadrant D Data is divided into 100 sec bins |
 |
 |
| Parameter | Plot |
|---|---|
| CZT HV Monitor | 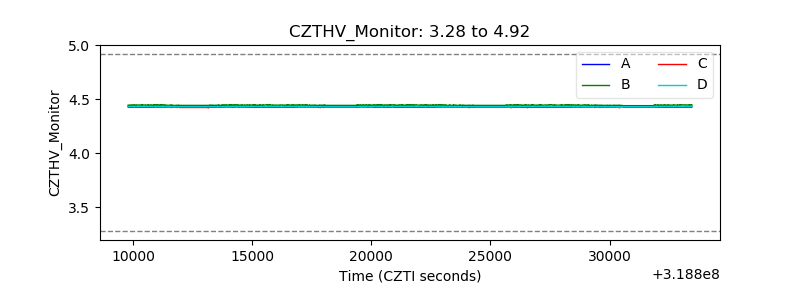 |
| D_VDD | 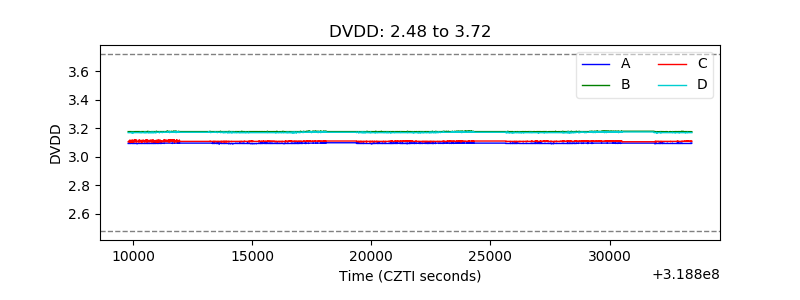 |
| Temperature 1 | 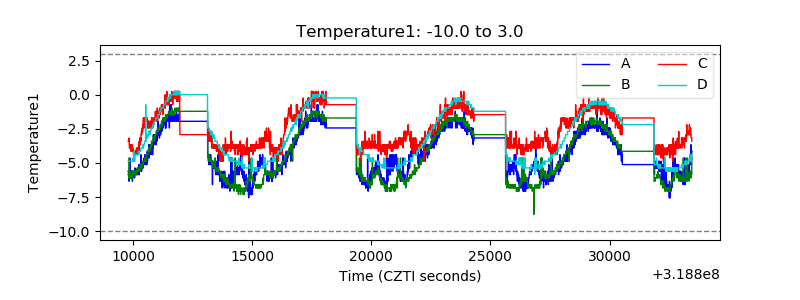 |
| Veto HV Monitor | 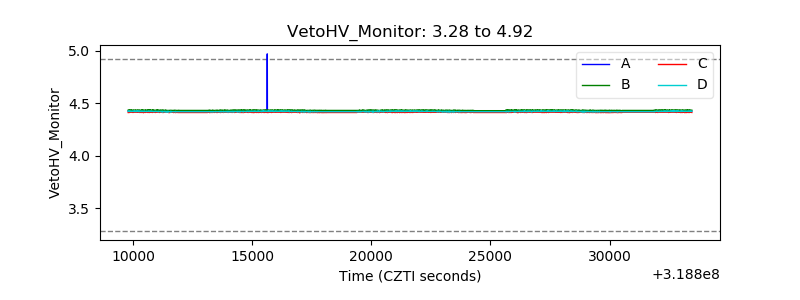 |
| Veto LLD | 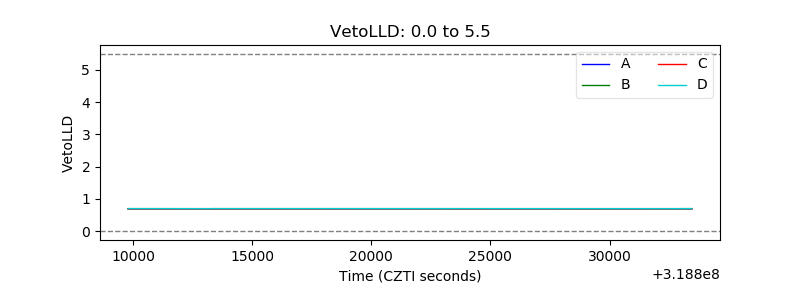 |
| Alpha Counter |  |
| _CPM_Rate | 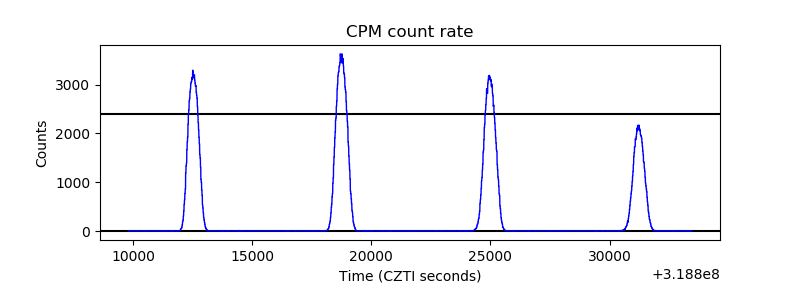 |
| CZT Counter | 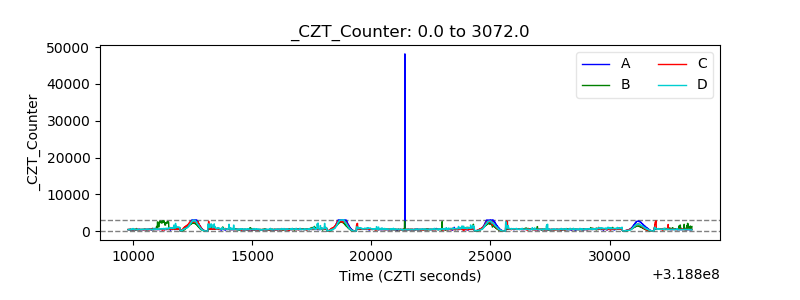 |
| +2.5 Volts monitor |  |
| +5 Volts monitor |  |
| _ROLL_ROT | 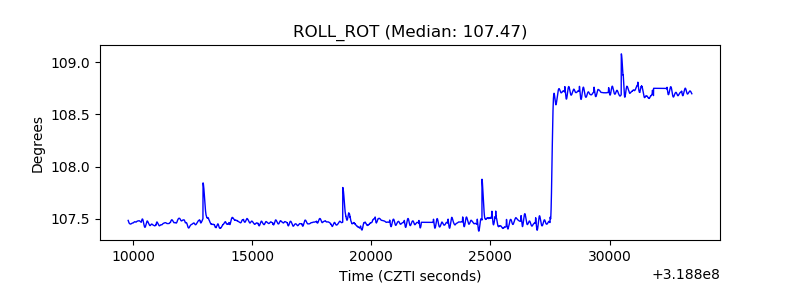 |
| _Roll_DEC | 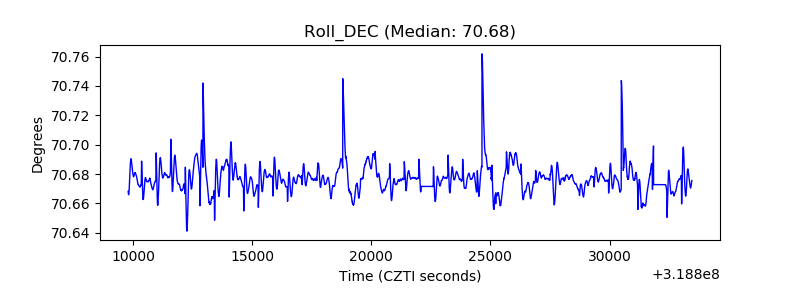 |
| _Roll_RA | 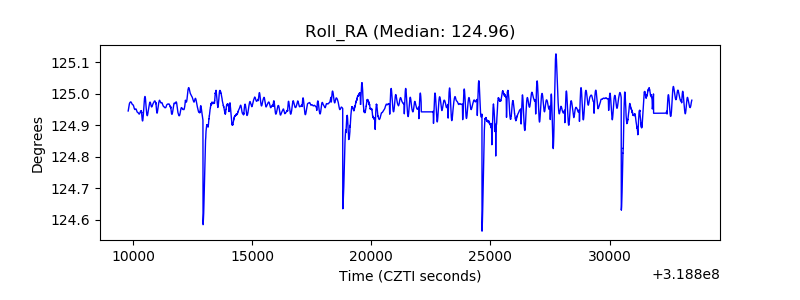 |
| Veto Counter | 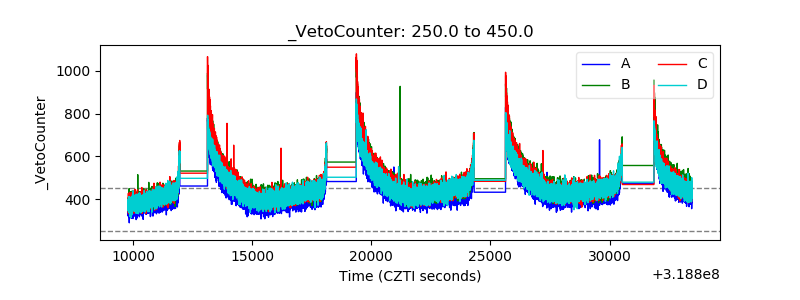 |