| Param | Original file | Final file |
|---|---|---|
| Filename | modeM0/AS1A07_054T01_9000003486_23596cztM0_level2.evt | modeM0/AS1A07_054T01_9000003486_23596cztM0_level2_quad_clean.evt |
| Size (bytes) | 446,273,280 | 127,465,920 |
| Size | 425.6 MB | 121.6 MB |
| Events in quadrant A | 3,034,763 | 872,586 |
| Events in quadrant B | 3,473,268 | 878,756 |
| Events in quadrant C | 3,102,844 | 834,496 |
| Events in quadrant D | 3,458,690 | 817,508 |
| Mode SS | |||
|---|---|---|---|
| Quadrant | BADHDUFLAG | Total packets | Discarded packets |
| A | 0 | 134 | 0 |
| B | 0 | 134 | 0 |
| C | 0 | 134 | 0 |
| D | 0 | 134 | 0 |
| Mode M9 | |||
|---|---|---|---|
| Quadrant | BADHDUFLAG | Total packets | Discarded packets |
| A | 0 | 9 | 0 |
| B | 0 | 9 | 0 |
| C | 0 | 9 | 0 |
| D | 0 | 9 | 0 |
| Mode M0 | |||
|---|---|---|---|
| Quadrant | BADHDUFLAG | Total packets | Discarded packets |
| A | 0 | 13312 | 1 |
| B | 0 | 14521 | 1 |
| C | 0 | 13511 | 1 |
| D | 0 | 14442 | 1 |
| Quadrant | Total seconds | Saturated seconds | Saturation percentage |
|---|---|---|---|
| A | 6553 | 92 | 1.403937% |
| B | 6554 | 164 | 2.502289% |
| C | 6554 | 127 | 1.937748% |
| D | 6554 | 89 | 1.357949% |
Noise dominated data is calculated using 1-second bins in cleaned event files. If a bin has >2000 counts, and if more than 50% of those come from <1% of pixels, then it is considered to be noise-dominated and hence unusable.
| Quadrant | # 1 sec bins | Bins with >0 counts | Bins with >2000 counts | High rate bins dominated by noise | Noise dominated (total time) | Noise dominated (detector-on time) | Marked lightcurve |
|---|---|---|---|---|---|---|---|
| A | 7508 | 6553 | 0 | 0 | 0.00% | 0.00% |  |
| B | 7509 | 6554 | 36 | 36 | 0.48% | 0.55% |  |
| C | 7509 | 6554 | 13 | 13 | 0.17% | 0.20% |  |
| D | 7509 | 6554 | 18 | 18 | 0.24% | 0.27% |  |
Top three noisy pixels from each quadrant. If the there are fewer than three noisy pixels in the level2.evt file, extra rows are filled as -1
| Pixel properties | Quadrant properties | ||||||
|---|---|---|---|---|---|---|---|
| Quadrant | DetID | PixID | Counts | Sigma | Mean | Median | Sigma |
| A | 13 | 254 | 12206 | 73.16 | 786 | 770 | 156.3 |
| A | 3 | 137 | 6881 | 39.1 | 786 | 770 | 156.3 |
| A | 0 | 226 | 6750 | 38.26 | 786 | 770 | 156.3 |
| B | 0 | 189 | 228819 | 1536.01 | 779 | 759 | 148.5 |
| B | 3 | 64 | 130666 | 874.94 | 779 | 759 | 148.5 |
| B | 0 | 230 | 31916 | 209.85 | 779 | 759 | 148.5 |
| C | 14 | 238 | 120698 | 697.56 | 745 | 749 | 172.0 |
| C | 0 | 10 | 59021 | 338.88 | 745 | 749 | 172.0 |
| C | 3 | 233 | 10093 | 54.34 | 745 | 749 | 172.0 |
| D | 7 | 223 | 208258 | 1142.02 | 755 | 732 | 181.7 |
| D | 12 | 233 | 184863 | 1013.28 | 755 | 732 | 181.7 |
| D | 1 | 52 | 174319 | 955.25 | 755 | 732 | 181.7 |
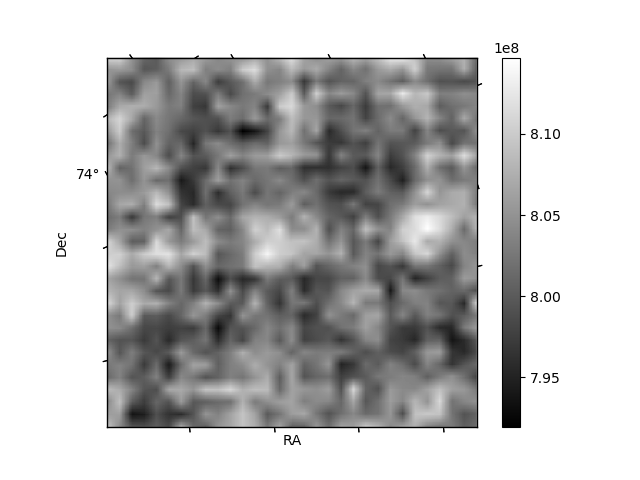
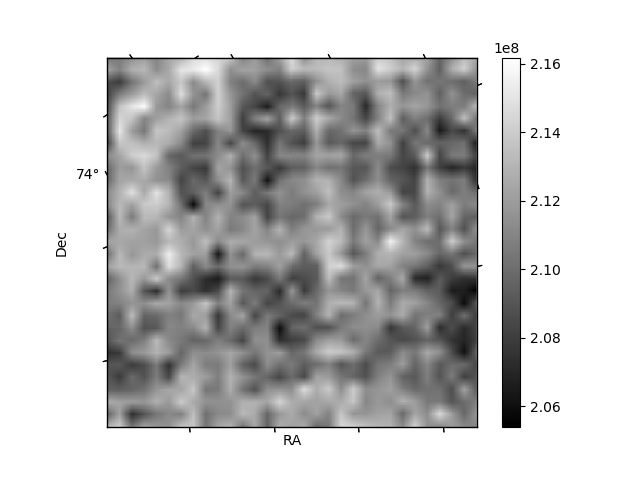
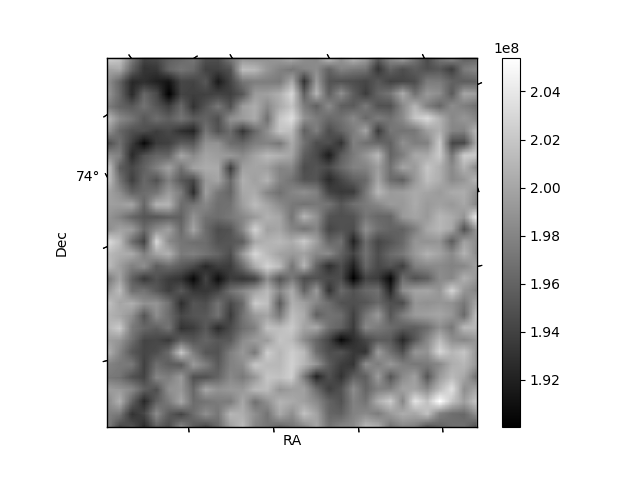
Histogram calculated using DETX and DETY for each event in the final _common_clean file
| Quadrant A | 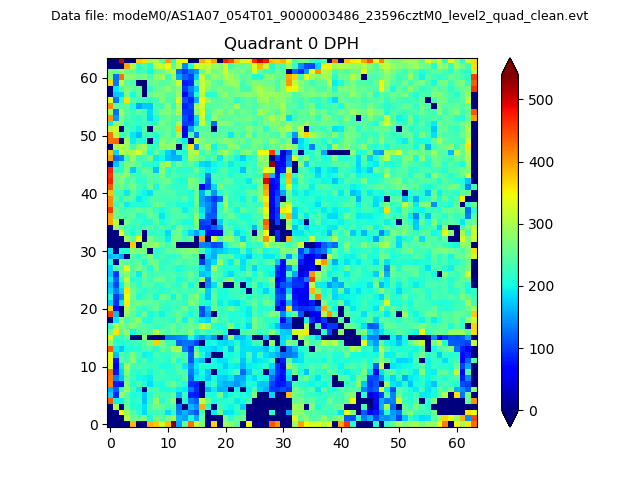 |
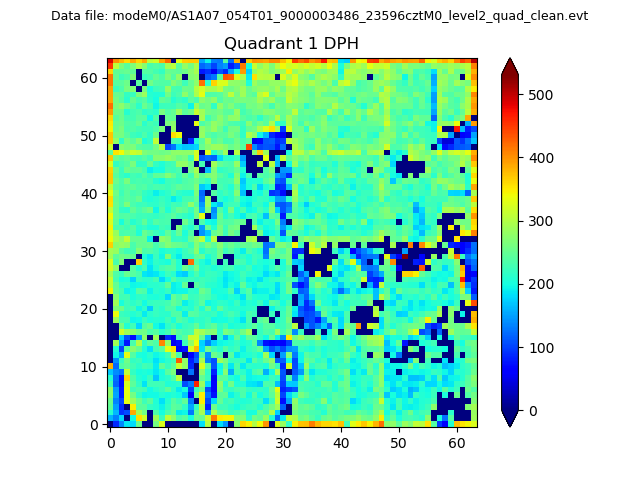 |
Quadrant B |
|---|---|---|---|
| Quadrant D | 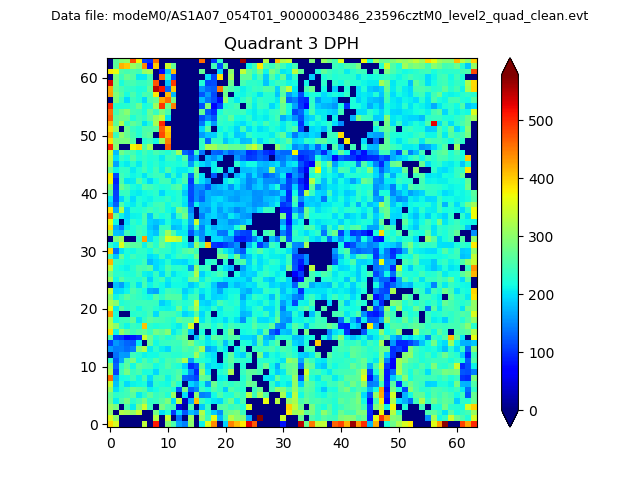 |
 |
Quadrant C |
| Plot type | Count rate plots | Images |
|---|---|---|
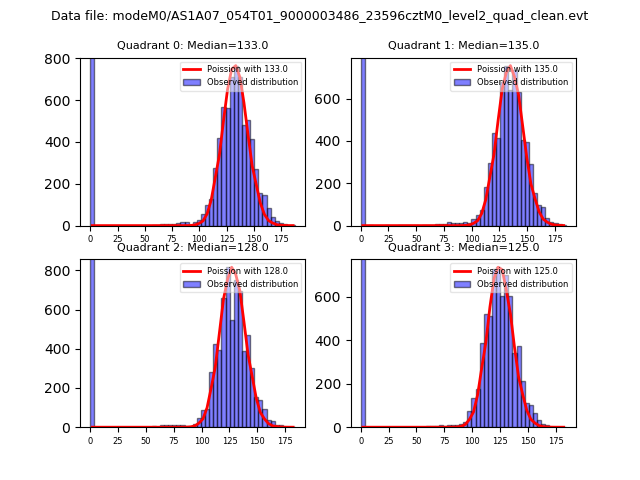
| Comparison with Poisson distribution Blue bars denote a histogram of data divided into 1 sec bins. Red curve is a Poisson curve with rate = median count rate of data. |
 |
 |
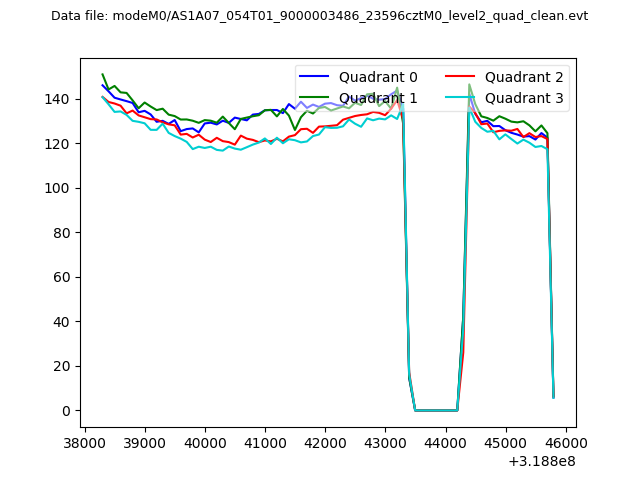
| Quadrant-wise count rates Data is divided into 100 sec bins |
 |
|
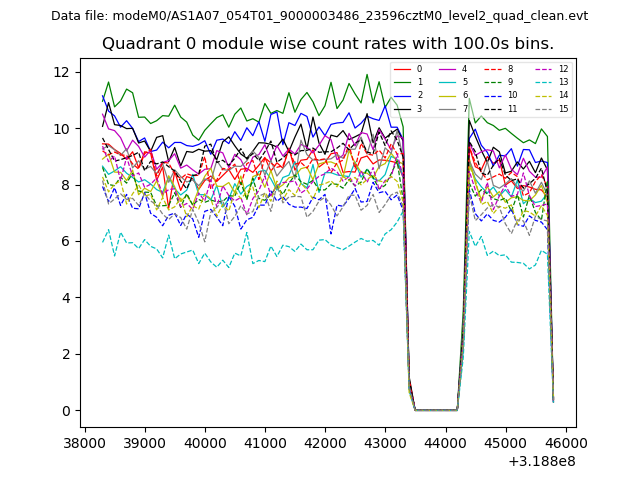
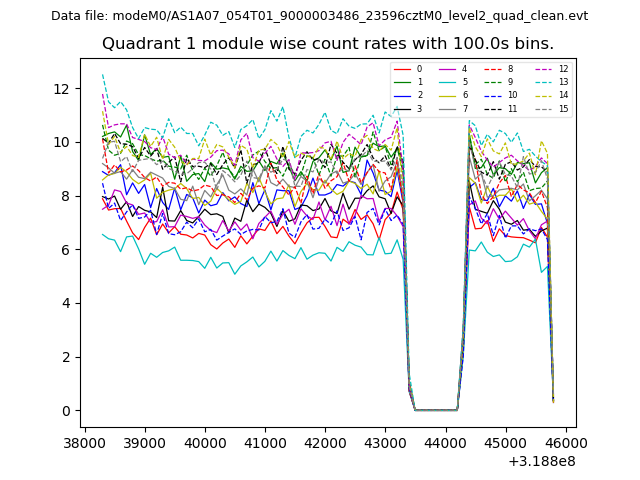
| Module-wise count rates for Quadrant A Data is divided into 100 sec bins |
 |
 |
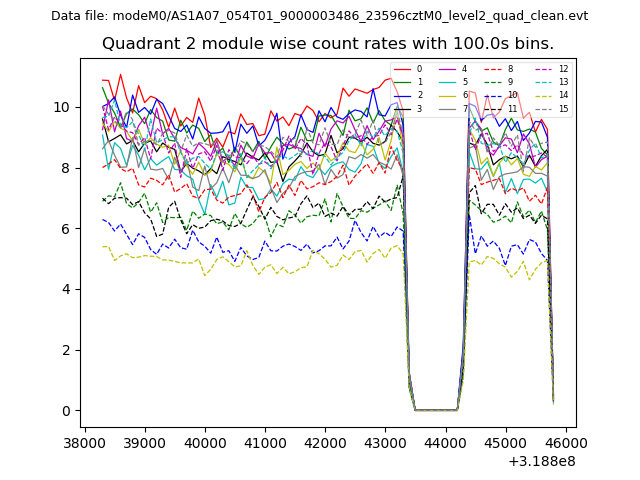
| Module-wise count rates for Quadrant B Data is divided into 100 sec bins |
 |
 |
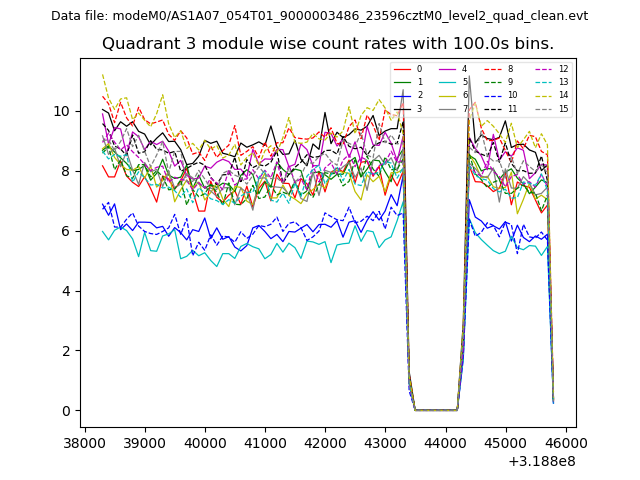
| Module-wise count rates for Quadrant C Data is divided into 100 sec bins |
 |
 |
| Module-wise count rates for Quadrant D Data is divided into 100 sec bins |
 |
 |
| Parameter | Plot |
|---|---|
| CZT HV Monitor | 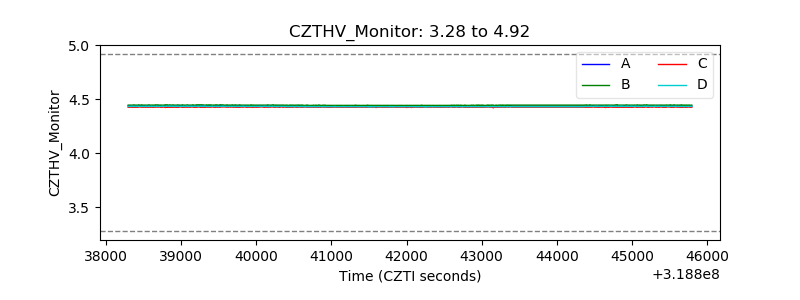 |
| D_VDD | 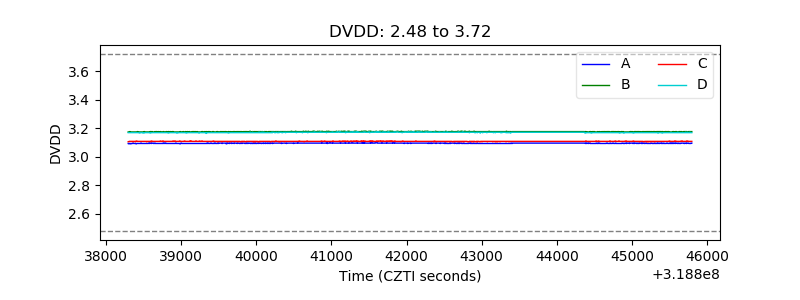 |
| Temperature 1 | 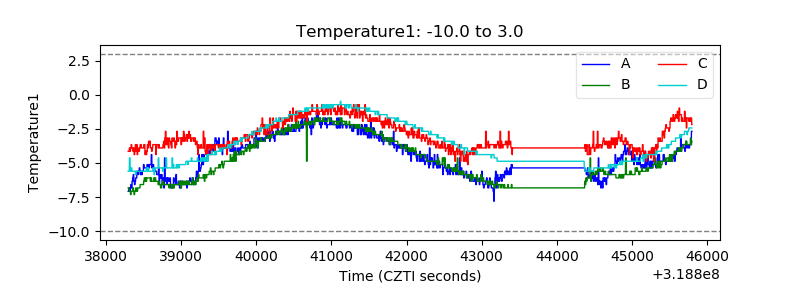 |
| Veto HV Monitor | 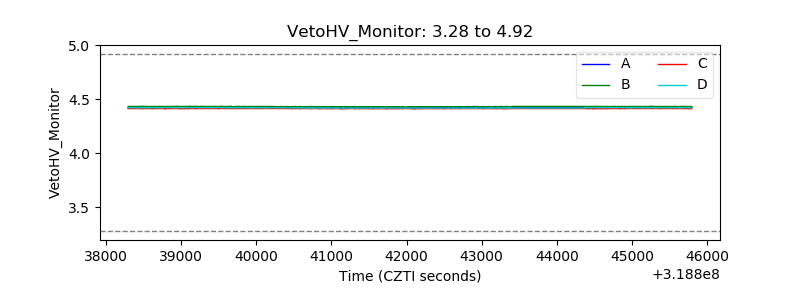 |
| Veto LLD | 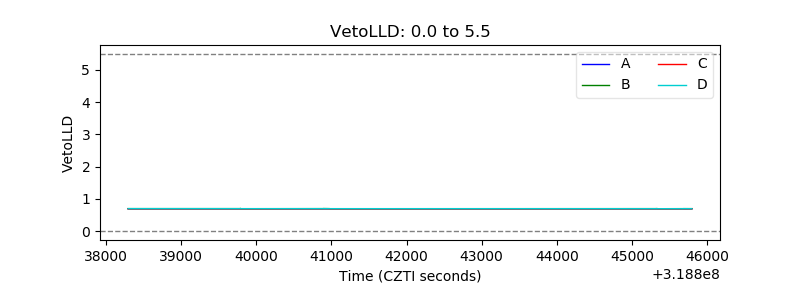 |
| Alpha Counter | 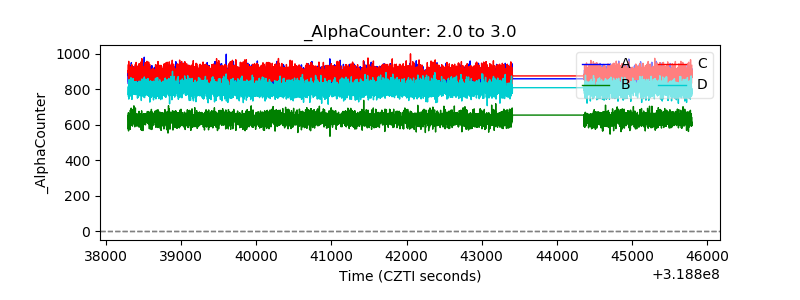 |
| _CPM_Rate | 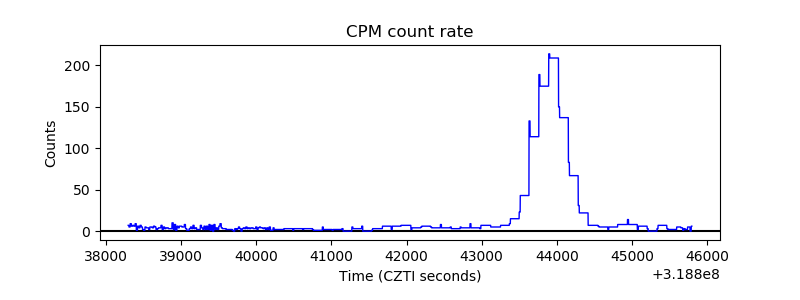 |
| CZT Counter | 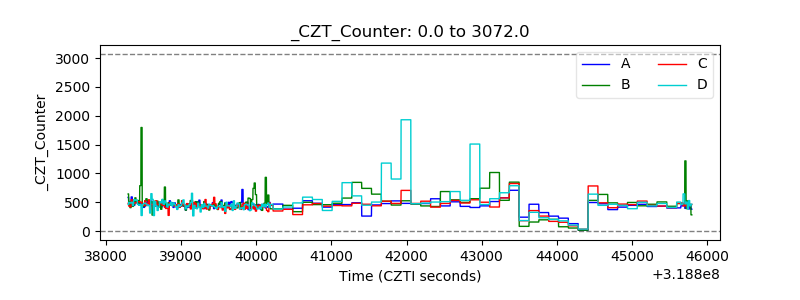 |
| +2.5 Volts monitor |  |
| +5 Volts monitor | 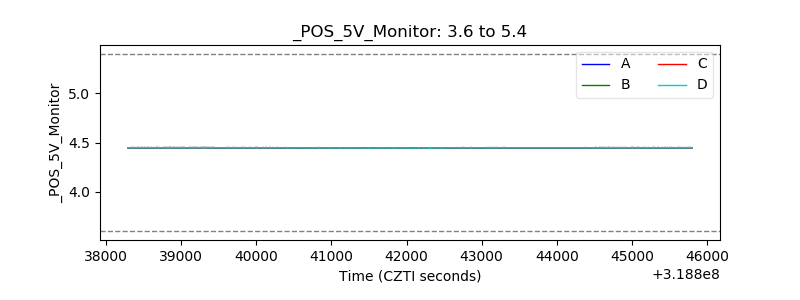 |
| _ROLL_ROT | 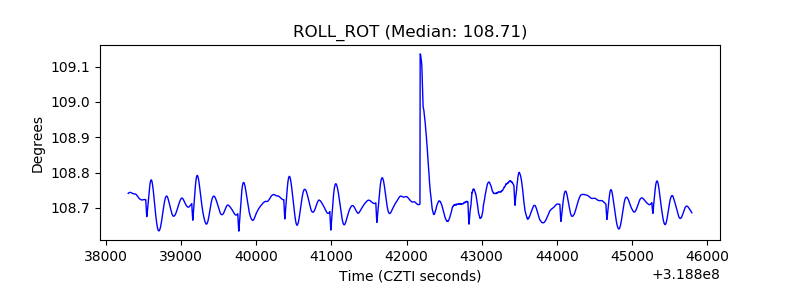 |
| _Roll_DEC | 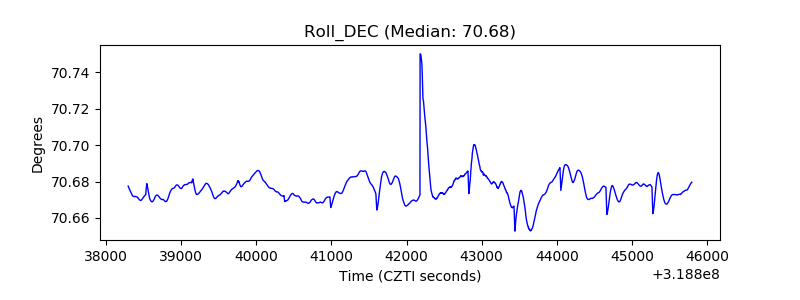 |
| _Roll_RA | 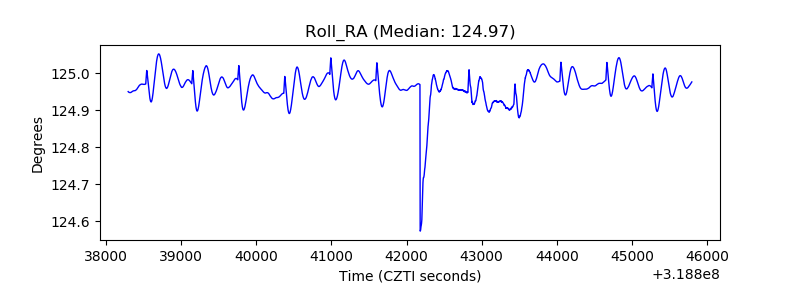 |
| Veto Counter | 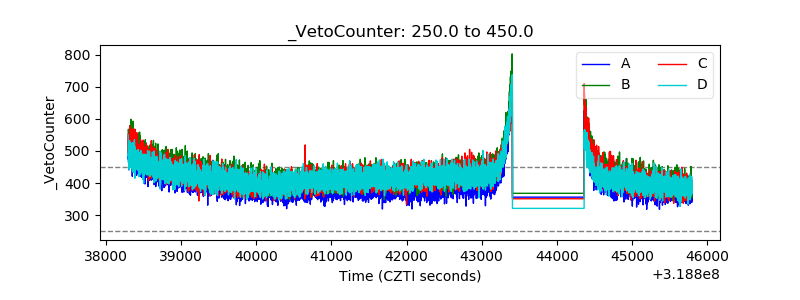 |