| Param | Original file | Final file |
|---|---|---|
| Filename | modeM0/AS1A07_054T01_9000003486_23597cztM0_level2.evt | modeM0/AS1A07_054T01_9000003486_23597cztM0_level2_quad_clean.evt |
| Size (bytes) | 475,513,920 | 132,799,680 |
| Size | 453.5 MB | 126.6 MB |
| Events in quadrant A | 3,208,199 | 906,073 |
| Events in quadrant B | 3,611,393 | 911,480 |
| Events in quadrant C | 3,252,451 | 864,498 |
| Events in quadrant D | 3,849,342 | 848,662 |
| Mode SS | |||
|---|---|---|---|
| Quadrant | BADHDUFLAG | Total packets | Discarded packets |
| A | 0 | 144 | 0 |
| B | 0 | 144 | 0 |
| C | 0 | 144 | 0 |
| D | 0 | 144 | 0 |
| Mode M9 | |||
|---|---|---|---|
| Quadrant | BADHDUFLAG | Total packets | Discarded packets |
| A | 0 | 5 | 0 |
| B | 0 | 5 | 0 |
| C | 0 | 5 | 0 |
| D | 0 | 5 | 0 |
| Mode M0 | |||
|---|---|---|---|
| Quadrant | BADHDUFLAG | Total packets | Discarded packets |
| A | 0 | 14287 | 1 |
| B | 0 | 15188 | 1 |
| C | 0 | 14329 | 1 |
| D | 0 | 16102 | 1 |
| Quadrant | Total seconds | Saturated seconds | Saturation percentage |
|---|---|---|---|
| A | 7051 | 99 | 1.404056% |
| B | 7052 | 146 | 2.070335% |
| C | 7052 | 125 | 1.772547% |
| D | 7052 | 142 | 2.013613% |
Noise dominated data is calculated using 1-second bins in cleaned event files. If a bin has >2000 counts, and if more than 50% of those come from <1% of pixels, then it is considered to be noise-dominated and hence unusable.
| Quadrant | # 1 sec bins | Bins with >0 counts | Bins with >2000 counts | High rate bins dominated by noise | Noise dominated (total time) | Noise dominated (detector-on time) | Marked lightcurve |
|---|---|---|---|---|---|---|---|
| A | 7606 | 7051 | 0 | 0 | 0.00% | 0.00% | 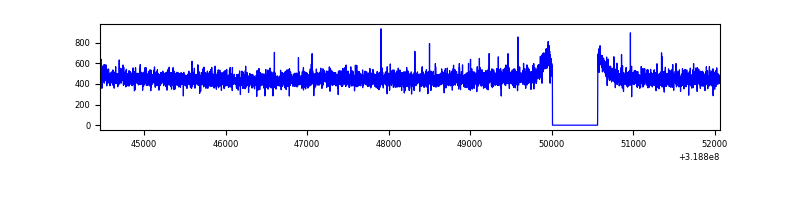 |
| B | 7607 | 7052 | 18 | 18 | 0.24% | 0.26% | 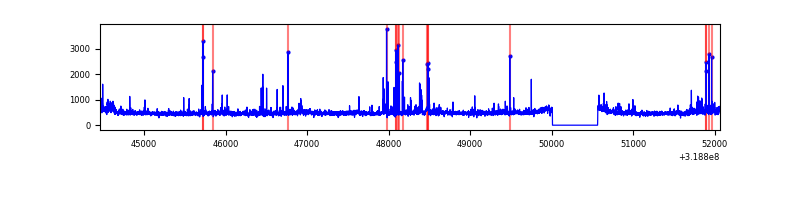 |
| C | 7607 | 7052 | 0 | 0 | 0.00% | 0.00% | 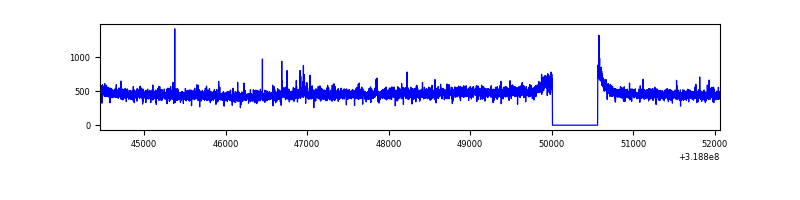 |
| D | 7607 | 7052 | 74 | 74 | 0.97% | 1.05% | 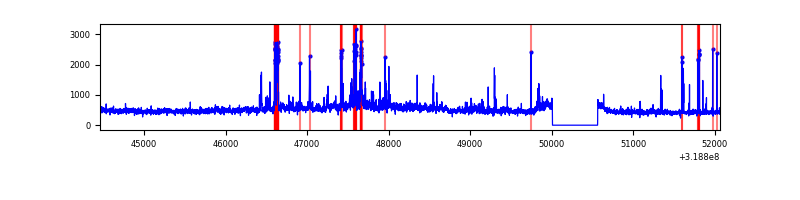 |
Top three noisy pixels from each quadrant. If the there are fewer than three noisy pixels in the level2.evt file, extra rows are filled as -1
| Pixel properties | Quadrant properties | ||||||
|---|---|---|---|---|---|---|---|
| Quadrant | DetID | PixID | Counts | Sigma | Mean | Median | Sigma |
| A | 13 | 254 | 12378 | 69.58 | 831 | 811 | 166.2 |
| A | 3 | 137 | 7343 | 39.29 | 831 | 811 | 166.2 |
| A | 0 | 226 | 6932 | 36.82 | 831 | 811 | 166.2 |
| B | 0 | 189 | 143518 | 917.44 | 825 | 804 | 155.6 |
| B | 3 | 64 | 133252 | 851.44 | 825 | 804 | 155.6 |
| B | 4 | 216 | 39808 | 250.74 | 825 | 804 | 155.6 |
| C | 14 | 238 | 126825 | 693.65 | 789 | 792 | 181.7 |
| C | 7 | 247 | 16050 | 83.98 | 789 | 792 | 181.7 |
| C | 0 | 10 | 10090 | 51.17 | 789 | 792 | 181.7 |
| D | 1 | 52 | 301498 | 1563.62 | 798 | 774 | 192.3 |
| D | 12 | 233 | 242794 | 1258.39 | 798 | 774 | 192.3 |
| D | 7 | 223 | 196522 | 1017.8 | 798 | 774 | 192.3 |
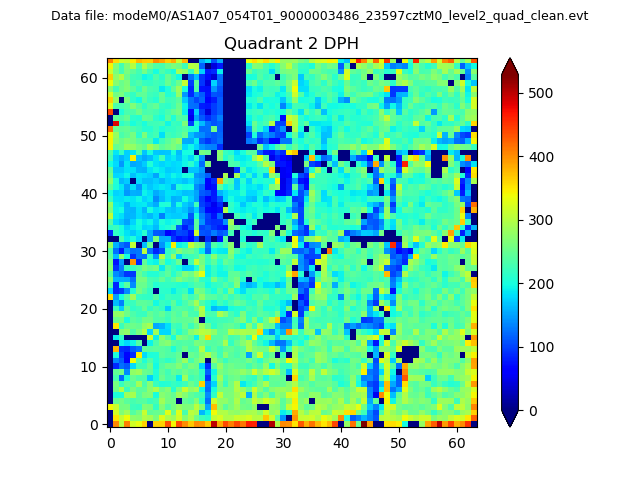
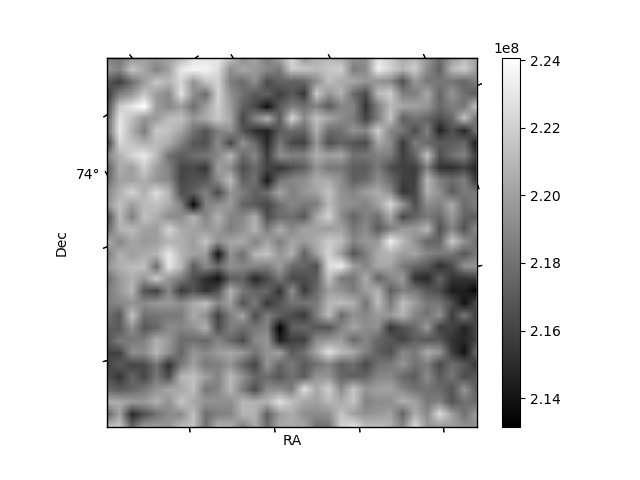
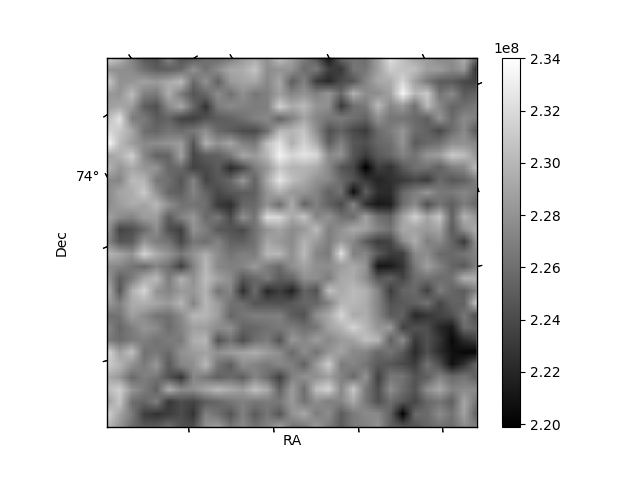
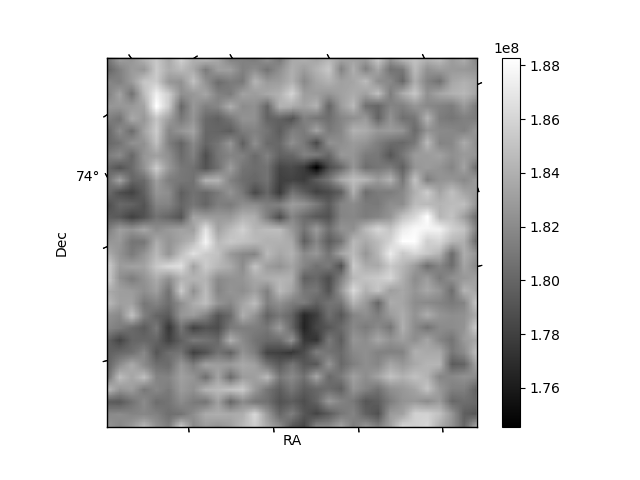
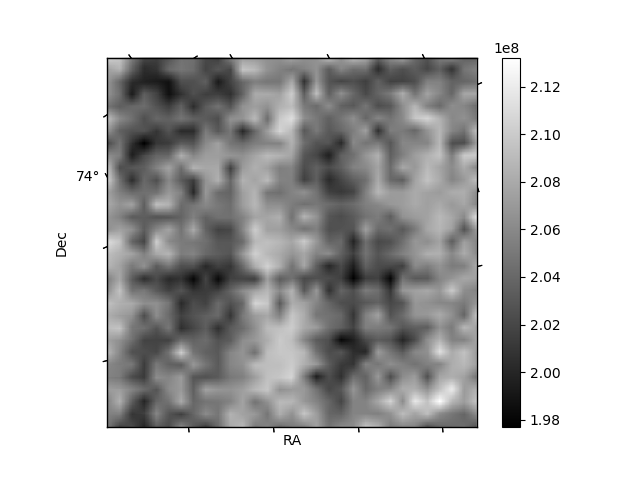
Histogram calculated using DETX and DETY for each event in the final _common_clean file
| Quadrant A | 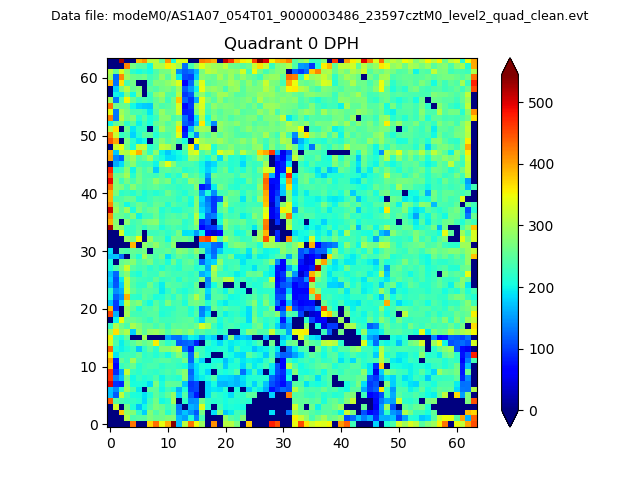 |
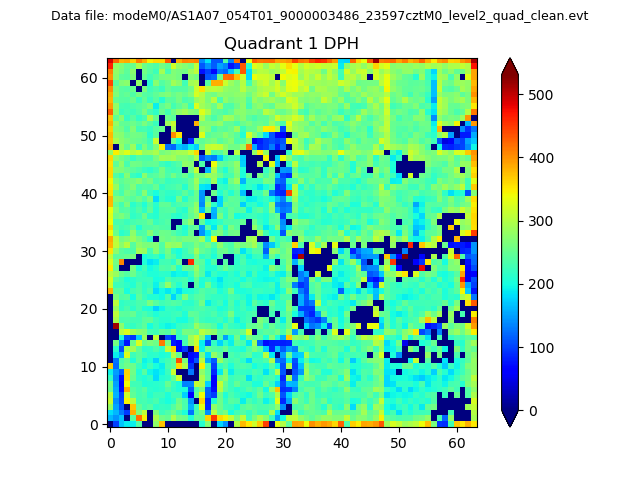 |
Quadrant B |
|---|---|---|---|
| Quadrant D | 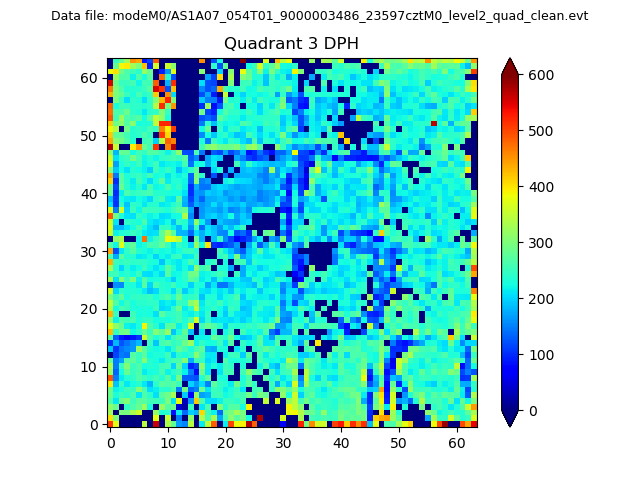 |
 |
Quadrant C |
| Plot type | Count rate plots | Images |
|---|---|---|
| Comparison with Poisson distribution Blue bars denote a histogram of data divided into 1 sec bins. Red curve is a Poisson curve with rate = median count rate of data. |
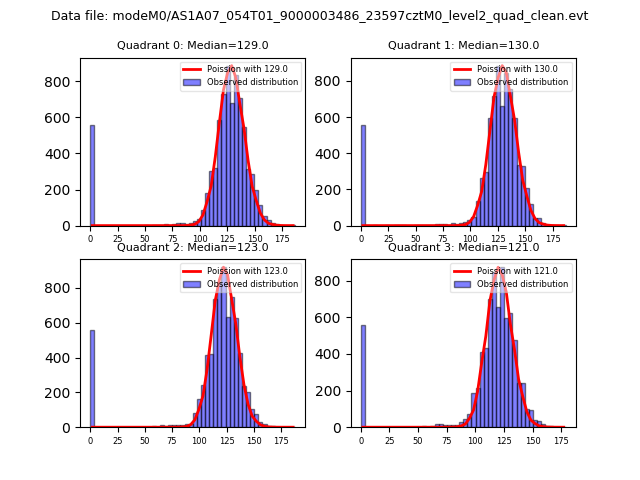 |
 |
| Quadrant-wise count rates Data is divided into 100 sec bins |
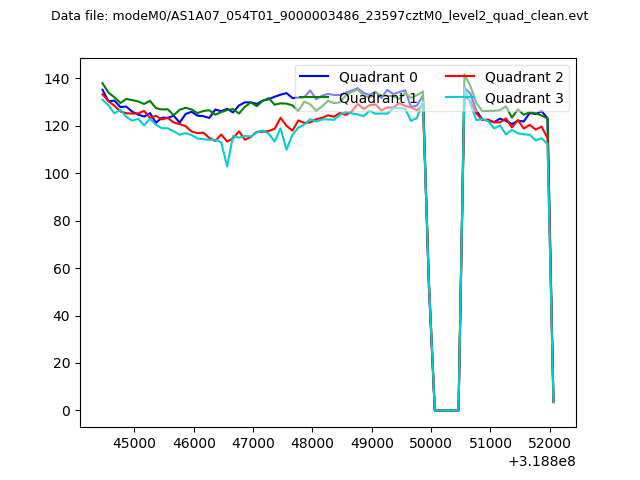 |
|
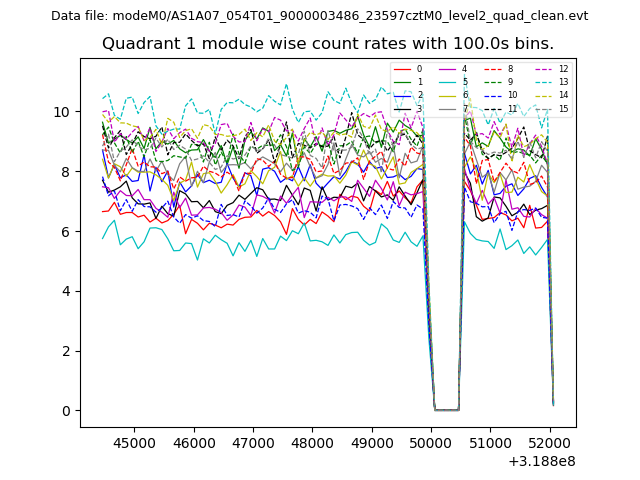
| Module-wise count rates for Quadrant A Data is divided into 100 sec bins |
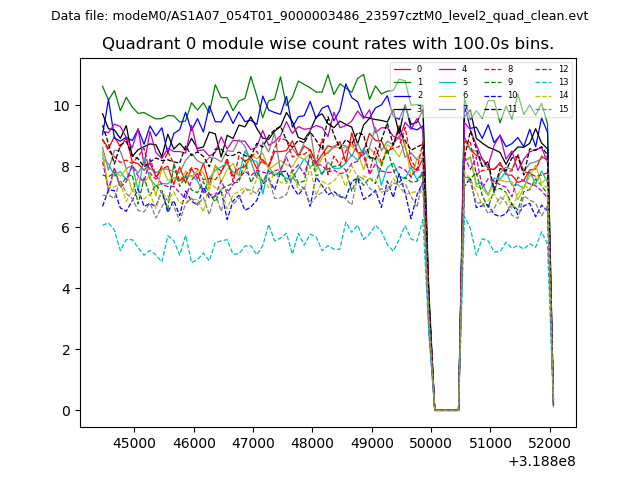 |
 |
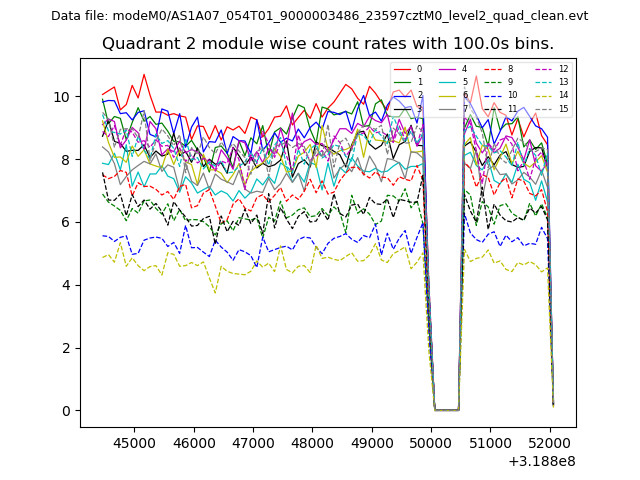
| Module-wise count rates for Quadrant B Data is divided into 100 sec bins |
 |
 |
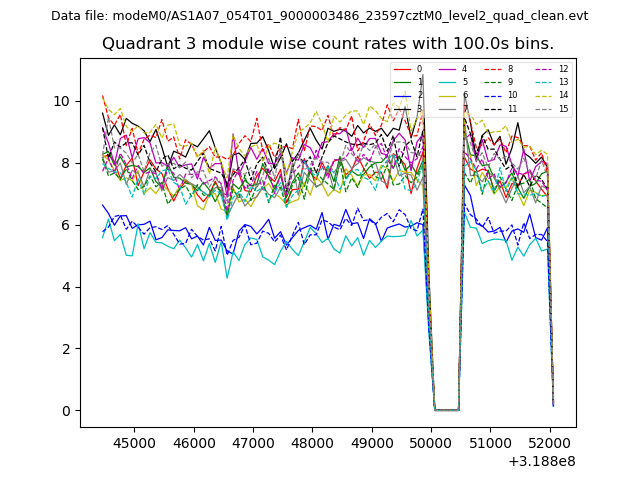
| Module-wise count rates for Quadrant C Data is divided into 100 sec bins |
 |
 |
| Module-wise count rates for Quadrant D Data is divided into 100 sec bins |
 |
 |
| Parameter | Plot |
|---|---|
| CZT HV Monitor | 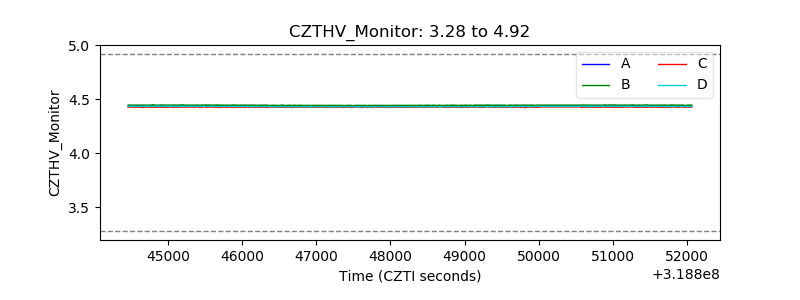 |
| D_VDD | 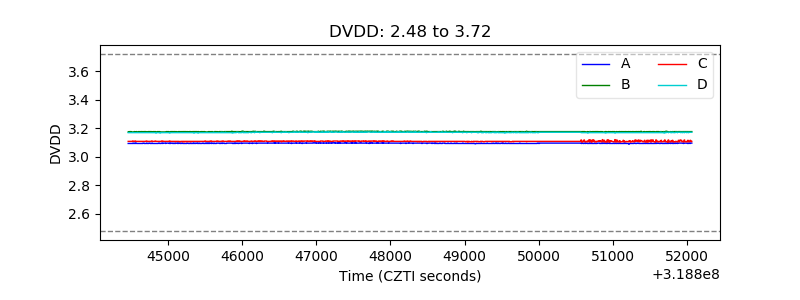 |
| Temperature 1 | 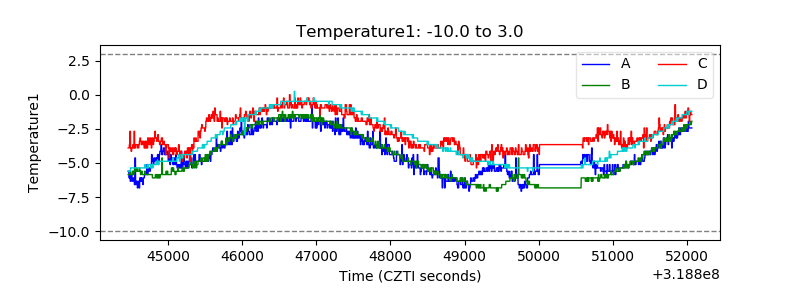 |
| Veto HV Monitor | 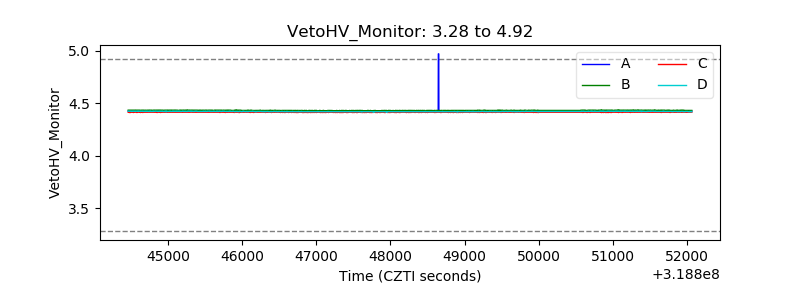 |
| Veto LLD | 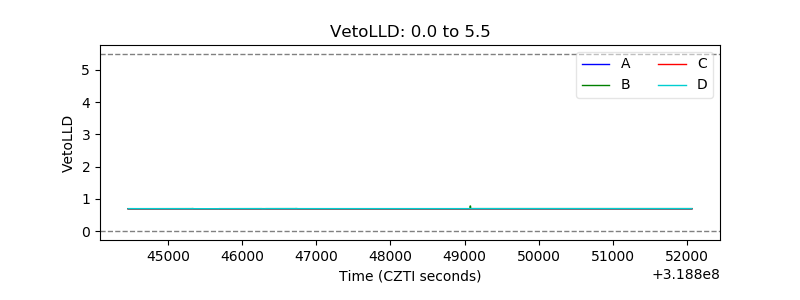 |
| Alpha Counter | 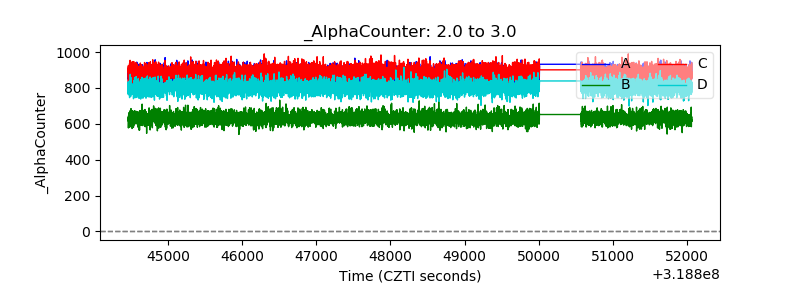 |
| _CPM_Rate | 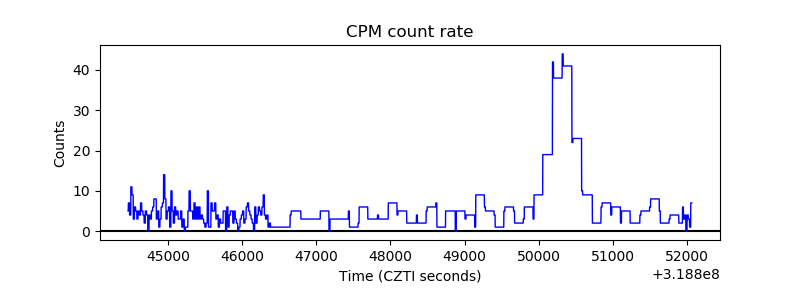 |
| CZT Counter | 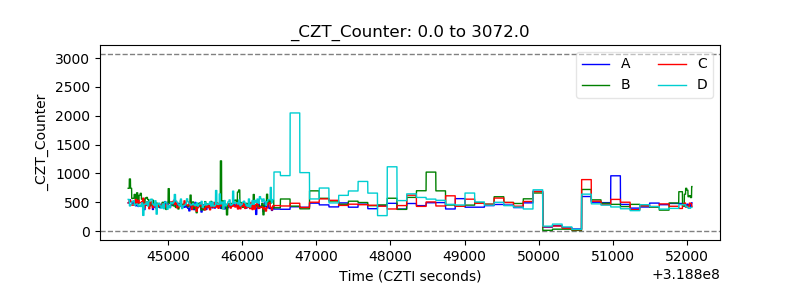 |
| +2.5 Volts monitor |  |
| +5 Volts monitor |  |
| _ROLL_ROT | 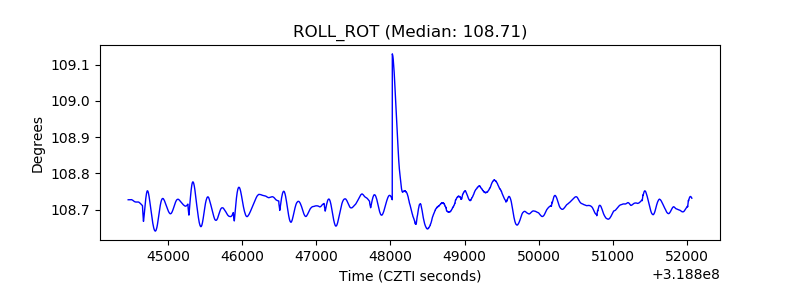 |
| _Roll_DEC | 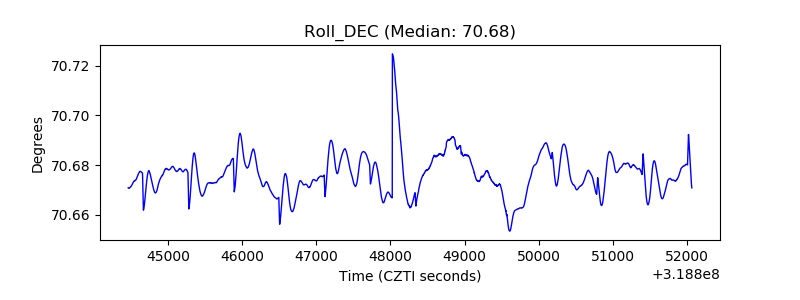 |
| _Roll_RA | 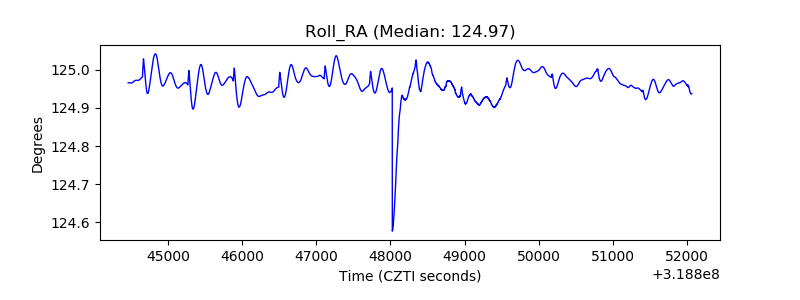 |
| Veto Counter | 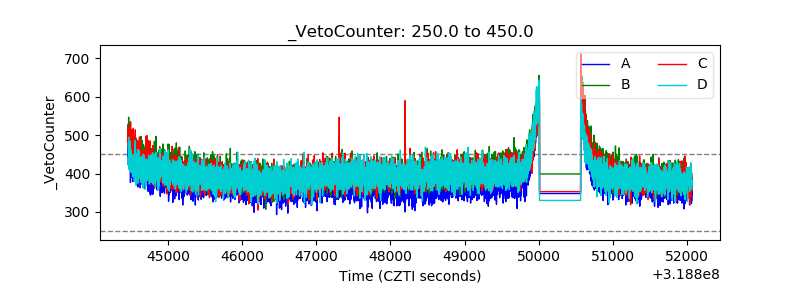 |