| Param | Original file | Final file |
|---|---|---|
| Filename | modeM0/AS1A07_054T01_9000003486_23599cztM0_level2.evt | modeM0/AS1A07_054T01_9000003486_23599cztM0_level2_quad_clean.evt |
| Size (bytes) | 492,045,120 | 129,591,360 |
| Size | 469.3 MB | 123.6 MB |
| Events in quadrant A | 3,234,052 | 888,318 |
| Events in quadrant B | 4,033,548 | 879,752 |
| Events in quadrant C | 3,254,488 | 841,109 |
| Events in quadrant D | 3,900,390 | 824,558 |
| Mode SS | |||
|---|---|---|---|
| Quadrant | BADHDUFLAG | Total packets | Discarded packets |
| A | 0 | 144 | 0 |
| B | 0 | 144 | 0 |
| C | 0 | 144 | 0 |
| D | 0 | 144 | 0 |
| Mode M9 | |||
|---|---|---|---|
| Quadrant | BADHDUFLAG | Total packets | Discarded packets |
| A | 0 | 3 | 0 |
| B | 0 | 3 | 0 |
| C | 0 | 3 | 0 |
| D | 0 | 3 | 0 |
| Mode M0 | |||
|---|---|---|---|
| Quadrant | BADHDUFLAG | Total packets | Discarded packets |
| A | 0 | 14373 | 1 |
| B | 0 | 16409 | 1 |
| C | 0 | 14365 | 1 |
| D | 0 | 16308 | 1 |
| Quadrant | Total seconds | Saturated seconds | Saturation percentage |
|---|---|---|---|
| A | 7052 | 74 | 1.049348% |
| B | 7052 | 211 | 2.992059% |
| C | 7052 | 102 | 1.446398% |
| D | 7053 | 103 | 1.460371% |
Noise dominated data is calculated using 1-second bins in cleaned event files. If a bin has >2000 counts, and if more than 50% of those come from <1% of pixels, then it is considered to be noise-dominated and hence unusable.
| Quadrant | # 1 sec bins | Bins with >0 counts | Bins with >2000 counts | High rate bins dominated by noise | Noise dominated (total time) | Noise dominated (detector-on time) | Marked lightcurve |
|---|---|---|---|---|---|---|---|
| A | 7327 | 7053 | 0 | 0 | 0.00% | 0.00% | 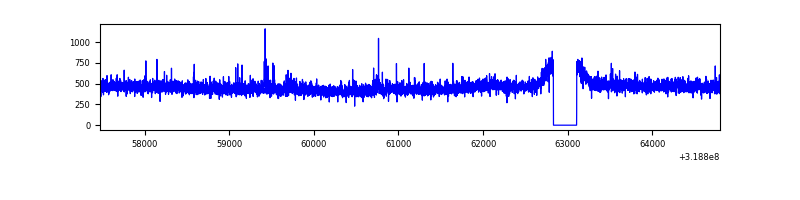 |
| B | 7327 | 7053 | 110 | 110 | 1.50% | 1.56% | 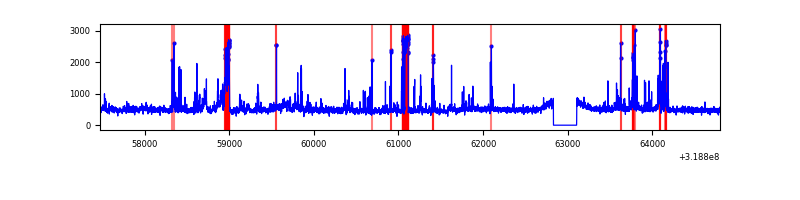 |
| C | 7327 | 7052 | 0 | 0 | 0.00% | 0.00% | 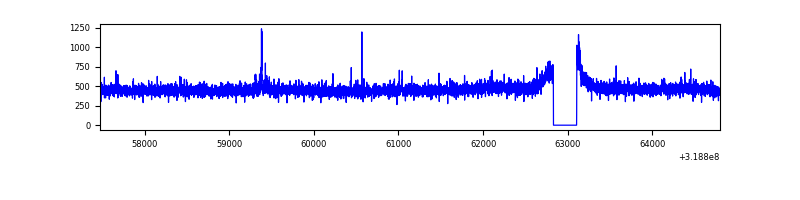 |
| D | 7328 | 7053 | 40 | 40 | 0.55% | 0.57% | 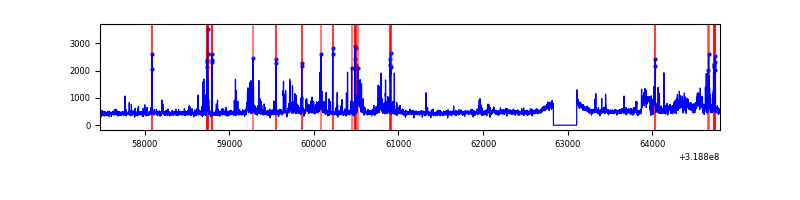 |
Top three noisy pixels from each quadrant. If the there are fewer than three noisy pixels in the level2.evt file, extra rows are filled as -1
| Pixel properties | Quadrant properties | ||||||
|---|---|---|---|---|---|---|---|
| Quadrant | DetID | PixID | Counts | Sigma | Mean | Median | Sigma |
| A | 6 | 16 | 20630 | 117.32 | 833 | 813 | 168.9 |
| A | 13 | 254 | 12471 | 69.02 | 833 | 813 | 168.9 |
| A | 3 | 137 | 7347 | 38.68 | 833 | 813 | 168.9 |
| B | 3 | 64 | 556919 | 3563.91 | 818 | 795 | 156.0 |
| B | 0 | 189 | 113303 | 721.01 | 818 | 795 | 156.0 |
| B | 0 | 230 | 31043 | 193.84 | 818 | 795 | 156.0 |
| C | 14 | 238 | 127287 | 687.0 | 790 | 791 | 184.1 |
| C | 7 | 247 | 20589 | 107.52 | 790 | 791 | 184.1 |
| C | 0 | 10 | 11258 | 56.85 | 790 | 791 | 184.1 |
| D | 1 | 52 | 300701 | 1545.8 | 801 | 776 | 194.0 |
| D | 9 | 85 | 260725 | 1339.76 | 801 | 776 | 194.0 |
| D | 12 | 233 | 213865 | 1098.25 | 801 | 776 | 194.0 |
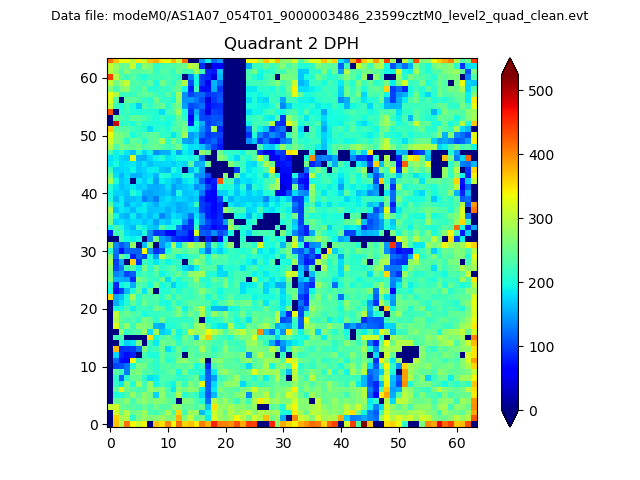
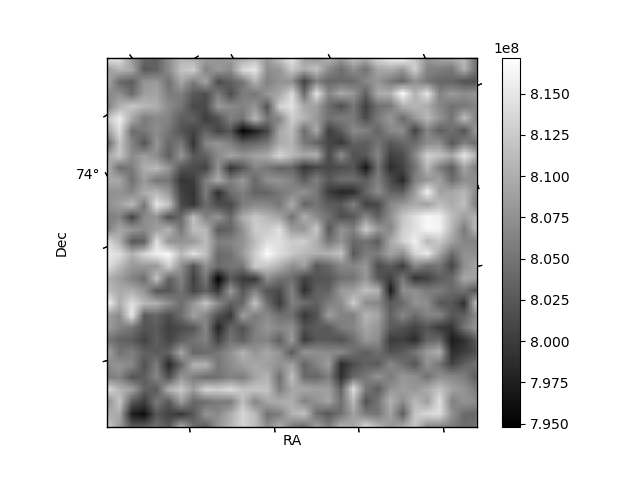
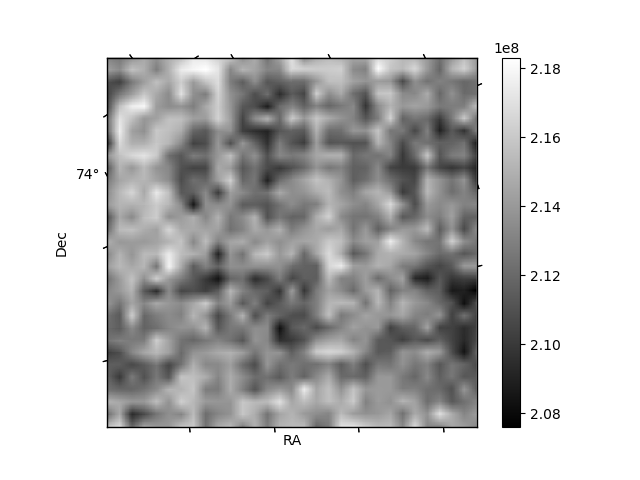
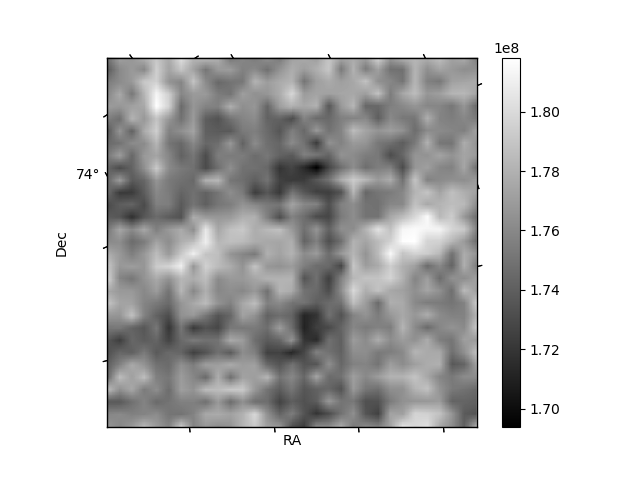
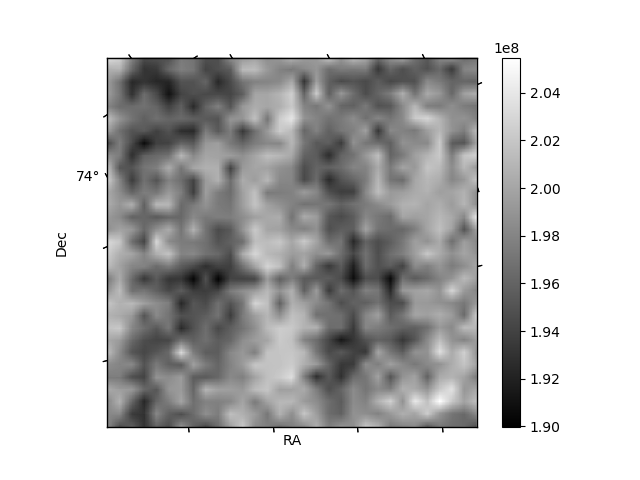
Histogram calculated using DETX and DETY for each event in the final _common_clean file
| Quadrant A | 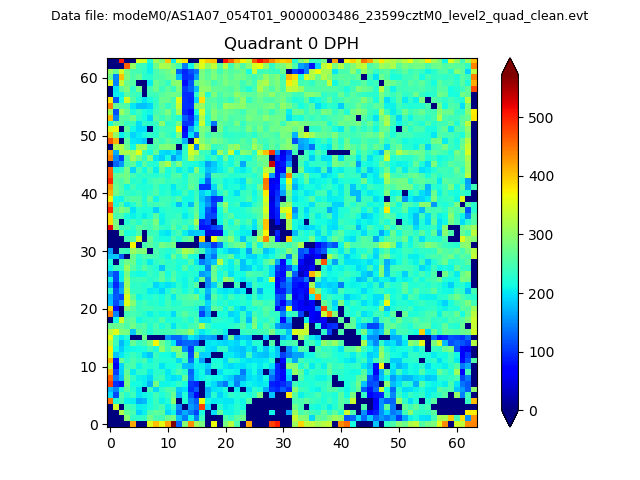 |
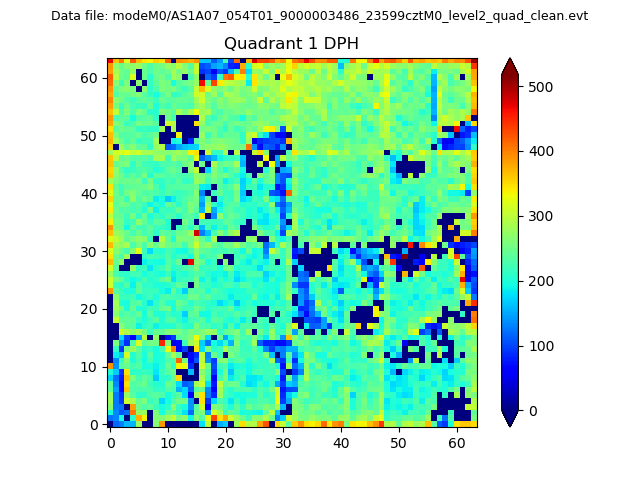 |
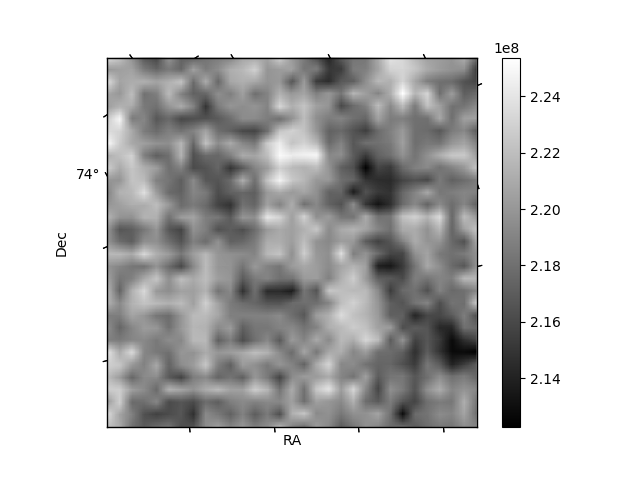
Quadrant B |
|---|---|---|---|
| Quadrant D | 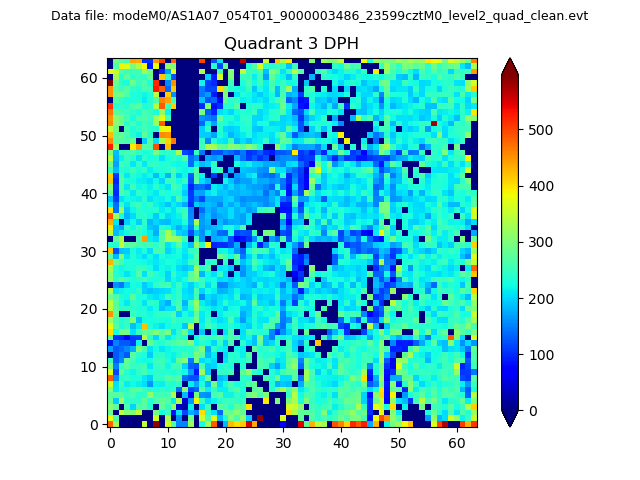 |
 |
Quadrant C |
| Plot type | Count rate plots | Images |
|---|---|---|
| Comparison with Poisson distribution Blue bars denote a histogram of data divided into 1 sec bins. Red curve is a Poisson curve with rate = median count rate of data. |
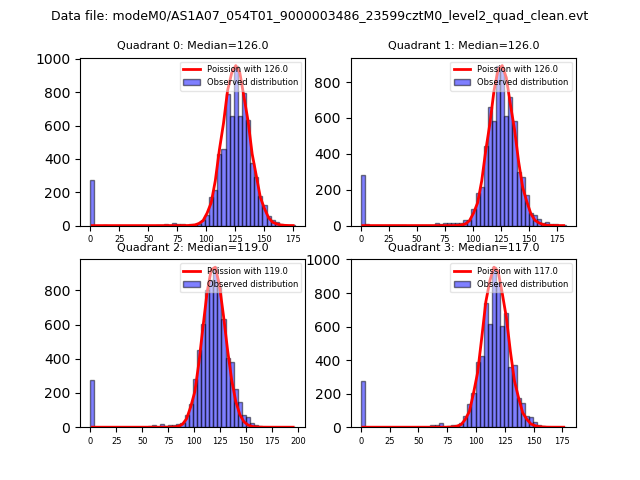 |
 |
| Quadrant-wise count rates Data is divided into 100 sec bins |
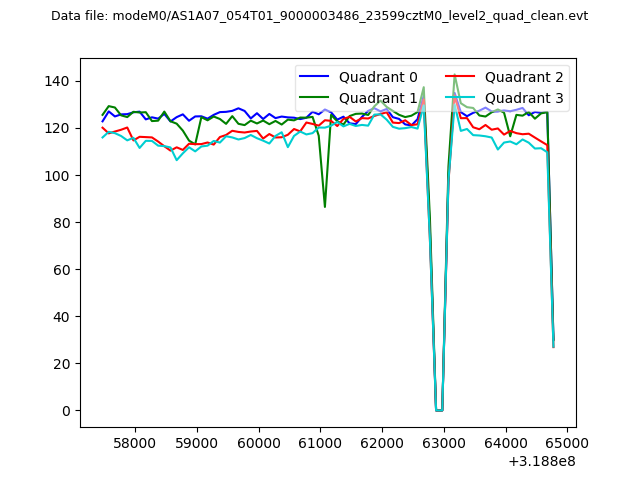 |
|
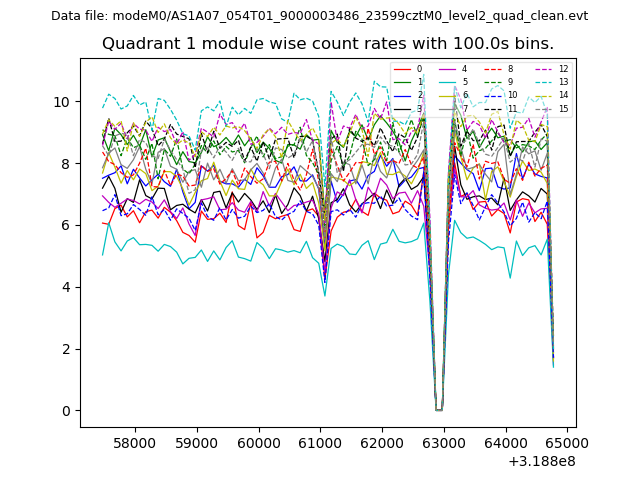
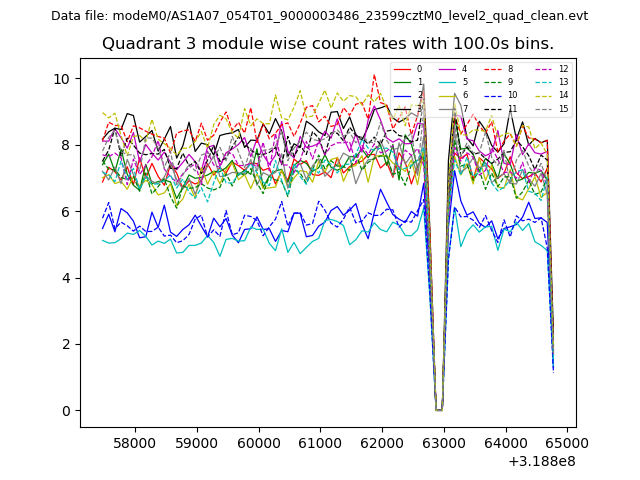
| Module-wise count rates for Quadrant A Data is divided into 100 sec bins |
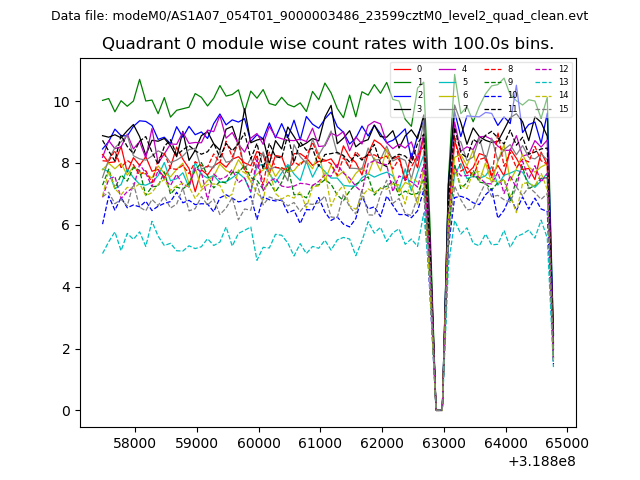 |
 |
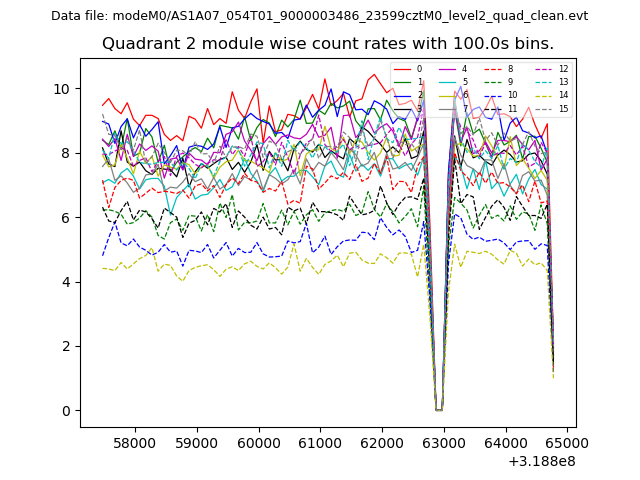
| Module-wise count rates for Quadrant B Data is divided into 100 sec bins |
 |
 |
| Module-wise count rates for Quadrant C Data is divided into 100 sec bins |
 |
 |
| Module-wise count rates for Quadrant D Data is divided into 100 sec bins |
 |
 |
| Parameter | Plot |
|---|---|
| CZT HV Monitor | 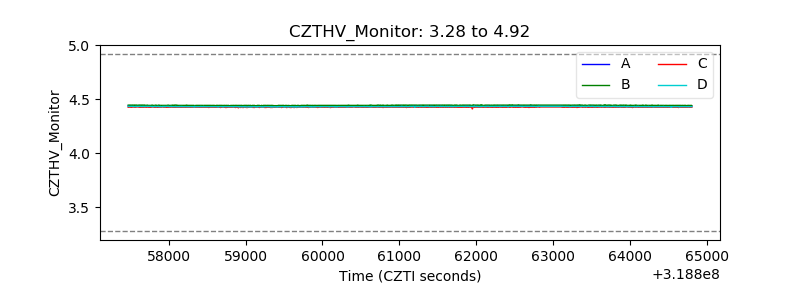 |
| D_VDD | 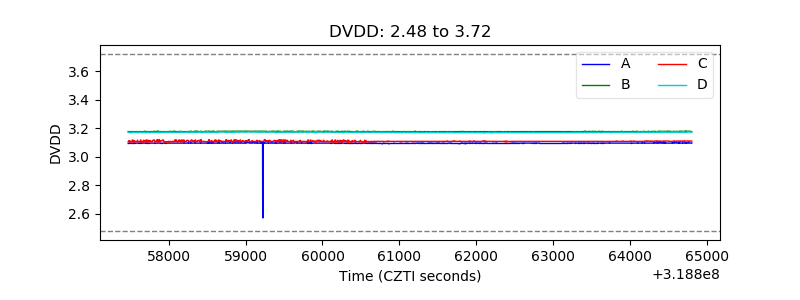 |
| Temperature 1 | 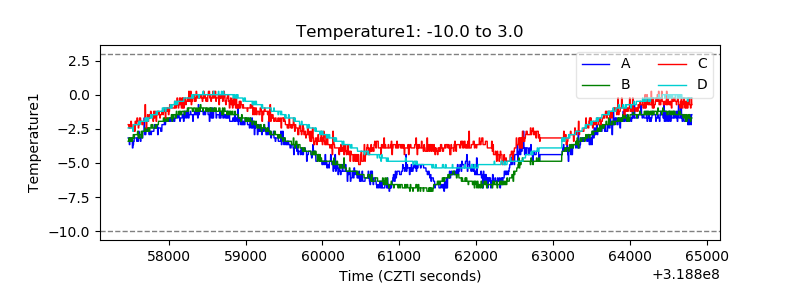 |
| Veto HV Monitor | 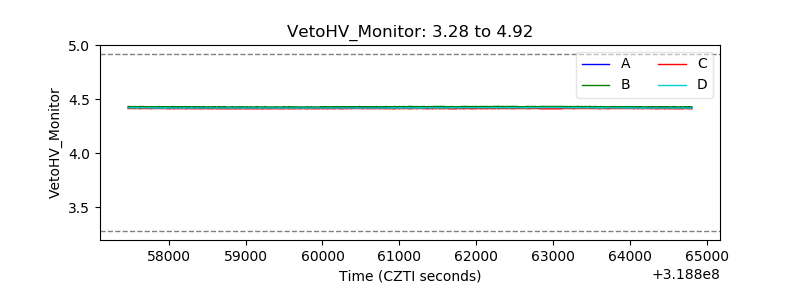 |
| Veto LLD | 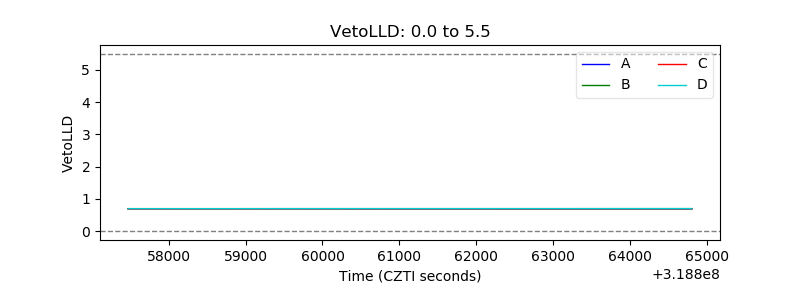 |
| Alpha Counter | 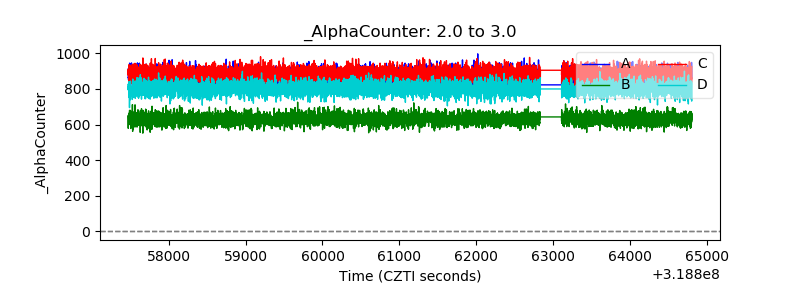 |
| _CPM_Rate | 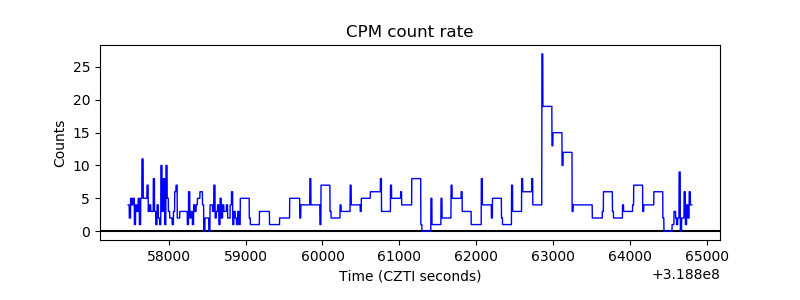 |
| CZT Counter | 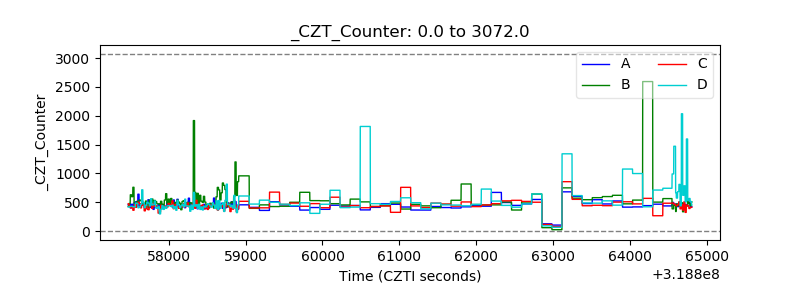 |
| +2.5 Volts monitor |  |
| +5 Volts monitor | 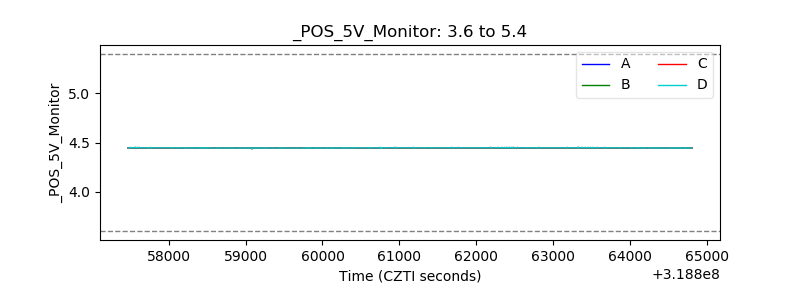 |
| _ROLL_ROT | 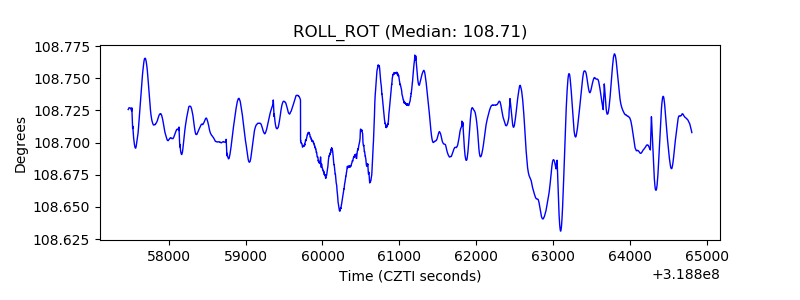 |
| _Roll_DEC | 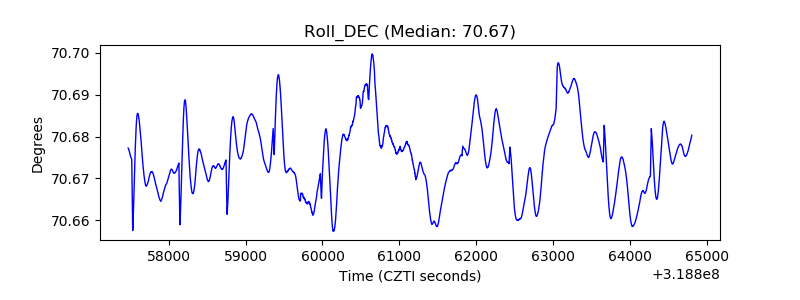 |
| _Roll_RA | 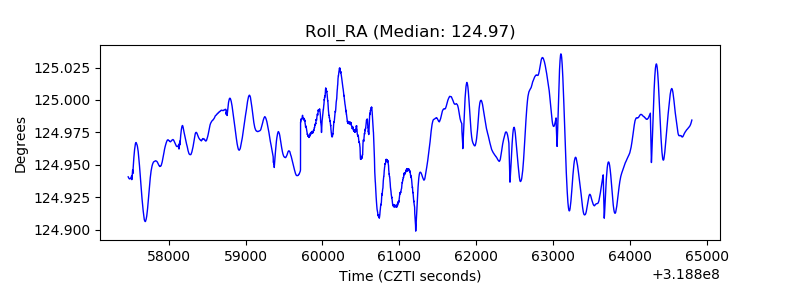 |
| Veto Counter | 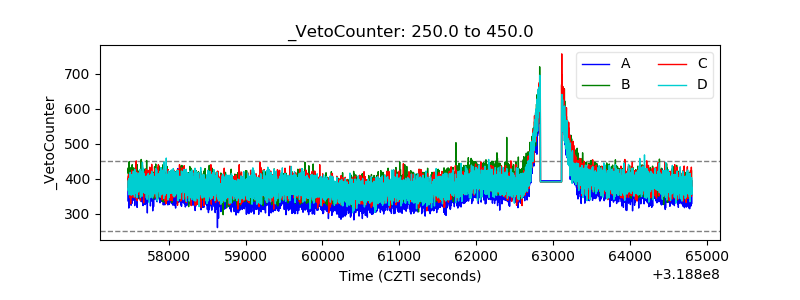 |